Visual Analytics
This research focuses on systems that support the interactive visual analysis of big or complex data. Such analysis enables users to leverage their existing domain or other knowledge, including common sense, during the analysis process. Visual Analytics also is a key part of creating visualizations to communicate insights gathered from the data to others, including stakeholders.
@comment{c, c={STYLE: Author entry should be in "[von] Last [Jr.], First and ..." format}}
@comment{c, c={STYLE: Author trailing* on last name is grad, trailing+ is undergrad student}}
@comment{c, c={STYLE: no year or series or publisher name in booktitle}}
@comment{c, c={STYLE: series should have format "ACRONYM '##", with 2-digit year}}
@comment{c, c={STYLE: conference articles published in journal have conference name in note= and journal acronym in series=}}
@comment{c, c={STYLE: articleno= and numpages= are both supported}}
@comment{c, c={STYLE: pdf= is link to PDF, video= is link to video, teaser= is link to teaser image}}
@comment{c, c={STYLE: doi= is link to doi (or publisher page), url= is link to webpage}}
@comment{c, c={STYLE: note= shows up in the list, footnote= shows up in the individual pages}}
@comment{c, c={STYLE: footnote= is the right place for pdf2, url2, video2, other supplementary materials, etc.}}
@comment{c, c={STYLE: to comment out a field, just prefix it with "commented-", e.g., "commented-year"}}
@comment{c, c={canonical field order: 'title', 'author', 'journal', 'booktitle', 'publisher', 'series', 'issn', 'isbn', 'institution', 'school', 'type', 'howpublished', 'year', 'month', 'volume', 'number', 'pages', 'articleno', 'numpages', 'doi', 'url', 'pdf', 'video', 'teaser', 'abstract', 'keywords', 'award', 'note', 'footnote'}}
@comment{***************************books&special_issues*******************************}
@comment{zachman2025special,
title = {Special Section on the Best Papers of the 20th EuroXR International Conference (EuroXR 2023)},
author = {Walczak, Krzysztof and Zachmann, Gabriel and Niamut, Omar A. and Johnsen, Kyle and Stuerzlinger, Wolfgang and Bourdot, Patrick and Welch, Greg and Alcaniz Raya, Mariano},
journal = {Computers & Graphics},
publisher = {Elsevier},
series = {C&G},
year = {2025},
month = {Nov},
commented-volume = {48},
commented-number = {C},
pages = {1-2},
commented-doi = {https://doi.org/10.1016/j.cag.2025.00.000},
abstract = {We are delighted to introduce this special section of Computers & Graphics, which presents extended versions of the best papers selected from the 20th EuroXR International Conference (EuroXR 2023). The conference was held in Rotterdam, The Netherlands, from November 29 to December 1, 2023, co-located with the Immersive Tech Week. It continues a rich tradition of EuroXR events focused on advances in Virtual, Augmented, and Mixed Reality (VR, AR, MR), collectively referred to as Extended Reality (XR). Since its inception in 2004 under the INTUITION Network of Excellence and subsequent evolution into the EuroXR International Conference, the event has consistently served as a platform to present cutting-edge research, foster collaborations among academia, industry, and public institutions, and promote the adoption of XR technologies across various domains.
The scientific track of EuroXR 2023 maintained a rigorous review process to ensure high quality and impact. A total of 42 papers were submitted to the scientific program, out of which 14 were accepted (an acceptance rate of 33%) across different categories: long, medium, and short papers. Each submission underwent a thorough double-blind peer review process by at least three independent experts, followed by a rebuttal phase and final discussions among the reviewers. The scientific program chairs then made final decisions based on comprehensive meta-reviews. A dedicated Best Papers Awards Committee subsequently evaluated the accepted papers, identifying outstanding contributions, which were then invited for significant extension and re-review for publication in this special section of Computers & Graphics.
The two articles presented here exemplify the diversity and high quality of research at EuroXR 2023:
Enhancing anatomy learning through collaborative VR? An advanced investigation by Haya Almaree, Roland Fischer, René Weller, Verena Uslar, Dirk Weyhe, and Gabriel Zachmann explores the potential benefits of collaborative VR learning environments in medical education. The authors developed a multi-user VR Anatomy Atlas and conducted two comprehensive user studies comparing individual and collaborative learning modes. Their findings offer valuable insights into the effectiveness, usability, and motivational aspects of collaborative VR learning, suggesting that although collaboration does not necessarily enhance learning outcomes or motivation in anatomy education, it opens important questions regarding cognitive load and system usability that require further research.
Psychophysiology of rhythmic stimuli and time experience in virtual reality by Stéven Picard and Jean Botev investigates how rhythmic auditory and visual stimuli influence users' perception of time and task performance within VR environments. The authors systematically analyze the interplay between sensory stimuli, physiological responses (such as eye-tracking data and body temperature), and subjective time estimation. Their results reveal nuanced relationships between stimulus modality, tempo, fatigue, and time perception, offering promising directions for designing VR environments that strategically modulate user experience through rhythm and sensory cues.
Collectively, these papers highlight valuable advancements at the intersection of XR technology, human factors, education, and psychophysiology. They demonstrate how XR can be leveraged not only to improve learning and interaction but also to deepen our understanding of human cognitive and sensory experiences in immersive contexts.
We express our sincere gratitude to all the authors for their outstanding contributions and to the reviewers for their thorough work in maintaining the high standards of Computers & Graphics. We also extend special thanks to the EuroXR 2023 Organizing Committee and the Immersive Tech Week team for hosting a vibrant conference that successfully bridged research, practice, and innovation in Extended Reality.
For further information about EuroXR and future conferences, please visit the official EuroXR Association website at https://www.euroxr-association.org.
We hope that readers will find these contributions as inspiring and thought-provoking as we did.},
keywords = {3D user interfaces, virtual reality, augmented reality},
note = {To appear},
}
@proceedings{zachman2023euroxr,
title = {Virtual Reality and Mixed Reality, 20th EuroXR International Conference},
author = {Zachmann, Gabriel and Walczak, Krzysztof and Niamut, Omar A. and Johnsen, Kyle and Stuerzlinger, Wolfgang and Alcaniz Raya, Mariano and Bourdot, Patrick and Welch, Greg},
publisher = {Springer},
series = {EuroXR '23},
volume = {LNCS 14410},
year = {2023},
month = {Nov},
doi = {https://doi.org/10.1007/978-3-031-48495-7},
teaser = {teasers/EuroXR23.png},
abstract = {We are pleased to present in this LNCS volume the scientific proceedings of the 20th EuroXR International Conference (EuroXR 2023), organized in colocation with the Immersive Tech Week, Rotterdam, the Netherlands, and held during November 29 – December 1, 2023.
This conference follows a series of successful international conferences initiated in 2004 by the INTUITION Network of Excellence on Virtual and Augmented Reality, which was supported by the European Commission until 2008. From 2009 through 2013, it was embedded in the Joint Virtual Reality Conferences (JVRC). Since then, it was known as EuroVR, then EuroXR International Conference, in line with the renaming of the umbrella association.
The focus and aim of the EuroXR conferences is to present, each year, novel results and insights in Virtual Reality (VR), Augmented Reality (AR), and Mixed Reality (MR), commonly referred to under the umbrella of Extended Reality (XR), including software systems, immersive rendering technologies, 3D user interfaces, and applications. EuroXR also aims to foster engagement between European industries, academia, and the public sector, to promote the development and deployment of XR techniques in new and emerging, but also in existing fields. To this end, all EuroXR conferences include not only a scientific track, but also an application-oriented track, with its own proceedings.
Since 2017, the EuroXR Association has collaborated with Springer to publish the proceedings of the scientific track of its annual conference. In order to maintain the scientific standards to be expected from such a conference, we established a number of committees overseeing the process of creating a scientific program: the scientific program chairs, leading an International Program Committee (IPC) made up of international experts in the field, and the EuroXR academic task force.
For the 2023 issue, a total of 42 papers were submitted, out of which 14 papers were accepted (4 long, 8 medium, and 2 short papers). This amounts to an acceptance ratio of 33%. The selection process involved a double-blind peer-review process (each and every paper was reviewed by at least 3 members of the IPC, in many cases even 4), followed by a rebuttal phase, and a final discussion and scoring phase amongst the revewiers. Based on the review reports, the scores, and the reviewers’ discussions, the scientific program chairs took the final decision and wrote a meta-review for each paper.
This year, the scientific program of EuroXR and, hence, this LNCS volume, is organized into three sections: Interaction in Virtual Reality, Designing XR Experiences, and Human Factors in VR: Performance, Acceptance, and Design.
In addition to the regular scientific papers track, EuroXR invited three keynote speakers: Tabitha C. Peck (Davidson College, Davidson, NC, USA), Ferran Argelaguet (Research Scientist, Hybrid team, IRISA/Inria, Rennes, France), and Zerrin Yumak (Assistant Professor of Utrecht University, The Netherlands). Furthermore, the conference hosted an application track, demos and posters sessions, and lab tours. Finally, there were dedicated sessions, for instance, by Greg Welch on VERA, and a workshop on “Vocational Training”.
We would like to thank all the IPC members and external reviewers for their insightful reviews, which helped ensure the high quality of papers selected for the scientific track. Furthermore, we would like to thank the application chairs, demos and posters chairs, and the local organizers of EuroXR 2023.
We are also grateful to the staff of Springer for their support and advice during the preparation of this LNCS volume.},
keywords = {virtual reality, augmented reality, extended reality},
}
@proceedings{teather2020vrstproceedings,
title = {26th Symposium on Virtual Reality Software and Technology 2020},
author = {Teather, Robert J. and Joslin, Chris and Stuerzlinger, Wolfgang and Figueroa, Pablo and Hu, Yaoping and Batmaz, Anil Ufuk and Lee, Wonsook and Ortega, Francisco},
publisher = {ACM},
series = {VRST '20},
year = {2020},
month = {Nov},
doi = {https://doi.org/10.1145/3385956},
teaser = {teasers/VRST2020.png},
abstract = {Welcome to the 26th ACM Symposium on Virtual Reality Software and Technology (VRST 2020) for exchanging knowledge and experience. It is our pleasure to virtually host VRST 2020 from Ottawa, Canada, for the safety of attendees, due to the on-going COVID-19 pandemic.
As a premier international forum for advanced in virtual reality technology, VRST 2020 received 132 paper submissions from all continents. Its program committee (PC) consisted of 27 esteemed researchers to coordinate additional 176 expert reviewers. Each submission underwent at least three reviews for its novelty, technical quality, and impact to the field. The final program of VRST 2020 was thus composed of 28 full papers and 7 short papers, yielding an overall acceptance rate of 26%. The topics of these papers ranged from simulation & graphics, 3D reconstruction & computer vision, haptics, navigation & locomotion, collaborations, avatars, and display & visual perception, to applications. In addition, a total of 59 posters and demos were submitted, and 43 of these were accepted to the technical program.
Moreover, the program was honoured by two distinguished keynote speakers: Doug Bowman from Virginia Tech University (USA) and Mary Whitton of the University of North Carolina at Chapel Hill (USA). As two of the foremost names in the field of virtual reality, they presented stimulating insights to energize the program and provide invaluable insights to new and seasoned researchers alike.
Special thanks are extended to the PC members and expert reviewers for all their dedicated efforts and thoughtful reviews. Their hard work uniquely empowered the program to be interesting.
We hope that attendees will find VRST 2020 inspiring, as it spotlights the latest research in the growing field of Virtual Reality. The event aims to foster collaboration and instigate further growth in this exciting field.},
keywords = {3D user interfaces, virtual reality},
}
@book{marriott2018immersiveanalytics,
title = {Immersive Analytics},
author = {Marriott, Kim and Schreiber, Falk and Dwyer, Tim and Klein, Karsten and Henry Riche, Nathalie and Itoh, Takayuki and Stuerzlinger, Wolfgang and Thomas, Bruce H.},
publisher = {Springer},
year = {2018},
month = {Oct},
volume = {LNCS 11190},
numpages = {371},
doi = {https://doi.org/10.1007/978-3-030-01388-2},
teaser = {teasers/iabook.png},
abstract = {We live in an age where the amount and complexity of data available to us far surpass our ability to understand or to utilise them in decision-making. Analysis of such data is not only common in the physical, social, and life sciences, but is becoming an integral part of effective planning in business, government, e-health, and many other aspects of modern society. Furthermore data analytics is no longer solely the preserve of scientists and professional analysts as personalised data analytics becomes increasingly common.
Visual analytics has become a key technology for human-in-the-loop data analysis. While the standard definition for visual analytics is agnostic of the actual interface devices employed by visual analytics systems, the affordances of the display and input devices used for analysing data strongly affect the experience of the users of such systems and, thereby, their degree of engagement and productivity. For practical visual analytics tools, the platform for interaction is almost always a standard desktop computer. A systematic approach to developing analysis and decision support tools that move beyond the desktop is lacking.
Immersive analytics is a new interdisciplinary field that brings together researchers and practitioners from data visualisation, visual analytics, virtual and mixed reality, human–computer interaction, and human-in-the-loop algorithmics to explore these new forms of analytics tools. The goal is to remove barriers between people, their data, and the tools they use for analysis by developing more engaging, embodied analysis tools that support data understanding and decision-making everywhere and by everyone, either working individually or collaboratively.
This book is the outcome of two coordinated workshops on immersive analytics held in 2016. The first in Shonan, Japan, took place in February and organised by Takayuki Itoh, Kim Marriott, Falk Schreiber, and Uwe Wössner with the help of Karsten Klein, the second was held in June at Dagstuhl, Germany, and was organised by Tim Dwyer, Nathalie Henry Riche, Wolfgang Stuerzlinger, and Bruce H. Thomas, again with the help of Karsten Klein. In all, 25 leading international experts in data visualisation, visual analytics, human–computer interaction, virtual reality and augmented reality attended the first workshop, with another 38 experts attending the second. There was a sizeable overlap of experts between the two workshops that provided a sensible continuity of concepts.
The two workshops explored the definition of immersive analytics and identified the structure and focus of this book. A working group for each chapter was formed at the workshops, with the participation of invited experts as needed, and the groups wrote the chapters contained in this book. A critical goal was to develop a vision of the research domain for immersive analytics and a roadmap for future investigations. Authors submitted manuscripts for their chapters in mid-2017. These initial versions were first reviewed "internally" by one of the book editors. After an initial round of revision based on these internal reviews, the updated manuscripts were sent to expert reviewers invited from the community. We are grateful to these people for their detailed and insightful reviews.},
keywords = {immersive analytics, visual analytics, visualization},
}
@proceedings{arif2018socio,
title = {Socio-Technical Aspects of Text Entry: {MobileHCI} 2018 Workshop},
author = {Arif, Ahmed Sabbir and Stuerzlinger, Wolfgang and Dunlop, Mark D. and Yi, Xin and Seim, Caitlyn},
series = {TEXT '18},
year = {2018},
month = {Sep},
url = {http://ceur-ws.org/Vol-2183},
teaser = {teasers/TEXT2018.png},
abstract = {Mobile text entry has become an integral part of our daily life. We regularly input text on smartphones, laptops, desktops and increasingly on smartwatches, VR systems, interactive tabletops/walls, and kiosks. This text entry is done in all social settings, from solo individuals writing private notes, through social networking in bars with friends, to jointly writing on collaborative devices in public spaces. Traditional tap-based input is increasingly being replaced with or supplemented by voice input or multimodal control. With the ubiquity of text entry, it is becoming increasingly important to consider socio-technical systems perspectives in the design, development, and evaluation of new techniques. The purpose of this one-day workshop is to share and encourage research exploring various socio-technical aspects of text entry, including social and cultural impacts, developing socially and culturally acceptable techniques, and techniques to support all users of varying ages, social and technical backgrounds, language, and physical abilities.},
keywords = {text entry},
}
@proceedings{banic2015suiproceedings,
title = {3rd Symposium on Spatial User Interaction 2015},
author = {Banic, Amy and Suma, Evan and Steinicke, Frank and Stuerzlinger, Wolfgang},
publisher = {ACM},
series = {SUI '15},
year = {2015},
month = {Aug},
doi = {https://doi.org/10.1145/2788940},
teaser = {teasers/SUI2015.png},
abstract = {It is our great pleasure to welcome you to the third ACM Symposium on Spatial User Interaction. This event focuses on the user interface challenges that appear when users interact in the space where the flat, two-dimensional, digital world meets the volumetric, physical, three-dimensional (3D) space we live in. The symposium considers both spatial input as well as output, with an emphasis on the issues around the interaction between humans and systems. Due to the advances in 3D technologies, spatial interaction is now more relevant than ever. Powerful graphics engines and high-resolution screens are now ubiquitous in everyday devices, such as tablets and mobile phones. Moreover, new forms of input, such as multi-touch, finger and body tracking technologies are now easily available, and more and more commercial 3D systems with spatial interaction capabilities exist, many priced at the consumer level. However, the challenges, limitations, and advantages of leveraging this third dimension in human-computer interfaces are still not yet fully understood. These questions will only become more relevant as these emerging technologies continue to cross the barrier towards wide adoption.
The call for papers attracted 48 submissions from Asia, Europe, Australia, and North and South America in all areas of Spatial User Interaction research. The international program committee consisting of 19 experts in the topic areas and the three program chairs handled the review process. Eight submissions were reviewed by the program chairs and rejected without further review due to being incomplete, insufficient quality, or inappropriate for the symposium topic. All other submissions received at least four detailed reviews, two from members of the international program committee and two or more from external reviewers. The reviewing process was double-blind, with the authors' identities visible only to the program chairs and the primary program committee member assigned to the paper. In the end, the program committee accepted 17 papers (10 long, 7 short), corresponding to an overall acceptance rate of 35%. Additionally, 11 posters complement the program and appear in the proceedings. Furthermore, three research demonstrations were accepted and will be presented at the symposium. We also encourage attendees to attend the keynote talk, TRANSFORM: Beyond Tangible Bits, Towards Radical Atoms, presented by Hiroshi Ishii from the MIT Media Lab.},
keywords = {3D user interfaces, virtual reality},
}
@article{steinicke2015spatial,
title = {Spatial Interfaces},
author = {Steinicke, Frank and Stuerzlinger, Wolfgang},
journal = {Computer Graphics and Applications},
publisher = {IEEE},
series = {CG&A},
year = {2015},
month = {Jul},
volume = {35},
number = {4},
pages = {6-7},
doi = {https://doi.org/10.1109/MCG.2015.92},
abstract = {CG&A welcomes Frank Steinicke (University of Hamburg) and Wolfgang Stuerzlinger (Simon Fraser University) as new members to its editorial board and as the new coeditors of the Spatial Interfaces department.},
keywords = {3D user interfaces, virtual reality},
}
@article{steinicke2015special,
title = {Special Section on Spatial User Interaction},
author = {Steinicke, Frank and Stuerzlinger, Wolfgang and Suma, Evan},
journal = {Computers & Graphics},
publisher = {Elsevier},
series = {C&G},
year = {2015},
month = {May},
volume = {48},
number = {C},
pages = {A1-A2},
doi = {https://doi.org/10.1016/j.cag.2015.03.002},
abstract = {It is our great pleasure to present you with the Computers & Graphics special section on Spatial User Interaction (SUI). The special section contains extended versions of the best scientific papers from the 2nd ACM Symposium on Spatial User Interaction (SUI׳14), which was held Oct. 4–5, 2014 in Honolulu, USA. The SUI symposium focuses on the user interface challenges that appear when users interact in the space where the flat, two-dimensional, digital world meets the volumetric, physical, three-dimensional (3D) space we live in. This considers both spatial input as well as output, with an emphasis on the issues around the interaction between humans and systems. The goal of the symposium is to provide an intensive exchange between academic and industrial researchers working in the area of SUI and to foster discussions among participants.
The symposium call for papers attracted 62 submissions from Asia, Europe, Australia, and North and South America in all areas of Spatial User Interaction research. The international program committee consisting of 19 experts in the topic areas and the two program chairs handled the highly competitive and selective review process. In the end, the program committee accepted overall 18 (11 long papers plus 7 short papers) out of 62 submissions, which corresponds to an acceptance rate of 29% in total.
The SUI׳14 award chairs, Bruce Thomas from the University of South Australia and Patrick Baudisch from the Hasso-Plattner-Institut in Germany, selected the best full and best short papers from these 18 submissions, which received the invitation to be published as extended articles in this special section:
The article "Coordinated 3D Interaction in Tablet- and HMD-Based Hybrid Virtual Environments" written by Jia Wang, Robert Lindeman proposes a novel spatial interactive solution using a coordinated, tablet- and HMD-based, hybrid virtual environment system.
The article "Principles, Interactions and Devices for Real-World Immersive Modeling" co-authored by Mark Mine, Arun Yoganandan, and Dane Coffey presents an approach that combines the natural and intuitive power of virtual reality interaction, the precision and control of 2D touch surfaces, and the richness of a commercial modeling package.
The article "VideoHandles: Searching through Action Camera Videos by Replicating Hand Gestures" by Jarrod Knibbe, Sue Ann Seah, and Mike Fraser introduces a detailed exploration of VideoHandles, a novel interaction technique to support rapid review of wearable video camera data by re-performing gestures as a search query.},
keywords = {3D user interfaces, virtual reality},
}
@proceedings{steinicke2014suiproceedings,
title = {2nd Symposium on Spatial User Interaction 2014},
author = {Steinicke, Frank and Stuerzlinger, Wolfgang and Suma, Evan},
publisher = {ACM},
series = {SUI '14},
year = {2014},
month = {Oct},
doi = {https://doi.org/10.1145/2659766},
teaser = {teasers/SUI2014.png},
abstract = {It is our great pleasure to welcome you to the second ACM Symposium on Spatial User Interaction - SUI'14. This event focuses on the user interface challenges that appear when users interact in the space where the flat, two-dimensional, digital world meets the volumetric, physical, threedimensional (3D) space we live in. This considers both spatial input as well as output, with an emphasis on the issues around the interaction between humans and systems. The goal of the symposium is to provide an intensive exchange between academic and industrial researchers working in the area of SUI and to foster discussions among participants. The SUI symposium was held October 4-5, 2014, in Honolulu, USA.
The call for papers attracted 62 submissions from Asia, Europe, Australia, and North and South America in all areas of Spatial User Interaction research. The international program committee consisting of 19 experts in the topic areas and the three program chairs handled the highly competitive and selective review process. Every submission received at least four detailed reviews, two from members of the international program committee and two or more from external reviewers. The reviewing process was double-blind, where only the program chairs as well as the program committee member, who was assigned to each paper to identify external reviewers, knew the identity of the authors. In the end, the program committee accepted overall 18 (11 long papers plus 7 short papers) out of 62 submissions, which corresponds to an acceptance rate of 29% in total. Additionally, 25 posters complement the program and appear in the proceedings. Furthermore, several demos were presented at the symposium. The topics range from spatial interaction techniques, gestures, vision in 3D space, spatial applications, to interaction with multi-touch technologies and spatial interaction in augmented reality. We hope that these proceedings will serve as a valuable reference for Spatial User Interaction researchers and developers.},
keywords = {3D user interfaces, virtual reality},
}
@proceedings{daiber2013isis3dproceedings,
title = {Interactive Surfaces for Interaction with Stereoscopic {3D}: Tutorial and Workshop at {ITS} 2013},
author = {Daiber, Florian and de Araujo, Bruno Rodrigues and Steinicke, Frank and Stuerzlinger, Wolfgang},
booktitle = {Conference on Interactive Tabletops and Surfaces},
publisher = {ACM},
series = {ISIS3D '13},
year = {2013},
month = {Oct},
pages = {483–486},
doi = {https://doi.org/10.1145/2512349.2512351},
abstract = {With the increasing distribution of multi-touch capable devices multi-touch interaction becomes more and more ubiquitous. Multi-touch interaction offers new ways to deal with 3D data allowing a high degree of freedom (DOF) without instrumenting the user. Due to the advances in 3D technologies, designing for 3D interaction is now more relevant than ever. With more powerful engines and high resolution screens also mobile devices can run advanced 3D graphics, 3D UIs are emerging beyond the game industry, and recently, first prototypes as well as commercial systems bringing (auto-) stereoscopic display on touch-sensitive surfaces have been proposed. With the Tutorial and Workshop on ``Interactive Surfaces for Interaction with Stereoscopic 3D (ISIS3D)'' we aim to provide an interactive forum that focuses on the challenges that appear when the flat digital world of surface computing meets the curved, physical, 3D space we live in.},
keywords = {3D user interfaces, virtual reality},
}
@proceedings{stuerzlinger2013suiproceedings,
title = {1st Symposium on Spatial User Interaction 2013},
author = {Stuerzlinger, Wolfgang and Steinicke, Frank},
publisher = {ACM},
series = {SUI '13},
year = {2013},
month = {Jul},
doi = {https://doi.org/10.1145/2491367},
teaser = {teasers/SUI2013.png},
abstract = {It is our great pleasure to welcome you to the first ACM Symposium on Spatial User Interaction - SUI'13. This new event focuses on the user interface challenges that appear when users interact in the space where the flat, twodimensional, digital world meets the volumetric, physical, three-dimensional (3D) space we live in. This considers both spatial input as well as output, with an emphasis on the issues around the interaction between humans and systems. The goal of the symposium is to provide an intensive exchange between academic and industrial researchers working in the area of SUI and to foster discussions among participants. The first SUI symposium was held July 20-21, 2013 in Los Angeles, USA.
The call for papers attracted 31 submissions from Asia, Europe, Australia, and North and South America in all areas of Spatial User Interaction research. The international program committee consisting of 15 experts in the topic areas and the two program chairs handled the highly competitive and selective review process. Every submission received at least four detailed reviews, two from members of the international program committee and two or more from external reviewers. The reviewing process was double-blind, where only the program chairs as well as the program committee member, who was assigned to each paper to identify external reviewers, knew the identity of the authors.
In the end, the program committee accepted overall 12 (8 full papers plus 4 short papers) out of 31 submissions, which corresponds to an acceptance rate of 26% for full papers (and 38% in total). Additionally 12 posters and demonstrations will complement the program and appear in the proceedings. The topics range from spatial interaction techniques, vision in 3D space, applications, to interaction with multi-touch technologies and in augmented reality. We hope that these proceedings will serve as a valuable reference for Spatial User Interaction researchers and developers.
Putting together the content for SUI'13 was a team effort. We first thank the authors for providing the content of the program. Special thanks go to the members of the international program committee, who successfully dealt with the reviewing load. We also thank the external reviewers.},
keywords = {3D user interfaces, virtual reality},
}
@proceedings{stuerzlinger2012vrstproceedings,
title = {Symposium on Virtual Reality Software and Technology 2012},
author = {Stuerzlinger, Wolfgang and Latoschik, Marc Erich and Kapralos, Bill},
publisher = {ACM},
series = {VRST '12},
year = {2012},
month = {Dec},
doi = {https://doi.org/10.1145/2407336},
teaser = {teasers/VRST2012.png},
abstract = {It is our great pleasure to welcome you to the 2012 ACM Symposium on Virtual Reality Software and Technology - VRST'12. VRST has become one of the major scientific events in the area of virtual reality since its debut in 1994 in Singapore. The symposium continues its tradition as an international forum for the presentation of research results and experience reports on leading edge issues of software, hardware and systems for Virtual Reality. The mission of the symposium is to share novel technologies that fulfill the needs of Virtual Reality applications and environments and to identify new directions for future research and development. VRST gives researchers and practitioners a unique opportunity to share their perspectives with others interested in the various aspects of Virtual Reality and owes its existence to a vibrant and productive research community. This year, VRST was held December 10-12, 2012 in Toronto, Ontario, Canada.
The call for papers attracted 88 submissions from Asia, Europe, Australia, and North and South America in all areas of Virtual Reality research. Particular attention was given to work on system with a special track focusing on architectures, frameworks, reusability, adaptivity, and performance testing and evaluation. An international program committee consisting of 16 experts in the topic areas and the three program chairs handled the highly competitive and selective review process. Almost every submission received four or more reviews, two from members of the international program committee and two from external reviewers. Reviewing was double-blind, where only the program chairs and the program committee member assigned to identify external reviewers knew the identity of the authors.
In the end, the program committee was able to accept 25 out of 88 submissions, which corresponds to an acceptance rate of 28%. For posters, 15 out of 32 submissions will appear in the proceedings. The topics range from tracking, augmented and mixed reality, interaction, navigation and locomotion, collaboration, haptics, simulation, agents and behaviors to two sessions for a systems track. We hope that these proceedings will serve as a valuable reference for Virtual Reality researchers and developers.},
keywords = {virtual reality, 3D user interfaces},
}
@article{bowman2009special,
title = {Special Issue on Current Trends in {3D} User Interface Research},
author = {Bowman, Doug and Fröhlich, Bernd and Kitamura, Yoshifumi and Stuerzlinger, Wolfgang},
journal = {Int. Journal of Human-Computer Studies},
publisher = {Elsevier},
series = {IJHCS},
year = {2009},
month = {Mar},
volume = {67},
number = {3},
pages = {223-224},
doi = {https://doi.org/10.1016/j.ijhcs.2008.10.003},
abstract = {Hardware, software, and in particular users now seem ready to engage with computer-generated 3D worlds and the appropriate 3D user interfaces (3D UIs) for interacting with such worlds. 3D UIs have traditionally only been used in very specific application domains such as virtual reality (VR) and augmented reality (AR) environments, digital content creation (DCC) systems, computer-aided design (CAD) systems, visualization systems, and computer games. Now they are beginning to appear in operating systems, on personal digital assistants (PDAs) and mobile phones, and in console gaming systems (e.g., Nintendo's Wii). Even 3D cinema has been given a second chance, and stereoscopic versions of movies are produced on a regular basis. Consequently, new television systems are being equipped with 3D functionality. These examples show that the demand for and the use of 3D UIs is significantly increasing.
The IEEE Symposium on 3D User Interfaces (3DUI) was established in 2006 following two successful workshops—the 2004 workshop "Beyond Wand and Glove Based Interaction" and the 2005 workshop "New Directions in 3D User Interfaces." Today, the 3DUI symposium is the premier conference for all types of 3D user interface research for desktop and off-the-desktop environments, including novel input device designs, interaction techniques, evaluation methods, and user studies.
In this special issue of IJHCS, we are pleased to present extended versions of three outstanding papers that were originally presented at the 3DUI 2007 and 3DUI 2008. An additional paper resulting from an open call was also accepted to this special issue.
The first paper, by Hachet et al. (2009), describes a set of widgets that provide a comprehensive solution for point of interest (POI) navigation in 3D environments. It allows users to quickly navigate to a particular view, explore a 3D scene, or investigate a single object in detail, and it can be used on a variety of display devices. These basic concepts are also extended to other uses beyond navigation alone.
The work by Vanacken et al. (2009) presents two new 3D selection techniques, 3D Bubble Cursor and Depth Ray. Both are targeted at selection in dense and occluded 3D virtual environments. The user studies vary both environment density and target visibility to evaluate the new techniques against a standard 3D point cursor. The effect of auditory and haptic feedback on the selection process is also investigated in a study. The results show that the new techniques enable efficient selection of hidden objects.
The paper by Pusch et al. (2009) presents a new method for providing a pseudo-haptic sensation in an augmented reality setting. The central idea is to displace the virtual representation of the hand from the actual position of the real hand depending on the strength of a virtual flow field. When a user places the hand in a virtual flow field and tries to maintain the hand's position at a cued location, a flow pressure-like sensation is perceived. Experimental results show that different force field strength levels can be discriminated.
Finally, Sharlin et al. (2009) present a novel system and a set of measures for assessing cognitive mapping abilities in the context of a wayfinding task. The hardware setup consists of a projection display for the presentation of virtual environments and a tangible tabletop interface for building a physical model of a seen environment. The cognitive mapping abilities of the users are assessed by recording and analyzing the building progress of the physical model. Since this setup has proven to be sensitive to factors affecting cognitive mapping it allows the computer-supported assessment of this important human ability.
All of these papers contain high-quality contributions to the growing field of 3D user interfaces. We thank the authors for their stimulating work and the reviewers for their constructive and detailed comments.},
keywords = {3D user interfaces, virtual reality},
}
@comment{c, c={leave the "_stuerzlinger" in the ID to enable umlaut-free search!}}
@proceedings{coquillart_stuerzlinger20083duiproceedings,
title = {Symposium on {3D} User Interfaces 2008},
author = {Coquillart, Sabine and Stürzlinger, Wolfgang and Kiyokawa, Kiyoshi},
publisher = {IEEE},
series = {3DUI '08},
year = {2008},
month = {Mar},
doi = {https://doi.org/10.1109/3DUI.2008.4476581},
teaser = {teasers/3DUI2008.png},
abstract = {Welcome to the IEEE Symposium on 3D User Interfaces 2008 (3DUI 2008), organized in Reno, Nevada on March 8-9, 2008. The symposium is co-located with IEEE Virtual Reality 2008 and with the symposium on Haptic Interfaces. 3DUI 2008 is the third international symposium focused on the topic of 3D UIs. It builds on successful 3DUI workshops in 2004 and 2005, as well as the IEEE 3DUI Symposiums in 2006 and 2007. Although a recent area of research, 3DUI is already a very well established topic and rapidely expanding. The submissions covered a variety of approaches ranging from handheld devices, desktop solutions, gesture, sound, haptics, augmented/mixed reality, to immersive systems.
This year, the program co-chairs received 67 submissions (45 papers and 22 technotes) in all areas of three-dimensional user interfaces. Each paper or technote was reviewed by at least two reviewers from the international program committee and two external reviewers. The review summary written by the primary reviewer provided the basis for a discussion among the reviewers when necessary. Reviewing was double-blind, i.e. the identity of the authors was known only to the program chairs and the program committee members responsible for choosing external reviewers for the submission. The acceptance rate was very selective at 28 % (31 % for papers and 23 % for technotes), and only 19 submissions were accepted (14 papers and 5 technotes). In addition, this year the proceedings also include 2 pages presentations for each of the 18 posters presented during the symposium.
We wish to thank all the persons who made 3DUI 2008 possible. Special thanks go to the program committee members and the reviewers for their insightful and thorough reviews of the submitted papers in a very short review period. We want to thank the posters chairs Raimund Dachselt, Robert Lindeman and Kouichi Matsuda who did handled the hard job of managing the posters. We also acknowledge the support by IEEE, the IEEE Visualization and Graphics Technical Committee as well as the VR steering committee. Most of the organization of IEEE 3DUI as well as local arrangement is shared with IEEE VR. We are grateful to Bill Sherman and the IEEE VR organizing committee for taking care of the organization of IEEE 3DUI 2008. Many thanks to James Stewart of Precision Conference Systems for his support of the reviewing process. Thanks also to Torsten Möllen and especially Meghan Haley for managing the printing process. Finally, we thank all the authors for their excellent submissions, without which this symposium could not exist.
We hope that this symposium will continue to connect researchers of all backgrounds in 3D user interface research and be enjoyable, interesting and stimulating for the participants. Please enjoy the 2008 3DUI Symposium !},
keywords = {3D user interfaces, virtual reality},
}
@proceedings{stuerzlinger20073duiproceedings,
title = {Symposium on {3D} User Interfaces 2007},
author = {Stürzlinger, Wolfgang and Kitamura, Yoshifumi and Coquillart, Sabine},
publisher = {IEEE},
series = {3DUI '07},
year = {2007},
month = {Mar},
doi = {https://doi.org/10.1109/3DUI.2007.340764},
teaser = {teasers/3DUI2007.png},
abstract = {Welcome to the IEEE Symposium on 3D User Interfaces 2007 (3DUI 2007), which took place in Charlotte, North Carolina on March 10-11, 2007. The symposium was held just before IEEE Virtual Reality 2007. The event owes its existence to a vibrant and productive research community in 3D user interfaces. This area has emerged from many different disciplines, including virtual reality, mixed and augmented reality, human-computer interaction, computer graphics, cognitive and perceptual psychology, and 3D games. 3DUI 2007 is sponsored by the IEEE Visualization and Graphics Technical Committee and is the second symposium in this series and follows two successful IEEE VR workshops on this topic in 2004 and 2005 as well as 3DUI 2006.
The program co-chairs received 81 submissions in all areas of three-dimensional user interfaces. The review process was highly competitive and selective. This year, we changed the review process and involved an international program committee consisting of 18 experts in 3D user interfaces. Each submission received at least 4 reviews, two of which were from members of the international program committee and two from external reviewers. Reviewing was double-blind this year, and the identity of the authors was known only to the program chairs and the program committee member responsible for choosing external reviewers for the submission. The program committee members were often able to solicit reviews from some of the top experts in a particular area of research. In the end, we were able to accept 18 full papers and 7 technotes (short papers), which corresponds to an acceptance rate of 31%. The accepted papers cover a wide range of topics in 3D user interfaces, including navigation, 3D movement, 3D selection, devices, gestures, mixed & augmented reality, force-feedback interfaces, and entertainment. We would like to thank all people who made 3DUI 2007 possible. Special thanks go to the program committee members who donated their time to ensure a fair selection process. Additional thanks go to the external reviewers who participated in the review process. We also acknowledge the support by IEEE, the IEEE Visualization and Graphics Technical Committee as well as the VR steering committee for support. Finally, we would like to thank Raimund Dachselt for handling the posters. Particular thanks go to IEEE VR's general chairs, especially Doug Bowman, for their great help with the organization of this event as well as the IEEE VR local arrangement chairs and other people involved in the local organization. Many thanks to James Stewart of Precision Conference Systems for his support of the reviewing process. Thanks also to Torsten Möller and especially Meghan Haley for creating the proceedings. Finally, we thank all the authors and researchers who submitted their work to the symposium.
We believe that 3DUI 2007 connects researchers of all backgrounds in 3D user interface research and collects and disseminates the best results in this area. Enjoy the symposium!},
keywords = {3D user interfaces, virtual reality},
}
@comment{c, c={leave the "_stuerzlinger" in the ID to enable umlaut-free search!}}
@proceedings{kitamura_stuerzlinger20063duiproceedings,
title = {Symposium on {3D} User Interfaces 2006},
author = {Kitamura, Yoshifumi and Bowman, Doug and Fröhlich, Bernd and Stürzlinger, Wolfgang},
publisher = {IEEE},
series = {3DUI '06},
year = {2006},
month = {Mar},
url = {https://ieeexplore.ieee.org/servlet/opac?punumber=10952},
teaser = {teasers/3DUI2006.png},
abstract = {We are extremely pleased and honored to present the proceedings of the First IEEE Symposium on 3D User Interfaces.
3DUI 2006 owes its existence to a vibrant and productive research community. Emerging from many different disciplines, such as virtual reality, mixed reality, computer graphics, human-computer interaction, and cognitive and perceptual psychology, 3D interaction has now become a coherent research area itself. Extremely successful workshops on this topic at IEEE Virtual Reality in 2004 and 2005 convinced us and the IEEE Visualization and Graphics Technical Committee that the time was right to give the 3D user interface community its own specialized venue. Our vision for the symposium is to connect researchers of all backgrounds working on 3D user interface issues, and to collect and disseminate the best 3D interaction research in the world.
Although this is the very first 3DUI symposium, the review of papers was highly competitive and selective. The program includes 18 full papers and 8 technotes (short papers), selected from 81 submissions (a 32% acceptance rate overall). The accepted papers cover a wide range of topics in 3D user interface, including navigation, applications and implementation, collaborative and bimanual interfaces, 3D interaction techniques, augmented reality and devices.
Dr. Ravin Balakrishnan of the University of Toronto will provide the keynote address for the Symposium. Dr. Balakrishnan is well-known for his research on effective and powerful 3D interaction techniques for emerging technologies such as volumetric displays and wall-sized displays. He is also a leader in the international human-computer interaction community. Dr. Balakrishnan's presentation will challenge researchers in 3D user interfaces to think more deeply about the application of their work to real-word problems.
We would like to thank all of the people who made this first-ever 3DUI Symposium possible. First, a big thank you to all of the dedicated reviewers who participated in the peer review process - your service helped to ensure the high quality of this technical program. Thanks are due to Simon Julier and Jim Chen, general chairs of IEEE VR 2006, who helped us make the transition from workshop to symposium smoothly and easily. We also thank the IEEE, the VGTC, and the VR steering committee for their support, as well as James Steward of Precision Conference Systems. Finally we thank all of the authors and researchers who submitted their work to the Symposium.
We trust that 3DUI 2006 will be the first in a long line of successful and influential events. Enjoy the Symposium!},
keywords = {3D user interfaces, virtual reality},
}
@comment{c, c={leave the "_stuerzlinger" in the ID to enable umlaut-free search!}}
@proceedings{bowman_stuerzlinger2005newdirections,
title = {New Directions in {3D} User Interfaces},
author = {Bowman, Doug and Fröhlich, Bernd and Kitamura, Yoshifumi and Stürzlinger, Wolfgang},
publisher = {Shaker Verlag},
year = {2005},
month = {Mar},
url = {https://www.shaker.de/de/content/catalogue/index.asp?lang=en&ID=8&ISBN=978-3-8322-3830-8},
pdf = {papers/3dui_workshop.pdf},
teaser = {teasers/3dui_workshop.png},
abstract = {This workshop focuses on novel research in three-dimensional user interfaces (3D UIs). The workshop builds on and expands the scope of last year's workshop "Beyond Wand and Glove Based Interaction." The theme of the workshop will again be on moving beyond the "common" and "traditional" (if one can use those words with respect to such a young research area) approaches to 3D UIs.
Just as wands, 3D mice, and gloves became traditional input devices for 3D UIs, a handful of well-known interaction techniques and UI metaphors also became de facto standards (often because they were the default interaction techniques in widely-used software toolkits). Most of these basic techniques, however, have been around for 5-10 years. Although this could certainly change, it seems that the discovery of radical new metaphors for the "universal 3D tasks" (navigation, selection, manipulation, system control) has slowed down significantly. This does not mean, however, that we should stop doing research on interaction techniques for these tasks. Rather, it means we have to improve the existing metaphors in subtle ways, experiment with the use of new devices, and consider the use of such techniques in specific domains or by specific types of users. Recent research has shown that there is still much to be learned in this area, and that current techniques can be enhanced to dramatically improve usability .
In this workshop, we will spotlight research that investigates novel and enhanced methods of 3D interaction for immersive virtual environments (VEs), augmented and mixed reality (AR/MR), and desktop 3D systems. Relevant topics include: 3D input devices, 3D display devices, 3D interaction techniques, 3D user interface metaphors, collaborative 3D interaction, evaluation methods for 3D UIs, application of existing devices/techniques in novel contexts (e.g. to AR, UbiComp, etc., migration of existing techniques to new display platforms.},
keywords = {3D user interfaces, virtual reality},
}
@book{stuerzlinger2003practical,
title = {Practical Programming in the Unix Environment},
author = {Stürzlinger, Wolfgang},
publisher = {Pearson Custom},
year = {2003},
month = {Jan},
teaser = {teasers/practicalprogramming.png},
abstract = {Today, software bugs are clearly a constant source of frustration with computers and also pose considerable security and safety concerns. While methods exist to prove the correctness of programs, they are not fully automatic and all requires significant training. Consequently, there is no real alternative to careful and systematic testing of programs to ensure that the software fulfills its designated function (even though testing cannot guarantee the absence of bugs). A further indication of the importance of this topic is that all accepted software development practices, such as Extreme Programming, require that programmers test their systems. While testing is taught abstractly in many courses, few students realized how important thorough testing is in practice. Only in the field do they gain this experience and learn the related skills. Hand in hand with testing goes debugging, the art of finding a problem based on observable symptoms and then fixing the problem. Last, but not least, optimization of programs is a skill that is often necessary for competitive systems.
When faced with the task of helping to re-design a second-year course on practical programming, I decided that C and UNIX were the right platform to teach many of the skills necessary for practical program development. Today, many students learn Java (or similar languages) in their first year, as this provides a relatively good and safe environment for learning the fundamental concepts. However, computer science students need to know how the layers underneath a high-level programming language work. C, besides being a high-performance environment and a prerequisite to C++, exposes students to these underlying layers and hence allows them to get a better understanding of how software works. Furthermore, a lot of safety layers (e.g., automatic handling of arithmetic overflows) are not present here, which makes this an ideal vehicle to teach the importance of testing. UNIX, with its cleverly designed file system, interactive shell and scripting languages, provides an excellent environment for systematic and repeated testing. The current implementation of the course teaches the importance of testing via strict enforcement of adherence to specifications in assignments. This is done with automatic, and hence objective, testing of assignments. As the test cases are revealed only after the deadline, this forces students to think very carefully about the robustness of their programs.
This textbook is designed to be used together with "The C Programming Language" by Kernighan & Ritchie. One of the most frustrating aspects of designing a course on practical programing is that there are very few textbooks that cover important skills, such as testing, debugging, optimization, the use of scripting languages, etc. with adequate examples. Fortunately, I found that parts of a book on the UNIX environment ("The UNIX Programming Environment" by Kernighan & Pike) and parts of a book on the practice of programming ("The Practice of Programming" by Kernighan & Pike) provide a good combination. Together, the new book covers most important issues for practical program development and hence forms a good basis for a course that focuses on such issues.
It is my hope that this book will help instructors to communicate practical programming skills as well as help students to develop better software.},
keywords = {programming},
}
@comment{c, c={leave the "_stuerzlinger" in the ID to enable umlaut-free search!}}
@article{heidrich_stuerzlinger2002special,
title = {Special Issue on Hardware-Accelerated Rendering Techniques},
author = {Heidrich, Wolfgang and Stürzlinger, Wolfgang},
journal = {Journal of Graphics Tools},
series = {JGT},
year = {2002},
month = {Dec},
volume = {7},
number = {4},
pages = {1-1},
doi = {https://doi.org/10.1080/10867651.2002.10487565},
teaser = {teasers/jgt4-2002.png},
abstract = {Real-time rendering systems are approaching a level of quality and economy that surpasses even the most elaborate offline rendering system available only ten years ago. As a consequence, hardware-accelerated rendering has had a strong impact on applications such as computer games, modeling and animation, design, and scientific visualization.
The aim of this special issue of the journal of graphics tools is to provide an overview of the state-of-the-art application of graphics hardware to problems in rendering, modeling, visualization, and other areas. One of the challenges in this area is to transform traditional algorithms into a form that adapts to the restrictions dictated by graphics hardware and takes advantage of its specific processing capabilities. These constraints often mandate significant changes or simplifications to the original algorithms, and sometimes lead to the development of new methods. Often it is possible to take a solution developed for solving a particular problem with the help of graphics hardware and to apply the ideas behind it to a completely different problem. This transfer of ideas is one of the motivations behind this special issue, which brings together work from a variety of application domains.
We received 33 submissions for this special issue, illustrating the recent interest in hardware-assisted techniques. From this, we selected 11 papers to be presented here. These represent a cross section of the different application areas for hardware-accelerated rendering. From realistic illumination algorithms to shadowing, from image-based rendering to non-photorealistic rendering, from digital imaging to digital halftoning, and from geometric modeling to collision detection, the papers in this special issue demonstrate the state-of-the art in hardware-assisted techniques. We hope you will enjoy these contributions as much as we did.},
keywords = {rendering, real-time},
}
@proceedings{stuerzlinger2002giproceedings,
title = {Graphics Interface 2002},
author = {Stürzlinger, Wolfgang and {McCool}, Mike},
publisher = {CHCCS and AK Peters},
series = {GI '02},
year = {2002},
month = {May},
url = {https://graphicsinterface.org/proceedings/gi2002},
teaser = {teasers/GI2002.png},
abstract = {Welcome to Graphics Interface (GI) 2002, a conference that combines coverage of original research results in both Human-Computer Interaction and Graphics. The conference took place in Calgary, Alberta, over 27-29 May 2002, and was held in conjunction with the Artificial Intelligence 2002 and Vision Interface 2002 conferences. GI 2002 is the 28th instance of the longest running conference series in human-computer interaction and computer graphics. This event has previously been held two times in Calgary: in 1977 and in 1991.
The program co-chairs received 96 submissions in all areas of human-computer interaction and computer graphics. The large number of submissions was a pleasant surprise; however, the number of submissions also necessitated an enlargement of the program committee on short notice. We are very grateful to all the additional program committee members who agreed to take time out of their busy schedules late in 2001. By agreeing to serve, these additional members reduced the workload on other committee members and permitted us to maintain our high reviewing standards.
The overall quality of the submissions was very high, which made the selection process difficult. After considerable deliberation, the program committee selected 25 papers for publication. The international program committee consisted of 20 people from around the world. Each paper received at least 4 reviews, two of which were from members of the program committee. The reviewing process was double-blind, and the identity of the authors was known only to program co-chairs and the program committee member responsible for choosing external reviewers for each submission. The program committee members were often able to solicit reviews from some of the topmost experts in a particular area of research. We greatly appreciate the effort of the members of the program committee. We would like to extend additional thanks to the 13 members of the program committee who attended the meeting at York University, Toronto, Canada on 16 February 2002 and funded their own travel.
Graphics Interface customarily has several invited speakers. This year three invited speakers were: Saul Greenberg, Professor at the University of Calgary; John Buchanan, Electronic Arts Canada and Adjunct Professor at the University of Alberta; and David Kirk, Chief Scientist at NVIDIA. We extend our gratitude to them for sharing their inspiration in their respective fields.
We would like to thanks James Stewart for his work on the PCS electronic submission and reviewing system. His help behind the scenes made our job a lot easier! We would also like to thank Pierre Poulin and Kelly Booth for handling the liaison with AI and VI conference organizers, and Kelly Booth again for additional valuable advice. We thank further all referees for their voluntary work, Ravin Balakrishnan for handling the posters, Sara Diamond for organizing the video show, and Fred Peet, treasurer of the Canadian Human-Computer Communication Society, for keeping the finances straight, and Graphics Services at the University of Waterloo for doing such an excellent job on the proceedings. Last but not least, we send a very big thanks to Camille Sinanan, Sheelagh Carpendale, Mario Costa-Sousa, and Joerg Denzinger for the local organization of the joint conferences at the University of Calgary. Without their work, this conference would simply not have been possible.
For further information about the conference series we invite you to visit our web site: http://www.graphicsinterface.org/},
keywords = {human-computer interaction, HCI, computer graphics},
}
@proceedings{stuerzlinger2002egveproceedings,
title = {Eurographics Workshop on Virtual Environments 2002},
author = {Stürzlinger, Wolfgang and Müller, Stefan},
publisher = {ACM SIGGRAPH},
series = {EGVE '02},
year = {2002},
month = {May},
url = {https://dl.acm.org/doi/proceedings/10.5555/509709},
teaser = {teasers/EGVE2002.png},
abstract = {This book contains the proceedings of the Eighth EUROGRAPHICS Workshop on Virtual Environments. The event was held in Barcelona from May 30 to May 31, 2002. The workshop brought together scientists, developers, and users from all over the world to present and discuss the latest scientific advances in the field of Virtual Environments. 60 papers were submitted for reviewing and 22 were selected to be presented at the workshop. Most of the top research institutions working in the area submitted papers and presented their latest results. The presentations were complemented by two keynote talks from Marc Mine (Walt Disney Imagineering - VR Studio) and Eric Badiqué (European Commission - IST program). The research presented at this workshop can be classified into the following aspects of Virtual Environments (VEs): Input and Output Devices, Interaction and Navigation, Evaluation, Collaboration, Systems, and Applications. Devices focus mainly on hardware issues to interface with a simulation, whereas Interaction and Navigation techniques investigate how the raw input is best interpreted so that the user can easily achieve his/her goals. Evaluations provide data about the usability of Virtual Environments, and the importance of objective and reproducible studies can only be stressed. Virtual Environments are often used to communicate and to co-operate and this focus is evident in the research on Collaboration. The area of Systems discusses the various tradeoffs in building complete solutions and last, but not least, applications report on the transfer of research results into the real world. However, the reader should note that many contributions cross these boundaries, which reflects the multidisciplinary nature of Virtual Environments.},
keywords = {virtual reality},
}
@proceedings{stuerzlinger2000giposterproceedings,
title = {Poster Proceedings Graphics Interface 2000},
author = {Stürzlinger, Wolfgang},
series = {GI '00},
year = {2000},
month = {May},
teaser = {teasers/GIposter2000.png},
abstract = {After the success of last year, I am happy to report that Graphics Interface was again able to attract a large number of posters. This year a significant part of the submissions is from all over the world, which underlines the international aspect of the conference. Furthermore, the topics nicely cover the range of research areas that are the focus of the conference: Graphics and Human-Computer Interaction.
Posters are an excellent medium for communicating new and emerging ideas. For many first-time authors it also enables them to meet future colleagues. I encourage all conference participants to go to the poster session and meet the authors in person. Please chat with the students and provide them with feedback!},
keywords = {human-computer interaction, HCI, computer graphics},
}
@comment{************************journal_articles************************}
@comment{c, c={not sure if this is best article or proceedings}}
@comment{barrera2027dagstuhl,
title = {Sketching Beyond 2D in Extended Reality (Dagstuhl Seminar 27022)},
author = {Barrera Machuca, Mayra Donaji and Jackson, Bret and Keefe, Daniel and Habakuk, Johann and Stuerzlinger, Wolfgang},
journal = {Dagstuhl Reports},
publisher = {Schloss Dagstuhl-Leibniz-Zentrum fuer Informatik},
commented-series = {Dagstuhl Seminar 27022},
commented-issn = {2192-5283},
year = {2027},
month = {Jun},
commented-volume = {0},
commented-number = {0},
commented-pages = {1-9},
commented-doi = {https://doi.org/10.4230/DagRep.0.0.1},
commented-pdf = {papers/dagstuhl_IA.pdf},
commented-teaser = {teasers/dagstuhl.png},
commented-abstract = {Advances in virtual, mixed, and augmented reality (VR, MR, AR) have enabled a new form of computer-mediated art expression called 3D sketching, also referred to as "3D painting", "3D drawing", or a variant of "immersive sketching", which allows artists, engineers, designers, and scientists to create 3D works in a body-centric space. One of the unique aspects of 3D sketching is that it requires a computer-based tracking system to record the artist's spatial movements, which create the digital marks, and computer graphics techniques to render these marks in space. Moreover, the resulting sketch is often displayed in this same 3D space, e.g., via the use of immersive computer displays.
This dependency on computer systems to create and display the creations makes 3D sketching a unique medium that requires the union of artists and computer scientists to develop tools that artists can then use to interact with the 3D "canvas". Thus, over the last 30 years, the computing research and digital arts communities have collaborated to study and exhibit 3D sketching techniques, applications, and artifacts.
This Dagstuhl Seminar invites participants to broaden these collaborations by combining computer scientists, cognitive scientists, artists, engineers, and practitioners from both academia and industry.
The seminar will provide the unique opportunity to foster intellectual exchange on three general themes: (1) Technology: the design and implementation of novel user interfaces and hardware that address the needs of artists and other practitioners, (2) Theory: understanding the role of spatial perception and cognition in the act of sketching, and (3) Creative Practice and Education: identifying novel ways to train the next generation of 3D sketching artists. The seminar’s goals include:
- Coalescing an international community of creative practitioners, educators, and researchers working with 3D drawing, including establishing a new online presence at http://3ddrawing.org/
- Mapping and disseminating a future research agenda for 3D sketching, including a position paper and tutorials at top conferences like IEEE VR and ACM CHI.
- Making work with 3D drawing more visible to the public by contributing, exhibiting, and supporting emerging venues for exhibiting 3D drawings in places like ARSElectronica, SIGGRAPH Art Show or the IEEE XR Gallery.
- Describing training and education methods for 3D sketching, including identifying best practices that artists and schools can apply.
By fulfilling these goals, this seminar aims to guide our ability to teach and use 3D sketching tools.},
commented-keywords = {},
}
@article{li2026selectrunning,
title = {Investigating 3D Selection Performance While Running in Extended Reality: an In-depth Study of the Effect of Speed},
author = {Li*, Ang and Knibbe, Jarrod and Tatsuzawa*, Kiichiro and Demartini, Gianluca and Viller, Stephen and Wallis, Guy and Stuerzlinger, Wolfgang and Cordeil, Maxime},
journal = {Transactions on Visualization and Computer Graphics},
publisher = {IEEE},
series = {TVCG},
year = {2026},
month = {Sep},
commented-volume = {32},
commented-number = {0},
numpages = {13},
commented-doi = {https://doi.org/10.1109/ISMAR0000.2026.00000},
commented-pdf = {papers/selectrunning.pdf},
commented-video = {videos/selectrunning.mp4},
commented-teaser = {teasers/selectrunning.png},
abstract = {We explore how running speed affects target selection in immersive environments. Through a Fitts' tapping task, we investigate direct touch selections while participants are standing or running (at speeds up to 9 km/h). We conduct a multifaceted controlled study (n=22) to understand the effect of speed, pointing phase, and foot-strike on selection performance. We find that speed dramatically increases movement time, error rate, perceived exertion, and task load. The increased movement time is driven by the correction phase, which doubles in duration at 9 km/h, while the ballistic phase remains stable. Our exploratory analysis further reveals that a higher cadence reduces the error rate at lower speeds (4.5 km/h), while this effect disappears at higher speeds (9 km/h), as participants' motor control in target selection is significantly disrupted by the movement oscillations. As the selection error rate quickly exceeds 30% when speed increases, even with accurate, fast external tracking, we argue that direct touch interaction is likely inappropriate for running. Further efforts are needed to facilitate selection interaction at higher running speeds.},
keywords = {3D pointing, running, jogging},
note = {To appear},
}
@article{rasoulifar2026dynamicvac,
title = {Dynamic Vergence–Accommodation Conflict: Effects on 3D Selection Performance When Target Depth Changes},
author = {Rasoulifar+, Zahra and Turkmen*, Rumeysa and Barrera Machuca, Mayra D. and Stuerzlinger, Wolfgang and Batmaz, Anil Ufuk},
journal = {Transactions on Visualization and Computer Graphics},
publisher = {IEEE},
series = {TVCG},
year = {2026},
month = {Oct},
commented-volume = {32},
commented-number = {11},
numpages = {11},
commented-doi = {https://doi.org/10.1109/ISMAR0000.2026.00000},
commented-pdf = {papers/dynamicvac.pdf},
commented-video = {videos/dynamicvac.mp4},
commented-teaser = {teasers/dynamicvac.png},
abstract = {The effect of the Vergence--Accommodation Conflict (VAC) in state-of-the-art head-mounted displays on 3D interaction performance is well-studied in scenarios where targets remain stationary at a fixed depth. Yet, many VR applications include targets moving continuously toward or away from the user, causing vergence demand to change over time while accommodation remains fixed at the display focal plane. We study this scenario using an ISO 9241-411 multidirectional target selection task with: \emph{No VAC} (targets at the display focal plane), \emph{Constant VAC} (targets further from the focal plane), \emph{Varying VAC} (targets appear at both No VAC and Constant VAC depths across selections), and \emph{Dynamic VAC} (target depth changes continuously during acquisition) conditions. In a within-subjects study with 24 participants, Dynamic VAC produced slower selections, higher error rates, lower accuracy, and reduced throughput compared with the No VAC condition. To account for target movements in depth, we propose an extension of Fitts’ law that models the additional performance costs introduced by continuously changing vergence demand. Our results provide guidance for modeling and designing interaction techniques in depth-varying 3D environments.},
keywords = {3D pointing},
note = {ISMAR '26, conditionally accepted, to appear},
}
@article{jeong2026throwmodel,
title = {Modeling Throwing Selection in Virtual Reality},
author = {Jeong*, Jae-Yeop and Stuerzlinger, Wolfgang and Jeong, Jin-Woo},
journal = {Transactions on Visualization and Computer Graphics},
publisher = {IEEE},
series = {TVCG},
year = {2026},
month = {Oct},
commented-volume = {32},
commented-number = {11},
numpages = {11},
commented-doi = {https://doi.org/10.1109/ISMAR0000.2026.00000},
commented-pdf = {papers/throwmodel.pdf},
commented-video = {videos/throwmodel.mp4},
commented-teaser = {teasers/throwmodel.png},
abstract = {Throwing is a natural and embodied interaction for selecting distant targets in virtual reality (VR). Unlike conventional pointing, throwing is ballistic: once released, the trajectory can no longer be corrected. Despite its practical importance, throwing-based target selection has received relatively little attention in human behavior and performance modeling, making systematic design and evaluation still difficult. In this paper, we investigate throwing-based target selection in VR and propose predictive models for its behavior and performance. Through a controlled user study manipulating target width ($W$) and movement amplitude ($A$), we measured planning time ($PT$) and endpoint distribution. Our results showed that $PT$ increased systematically with task difficulty, following a pattern similar to movement time in Fitts' law. Throwing endpoints were also generally well approximated by a bivariate Gaussian distribution, and target parameters significantly affected both endpoint bias and variability. Based on these findings, we derived a probabilistic accuracy model that predicts target acquisition performance. The proposed models showed high goodness-of-fit, and the accuracy model was robust under leave-one-condition-out cross-validation. Our findings provide a quantitative understanding of throwing-based target selection and support the design of throwing interactions in immersive environments.},
keywords = {selection, throwing},
note = {ISMAR '26, conditionally accepted, to appear},
}
@article{bashar2026vacgazeconflict,
title = {Evaluating the Vergence–Accommodation Conflict in Gaze-Based 3D Target Selection},
author = {Bashar*, Mohammad Raihanul and Amini*, Mohammadreza and Mutasim, Aunnoy K. and Barrera Machuca, Mayra D. and Stuerzlinger, Wolfgang and Batmaz, Anil Ufuk},
journal = {Transactions on Visualization and Computer Graphics},
publisher = {IEEE},
series = {TVCG},
year = {2026},
month = {Oct},
commented-volume = {32},
commented-number = {11},
numpages = {11},
commented-doi = {https://doi.org/10.1109/ISMAR0000.2026.00000},
commented-pdf = {papers/vacgazeconflict.pdf},
commented-video = {videos/vacganzeconflict.mp4},
commented-teaser = {teasers/vacgazeconflict.png},
abstract = {State-of-the-art head-mounted displays (HMDs) enable gaze-based selection in virtual environments. Yet, these HMDs suffer from the vergence–accommodation conflict (VAC), which is known to affect interaction performance. The VAC might influence gaze-based selection performance because it directly affects eye-movement behavior. Thus, in this paper, we investigate how the VAC influences \gaze-based 3D target selection across varying depth conditions. Our results show that as the (visual) depth increases, user performance significantly decreases with gaze-based selection. Moreover, a previously suggested ``\textit{Variation in Diopter}'' Fitts’ law model captured this performance change better relative to a linear model. These findings provide evidence that gaze-based pointing is negatively affected by the VAC and highlight the importance of accounting for depth-dependent factors when designing gaze-based interaction in 3D environments.},
keywords = {3D pointing, eye gaze},
note = {ISMAR '26, conditionally accepted, to appear},
}
@article{hu2025trackingaccuracysteering,
title = {Exploring and Modeling the Effects of Eye-Tracking Accuracy and Precision on Gaze-Based Steering in Virtual Environments},
author = {Hu*, Xuning and Zhang*, Yichuan and Wei*, Yushi and Zhang*, Liangyuting and Li, Yue and Stuerzlinger, Wolfgang and Liang, Hai-Ning},
journal = {Transactions on Visualization and Computer Graphics},
publisher = {IEEE},
series = {TVCG},
year = {2025},
month = {Oct},
volume = {31},
number = {11},
pages = {9559-9569},
doi = {https://doi.org/10.1109/TVCG.2025.3616824},
pdf = {papers/trackingaccuracysteering.pdf},
teaser = {teasers/trackingaccuracysteering.png},
abstract = {Recent advances in eye-tracking technology have positioned gaze as an efficient and intuitive input method for Virtual Reality (VR), offering a natural and immersive user experience. As a result, gaze input is now leveraged for fundamental interaction tasks such as selection, manipulation, crossing, and steering. Although several studies have modeled user steering performance across various path characteristics and input methods, our understanding of gaze-based steering in VR remains limited. This gap persists because the unique qualities of eye movements—involving rapid, continuous motions—and the variability in eye-tracking make findings from other input modalities nontransferable to a gaze-based context, underscoring the need for a dedicated investigation into gaze-based steering behaviors and performance. To bridge this gap, we present two user studies to explore and model gaze-based steering. In the first one, user behavior data are collected across various path characteristics and eye-tracking conditions. Based on this data, we propose four refined models that extend the classic Steering Law to predict users’ movement time in gaze-based steering tasks, explicitly incorporating the impact of tracking quality. The best-performing model achieves an adjusted R^2 of 0.956, corresponding to a 16% improvement in movement time prediction. This model also yields a substantial reduction in AIC (from 1550 to 1132) and BIC (from 1555 to 1142), highlighting improved model quality and better balance between goodness of fit and model complexity. Finally, data from a second study with varied settings, such as a different eye-tracking sampling rate, illustrate the strong robustness and predictability of our models. Finally, we present scenarios and applications that demonstrate how our models can be used to design enhanced gaze-based interactions in VR systems.},
keywords = {eye tracking, gaze steering},
award = {This work received an Honorable Mention Award},
note = {ISMAR '25},
}
@article{mostajeran2025biophilicsteering,
title = {The Effects of Biophilic Design on Steering Performance in Virtual Reality},
author = {Mostajeran, Fariba and Friedrich*, Moritz and Steinicke, Frank and Kühn, Simone and Stuerzlinger, Wolfgang},
journal = {Scientific Reports},
publisher = {Nature Portfolio},
series = {SciRep},
year = {2025},
month = {Sep},
volume = {15},
commented-number = {1},
articleno = {32485},
numpages = {12},
doi = {https://doi.org/10.1038/s41598-025-19113-4},
pdf = {papers/biophilicsteering.pdf},
teaser = {teasers/biophilicsteering.png},
abstract = {Biophilic design aims to connect people to nature by incorporating natural elements such as plants in built environments. In immersive virtual reality (VR) environments, experiments have shown that, for instance, the presence of virtual plants in VR leads to higher cognitive performance and psychological well-being. However, it has not been investigated so far whether such effects extend to the performance of spatial interaction tasks such as path steering. In this paper, we explore the effects of the presence of virtual plants in an immersive virtual office environment on path steering performance in VR. For this purpose, we combined and replicated two previous studies in this field. The results of our study did not find an effect of the presence of virtual plants on steering time, as our participants performed all steering tasks in a similar amount of time in both biophilic and non-biophilic environments. We could, however, replicate one of the original studies on path steering in VR by Liu et al. and show that the steering time in our study also follows the extension of the steering law proposed in their work. Accordingly, we found not only a significant effect of the length (p < .001, effect size: partial eta squared=.93) and width (p < .001, effect size=.96) of the steering path, but also a significant effect of the path curvature (p=.003, effect size=.64) on the time needed for steering through the path. We also found significant effects of path latitude (p < .001, effect size=.57) and longitude (p=.01, effect size=.18) on steering time. Our findings challenge the previous research, which demonstrated the positive effects of biophilic design in VR on cognitive processes, and therefore, pave the path for future work to better understand the effects of biophilic design on users’ performance in VR.},
keywords = {biophilic design, cognition, well-being},
}
@article{bashar2025depthvac,
title = {The Effect of Visual Depth on the Vergence-Accommodation Conflict on 3D Selection Performance within Virtual Reality Headsets},
author = {Bashar*, Mohammad Raihanul and Barrera Machuca, Mayra Donaji and Stuerzlinger, Wolfgang and Batmaz, Anil Ufuk},
journal = {Visual Computer},
publisher = {Springer},
commented-series = {VisComp},
year = {2025},
month = {May},
volume = {41},
commented-number = {},
pages = {9645-9661},
doi = {https://doi.org/10.1007/s00371-025-03990-x},
pdf = {papers/depthvac.pdf},
teaser = {teasers/depthvac.png},
abstract = {Prior studies have shown that the vergence-accommodation conflict (VAC) negatively affects the interaction performance in Virtual Reality (VR) and Augmented Reality (AR) systems, particularly as object depth increases. This paper examines user selection performance across six different visual depths. Through a study closely resembling prior research, eighteen participants participated in an ISO 9241:411 task with six different depth distances. We observed that with higher depth values, selection times increased while the throughput performance of the participants decreased. Based on this finding, we propose a Fitts' law model based on the focal distances, which models pointing times in VR and AR systems with substantially higher accuracy. We hope that our findings aid developers in creating 3D user interfaces for VR and AR that offer better performance and an improved user experience.},
keywords = {3D pointing, vergence-accomodation conflict},
}
@article{menin2025thematicmobility,
title = {What about thematic information? An analysis of the multidimensional visualization of individual mobility},
author = {Menin*, Aline and Quere*, Clément and Wagner*, Jorge and Chardonnel, Sonia and Davoine, Paule-Annick and Stuerzlinger, Wolfgang and Freitas, Carla Maria Dal Sasso and Nedel, Luciana and Winckler, Marco},
journal = {Visual Informatics},
publisher = {Elsevier},
commented-series = {VisInf},
year = {2025},
month = {Mar},
volume = {9},
number = {1},
pages = {99-115},
doi = {https://doi.org/10.1016/j.visinf.2025.02.002},
pdf = {papers/thematicmobility.pdf},
teaser = {teasers/thematicmobility.png},
abstract = {This paper reviews the literature on the visualization of individual mobility data, with a focus on thematic integration. It emphasizes the importance of visualization in understanding mobility patterns within a population and how it helps mobility experts to address domain-specific questions. We analyze 38 papers published between 2010 and 2024 in GIS and VIS venues that describe visualizations of multidimensional data related to individual movements in urban environments, concentrating on individual mobility rather than traffic data. Our primary aim is to report advances in interactive visualization for individual mobility analysis, particularly regarding the representation of thematic information about people’s motivations for mobility. Our findings indicate that the thematic dimension is only partially represented in the literature, despite its critical significance in transportation. This gap often stems from the challenge of identifying data sources that inherently provide this information, necessitating visualization designers and developers to navigate multiple, heterogeneous data sources. We identify the strengths and limitations of existing visualizations and suggest potential research directions for the field.},
keywords = {visual analytics, visualization, thematic information, individual mobility},
}
@article{mutasim2025gazegem,
title = {The Influence of Eye Gaze Interaction Technique Expertise and the Guided Evaluation Method on Text Entry Performance Evaluations},
author = {Mutasim*, Aunnoy K and Batmaz, Anil Ufuk and Hudhud Mughrabi*, Moaaz and Stuerzlinger, Wolfgang},
journal = {Proceedings of the ACM Human-Computer Interaction},
publisher = {ACM},
series = {PACM-HCI},
year = {2025},
month = {May},
volume = {9},
number = {3},
articleno = {ETRA17},
numpages = {19},
doi = {https://doi.org/10.1145/3725842},
pdf = {papers/gazegem.pdf},
teaser = {teasers/gazegem.png},
video = {videos/gazegem.mp4},
abstract = {Any investigation of learning unfamiliar text entry systems is affected by the need to train participants on multiple new components simultaneously, such as novel interaction techniques and layouts. The Guided Evaluation Method (GEM) addresses this challenge by bypassing the need to learn layout-specific skills for text entry. However, a gap remains as the GEM’s performance has not been assessed in situations where users are unfamiliar with the interaction technique involved, here eye-gaze-based dwell. To address this, we trained participants on only the eye-gaze-based interaction technique over eight days with QWERTY and then evaluated their performance on the OPTI layout with the GEM. Results showed that the unfamiliar OPTI layout outperformed QWERTY, with QWERTY's speed aligning with previous findings, suggesting that interaction technique expertise significantly impacts performance outcomes. Importantly, we also identified that for scenarios where the familiarity with the involved interaction technique(s) is the same, the GEM analyzes the performance of keyboard layouts effectively and quickly identifies the best option.},
keywords = {text entry, layout learning, eye tracking, gaze},
note = {ETRA '25},
}
@article{lee2025scalingtechniques,
title = {Scaling Techniques for Exocentric Navigation Interfaces in Multiscale Virtual Environments},
author = {Lee, Jong-In and Stuerzlinger, Wolfgang},
journal = {Transactions on Visualization and Computer Graphics},
publisher = {IEEE},
series = {TVCG},
year = {2025},
month = {Mar},
volume = {31},
number = {5},
pages = {2704-2714},
doi = {https://doi.org/10.1109/TVCG.2025.3549535},
pdf = {papers/scalingtechniques.pdf},
teaser = {teasers/scalingtechniques.png},
video = {videos/scalingtechniques.mp4},
abstract = {Navigating multiscale virtual environments necessitates an interaction method to travel across different levels of scale (LoS). Prior research has studied various techniques that enable users to seamlessly adjust their scale to navigate between different LoS based on specific user contexts. We introduce a scroll-based scale control method optimized for exocentric navigation, targeted at scenarios where speed and accuracy in continuous scaling are crucial. We pinpoint the challenges of scale control in settings with multiple LoS and evaluate how distinct designs of scaling techniques influence navigation performance and usability. Through a user study, we investigated two pivotal elements of a scaling technique: the input method and the scaling center. Our findings indicate that our scroll-based input method significantly reduces task completion time and error rate and enhances efficiency compared to the most frequently used bi-manual method. Moreover, we found that the choice of scaling center affects the ease of use of the scaling method, especially when paired with specific input methods.},
keywords = {3D navigation, multiscale virtual environment, 3D locomotion},
note = {VR '25},
}
@article{mutasim2024gem,
title = {The Guided Evaluation Method: An Easier Way to Empirically Estimate Trained User Performance for Unfamiliar Keyboard Layouts},
author = {Mutasim*, Aunnoy K and Batmaz, Anil Ufuk and Hudhud Mughrabi+, Moaaz and Stuerzlinger, Wolfgang},
journal = {International Journal of Human-Computer Studies},
publisher = {Elsevier},
series = {IJHCS},
year = {2024},
month = {Oct},
volume = {190},
articleno = {103317},
numpages = {19},
doi = {https://doi.org/10.1016/j.ijhcs.2024.103317},
pdf = {papers/gem.pdf},
teaser = {teasers/gem.png},
abstract = {To determine in a user study whether proposed keyboard layouts, such as OPTI, can surpass QWERTY in performance, extended training through longitudinal studies is crucial. However, addressing the challenge of creating trained users presents a logistical bottleneck. A common alternative involves having participants type the same word or phrase repeatedly. We conducted two separate studies to investigate this alternative. The findings reveal that both approaches, repeatedly typing words or phrases, have limitations in accurately estimating trained user performance. Thus, we propose the Guided Evaluation Method (GEM), a novel approach to quickly estimate trained user performance with novices. Our results reveal that in a matter of minutes, participants exhibited performance similar to an existing longitudinal study — OPTI outperforms QWERTY. As it eliminates the need for resource-intensive longitudinal studies, our new GEM thus enables much faster estimation of trained user performance. This outcome will potentially reignite research on better text entry methods.},
keywords = {text entry, touch typing, soft keyboards, layout learning},
}
@article{hoerantner2024vismet,
title = {Visual training in dry age-related macular degeneration},
author = {Hörantner, Robert and Wolfsgruber, Jürgen and Stürzlinger, Gerald and Stürzlinger, Wolfgang and Hörantner, Paul},
journal = {Spektrum der Augenheilkunde},
publisher = {Springer},
year = {2024},
month = {Aug},
volume = {39},
number = {1},
pages = {4-8},
doi = {https://doi.org/10.1007/s00717-024-00578-z},
pdf = {papers/vismet.pdf},
teaser = {teasers/vismet.png},
abstract = {Purpose: To investigate the efficacy of visual training with stimulation in patients with dry age-related macular degeneration (AMD).
Method: The Medical Eye Trainer (M.E.T.) was tested in 67 patients with dry AMD. By using the training system, the entire visual system is treated. A moving grid is displayed on a standard smartphone or tablet. The training was carried out once a day for 90 seconds over a total period of two months.
Results: The Medical Eye Trainer (M.E.T.) significantly improved visual function after two months. The results of a questionnaire, which was used after the therapy, also showed a satisfactory stabilization or improvement of the findings.
Conclusions: The M.E.T. represents an effective additional treatment option for patients with dry AMD without interfering with established treatment methods.},
keywords = {macular degeneration, dry AMD, visual training, visual perception},
note = {In German},
}
@article{rajabiseraji2024hybridaxes,
title = {Analyzing User Behaviour Patterns in a Cross-virtuality Immersive Analytics System},
author = {Rajabi Seraji*, Mohammad and Piray*, Parastoo and Zahednejad*, Vahid and Stuerzlinger, Wolfgang},
journal = {Transactions on Visualization and Computer Graphics},
publisher = {IEEE},
series = {TVCG},
year = {2024},
month = {Mar},
volume = {30},
number = {5},
pages = {2613-2623},
doi = {https://doi.org/10.1109/TVCG.2024.3372129},
pdf = {papers/hybridaxes2.pdf},
teaser = {teasers/hybridaxes2.png},
video = {videos/hybridaxes2.mp4},
abstract = {Recent work in immersive analytics suggests benefits for systems that support work across both 2D and 3D data visualizations, i.e., cross-virtuality analytics systems. Here, I introduce HybridAxes, an immersive visual analytics system that enables users to conduct their analysis either in 2D on desktop monitors or in 3D within an immersive AR environment - while enabling them to seamlessly switch and transfer their visualizations between the two modes. The results of my user study show that the cross-virtuality sub-systems in HybridAxes complement each other well in helping the users in their data-understanding journey. I show that users preferred using the AR component for exploring the data, while they used the desktop component to work on more detail-intensive tasks. Despite encountering some minor challenges in switching between the two virtuality modes, users consistently rated the whole system as highly engaging, user-friendly, and helpful in streamlining their analytics processes. Finally, I present suggestions for designers of cross-virtuality visual analytics systems and identify avenues for future work.},
keywords = {immersive analytics, cross-reality, augmented reality},
award = {This work received an Honorable Mention Award},
note = {VR '24}
}
@article{barrera2023immersivesketchingframework,
title = {Toward More Comprehensive Evaluations of 3D Immersive Sketching, Drawing, and Painting},
author = {Barrera Machuca, Mayra Donaji and Israel, Johann Habakuk and Keefe, Daniel F. and Stuerzlinger, Wolfgang},
journal = {Transactions on Visualization and Computer Graphics},
publisher = {IEEE},
series = {TVCG},
year = {2024},
month = {Aug},
volume = {30},
number = {8},
pages = {4648-4664},
doi = {https://doi.org/10.1109/TVCG.2023.3276291},
pdf = {papers/immersivesketchingframework.pdf},
teaser = {teasers/immersivesketchingframework.png},
abstract = {To understand current practice and explore the potential for more comprehensive evaluations of 3D immersive sketching, drawing, and painting, we present a survey of evaluation methodologies used in existing 3D sketching research, a breakdown and discussion of important phases (sub-tasks) in the 3D sketching process, and a framework that suggests how these factors can inform evaluation strategies in future 3D sketching research. Existing evaluations identified in the survey are organized and discussed within three high-level categories: 1) evaluating the 3D sketching activity, 2) evaluating 3D sketching tools, and 3) evaluating 3D sketching artifacts. The new framework suggests targeting evaluations to one or more of these categories and identifying relevant user populations. In addition, building upon the discussion of the different phases of the 3D sketching process, the framework suggests to evaluate relevant sketching tasks, which may range from low-level perception and hand movements to high-level conceptual design. Finally, we discuss limitations and challenges that arise when evaluating 3D sketching, including a lack of standardization of evaluation methods and multiple, potentially conflicting, ways to evaluate the same task and user interface usability; we also identify opportunities for more holistic evaluations. We hope the results can contribute to accelerating research in this domain and, ultimately, broad adoption of immersive sketching systems.},
keywords = {3D sketching, 3D drawing, 3D painting},
}
@article{mostajeran2023biophilic,
title = {Adding Virtual Plants Leads to Higher Cognitive Performance and Psychological Well-being in Virtual Reality},
author = {Mostajeran, Fariba and Steinicke, Frank and Reinhart*, Sarah and Stuerzlinger, Wolfgang and Riecke, Bernhard E. and Kühn, Simone},
journal = {Scientific Reports},
publisher = {Nature Portfolio},
series = {SciRep},
year = {2023},
month = {May},
volume = {13},
number = {1},
numpages = {12},
doi = {https://doi.org/10.1038/s41598-023-34718-3},
pdf = {papers/biophilic.pdf},
teaser = {teasers/biophilic.png},
abstract = {Previous research has shown the positive effects of exposure to real and virtual nature. To investigate how such benefits might generalize to ever-more-prevalent virtual workplaces, we examined the effects of the absence or presence of virtual plants in an office environment in Virtual Reality (VR) on users’ cognitive performance and psychological well-being. The results of our user study with 39 participants show that in the presence of virtual plants, participants performed significantly better in both short-term memory and creativity tasks. Furthermore, they reported higher psychological well-being scores, including positive affect and attentive coping, whilst reporting lower feelings of anger and aggression after exposure to virtual plants in VR. The virtual office with plants was also perceived as more restorative and induced a higher sense of presence. Overall, these results highlight how the presence of virtual plants in VR can have positive influences on users, and therefore, constitute important design considerations when developing future working and learning spaces.},
keywords = {biophilic design, cognition, well-being},
}
@article{kaya2023covidvis,
title = {Evaluation of an Immersive COVID-19 Data Visualization},
author = {Kaya+, Furkan and Celik+, Elif and Batmaz, Anil Ufuk and Mutasim*, Aunnoy K and Stuerzlinger, Wolfgang},
journal = {Computer Graphics & Applications},
publisher = {IEEE},
series = {CG&A},
year = {2023},
month = {Jan},
volume = {43},
number = {1},
pages = {76-83},
doi = {https://doi.org/10.1109/MCG.2022.3223535},
pdf = {papers/covidvis.pdf},
teaser = {teasers/covidvis.png},
abstract = {COVID-19 restrictions have detrimental effects on the population, both socially and economically. However, these restrictions are necessary as they help reduce the spread of the virus. For the public to comply, easily comprehensible communication between decision-makers and the public is thus crucial. To address this, we propose a novel 3D visualization of COVID-19 data which could increase the awareness of COVID-19 trends in the general population. We conducted a user study and compared a conventional 2D visualization with the proposed method in an immersive environment. Results showed that the our 3D visualization approach facilitated understanding of the complexity of COVID-19. A majority of participants preferred to see the COVID-19 data with the 3D method. Moreover, individual results revealed that our method increases the engagement of users with the data. We hope that our method will help governments to improve their communication with the public in the future.},
keywords = {visualization, 3D visualization, immersive analytics},
}
@article{villanueva2022advancedfatigue,
title = {Advanced Modeling Method for Quantifying Cumulative Subjective Fatigue in Mid-Air Interaction},
author = {Villanueva*, Ana Maria and Jang*, Sujin and Stuerzlinger, Wolfgang and Ambike, Satyajit and Ramani, Karthik},
journal = {International Journal of Human-Computer Studies},
publisher = {Elsevier},
series = {IJHCS},
year = {2023},
month = {Jan},
volume = {169},
commented-number = {0},
articleno = {102931},
numpages = {15},
doi = {https://doi.org/10.1016/j.ijhcs.2022.102931},
pdf = {papers/advancedfatigue.pdf},
teaser = {teasers/advancedfatigue.png},
abstract = {Interaction in mid-air can be fatiguing. A model-based method to quantify cumulative subjective fatigue for such interaction was recently introduced in HCI research. This model separates muscle units into three states: active (MA) fatigued (MF) or rested (MR) and defines transition rules between states. This method demonstrated promising accuracy in predicting subjective fatigue accumulated in mid-air pointing tasks. In this paper, we introduce an improved model that additionally captures the variations of the maximum arm strength based on arm postures and adds linearly-varying model parameters based on current muscle strength. To validate the applicability and capabilities of the new model, we tested its performance in various mid-air interaction conditions, including mid-air pointing/docking tasks, with shorter and longer rest and task periods, and a long-term evaluation with individual participants. We present results from multiple cross-validations and comparisons against the previous model and identify that our new model predicts fatigue more accurately. Our modeling approach showed a 42.5% reduction in fatigue estimation error when the longitudinal experiment data is used for an individual participant’s fatigue. Finally, we discuss the applicability and capabilities of our new approach.},
keywords = {fatigue, mid-air, model, docking, 3D manipulation},
}
@article{yamanaka2022pathsegmentation,
title = {The Effectiveness of Path-segmentation for Modeling Lasso Times in Width-varying Paths},
author = {Yamanaka, Shota and Usuba*, Hiroki and Stuerzlinger, Wolfgang and Miyashita, Homei},
journal = {Proceedings of the ACM Human-Computer Interaction},
publisher = {ACM},
series = {PACM-HCI},
year = {2022},
month = {Dec},
volume = {6},
number = {ISS},
articleno = {584},
pages = {640-659},
doi = {https://doi.org/10.1145/3567737},
pdf = {papers/pathsegmentation.pdf},
video = {videos/pathsegmentation.mp4},
teaser = {teasers/pathsegmentation.png},
abstract = {Models of lassoing time to select multiple square icons exist, but realistic lasso tasks also typically involve encircling non-rectangular objects. Thus, it is unclear if we can apply existing models to such conditions where, e.g., the width of the path that users want to steer through changes dynamically or step-wise. In this work, we conducted two experiments where the objects were non-rectangular with path widths that narrowed or widened, smoothly or step-wise. The results showed that the baseline models for pen-steering movements (the steering and crossing law models) fitted the timing data well, but also that segmenting width-changing areas led to significant improvements. Our work enables the modeling of novel UIs requiring continuous strokes, e.g., for grouping icons.},
keywords = {steering, crossing, lasso, group selection},
note = {ISS '22},
}
@article{batmaz2022throughput,
title = {Effective Throughput Analysis of Different Task Execution Strategies for Mid-Air Fitts' Tasks in Virtual Reality},
author = {Batmaz, Anil Ufuk and Stuerzlinger, Wolfgang},
journal = {Transactions on Visualization and Computer Graphics},
publisher = {IEEE},
series = {TVCG},
year = {2022},
month = {Oct},
volume = {28},
number = {11},
pages = {3939-3947},
doi = {https://doi.org/10.1109/TVCG.2022.3203105},
commented-url = {https://youtu.be/lMUSoiAdwWA},
pdf = {papers/throughputstrategies.pdf},
teaser = {teasers/throughputstrategies.png},
abstract = {Fitts’ law and throughput based on effective measures are two mathematical models frequently used to analyze human motor performance together with a standardized task, e.g., to compare the performance of input and output devices. Even though pointing has been deeply studied in 2D, it is not well understood how different task execution strategies affect throughput in 3D virtual environments. In this work, we examine MacKenzie’s effective throughput measure, claimed to be invariant to task execution strategies, in Virtual Reality (VR) systems with three such strategies, “as fast, as precise, and as fast and as precise as possible” for ray casting and virtual hand interaction, by re-analyzing data from a 3D pointing ISO 9241-411 study. Results show that effective throughput is not invariant for different task execution strategies in VR, which also matches a more recent 2D result. Normalized speed vs accuracy curves also did not fit the data. We suggest that practitioners, developers, and researchers who use MacKenzie’s effective throughput formulation should consider our findings when analyzing 3D user pointing performance in VR systems.},
keywords = {3D pointing, speed-accuracy tradeoff},
note = {ISMAR '22},
}
@article{nowak2021visualanalytics,
title = {Visual Analytics: A Method to Explore Natural Histories of Oral Epithelial Dysplasia},
author = {Nowak*, Stan and Rosin, Miriam and Stuerzlinger, Wolfgang and Bartram, Lyn},
journal = {Frontiers in Oral Health},
publisher = {Frontiers},
year = {2021},
month = {Aug},
volume = {2},
articleno = {703874},
numpages = {10},
doi = {https://doi.org/10.3389/froh.2021.703874},
pdf = {papers/va4oralcancerDRAFT.pdf},
teaser = {teasers/va4oralcancer.png},
abstract = {Risk assessment and follow-up of oral potentially malignant lesions in patients with mild or moderate oral epithelial dysplasia is an ongoing challenge for improved oral cancer prevention. Part of the challenge is a lack of understanding of how observable features of such dysplasia, gathered as data by clinicians during follow-up, relate to underlying biological processes driving progression. Current research is at an exploratory phase where the precise questions to ask are not known. While traditional statistical and the newer machine learning and artificial intelligence methods are effective in well-defined problem spaces with large datasets, these are not the circumstances we face currently. We argue that the field is in need of exploratory methods that can better integrate clinical and scientific knowledge into analysis to iteratively generate viable hypotheses. In this perspective, we propose that visual analytics presents a set of methods well-suited to these needs. We illustrate how visual analytics excels at generating viable research hypotheses by describing our experiences using visual analytics to explore temporal shifts in the clinical presentation of epithelial dysplasia. Visual analytics complements existing methods and fulfills a critical and at-present neglected need in the formative stages of inquiry we are facing.},
keywords = {visual analytics, oral health, visualization, oral cancer},
commented-note = {draft version},
}
@article{wagner2021interaction,
title = {Comparing and Combining Virtual Hand and Virtual Ray Pointer Interactions for Data Manipulation in Immersive Analytics},
author = {Wagner Filho*, Jorge and Stuerzlinger, Wolfgang and Nedel, Luciana},
journal = {Transactions on Visualization and Computer Graphics},
publisher = {IEEE},
series = {TVCG},
year = {2021},
month = {Mar},
volume = {27},
number = {5},
pages = {2513-2523},
doi = {https://doi.org/10.1109/TVCG.2021.3067759},
pdf = {papers/stcinteraction.pdf},
video = {videos/stcinteraction.mp4},
teaser = {teasers/stcinteraction.png},
abstract = {Displaying data visualizations in Virtual Reality environments enables analysts to explore large amounts of information more easily, supported by different perspectives and stereoscopic 3D display. Easy-to-use interaction affords additional benefits, such as more intuitively querying or filtering the data. Many Immersive Analytics systems employ either a virtual hands metaphor, with actions such as grabbing and stretching, or virtual ray pointers, with actions assigned to controller buttons. However, the effect of this choice in immersive visualization systems is unknown. Considering that each approach has different advantages, we implemented and evaluated both as well as a third option: seamlessly integrating both modes and allowing the user to alternate between them without explicit mode switches. We compared these three conditions through a controlled user study in the spatio-temporal data domain. We did not find significant differences between hands and ray-casting in task performance, workload, or interactivity patterns. Yet, 60% of the participants preferred the mixed mode and benefited from it by choosing the best alternative for each low-level task. This mode significantly reduced completion times by 23% for the most demanding task, at the cost of a 5% decrease in overall success rates.},
keywords = {visual analytics, immersive analytics, space-time cube, 3D visualization, 3D interaction},
note = {VR '21},
}
@article{wagner2021navigation,
title = {The Effect of Exploration Mode and Frame of Reference in Immersive Analytics},
author = {Wagner Filho*, Jorge and Stuerzlinger, Wolfgang and Nedel, Luciana},
journal = {Transactions on Visualization and Computer Graphics},
publisher = {IEEE},
series = {TVCG},
year = {2021},
month = {Feb},
volume = {28},
number = {9},
numpages = {3252-3264},
doi = {https://doi.org/10.1109/TVCG.2021.3060666},
pdf = {papers/stcnavigation.pdf},
video = {videos/stcnavigation.mp4},
teaser = {teasers/stcnavigation.png},
abstract = {The design space for user interfaces for Immersive Analytics applications is vast. Designers can combine navigation and manipulation to enable data exploration with ego- or exocentric views, have the user operate at different scales, or use different forms of navigation with varying levels of physical movement. This freedom results in a multitude of different viable approaches. Yet, there is no clear understanding of the advantages and disadvantages of each choice. Our goal is to investigate the affordances of several major design choices, to enable both application designers and users to make better decisions. In this work, we assess two main factors, exploration mode and frame of reference, consequently also varying visualization scale and physical movement demand. To isolate each factor, we implemented nine different conditions in a Space-Time Cube visualization use case and asked 36 participants to perform multiple tasks. We analyzed the results in terms of performance and qualitative measures and correlated them with participants' spatial abilities. While egocentric room-scale exploration significantly reduced mental workload, exocentric exploration improved performance in some tasks. Combining navigation and manipulation made tasks easier by reducing workload, temporal demand, and physical effort.},
keywords = {visual analytics, immersive analytics, space-time cube, 3D visualization, 3D navigation},
}
@comment{c, c={issue appeared in 2021}}
@article{gloumeau2020pinnpivot,
title = {{PinNPivot}: Object Manipulation Using Pins in Immersive Virtual Environments},
author = {Gloumeau*, Paul Christopher and Stuerzlinger, Wolfgang and Han, JungHyun},
journal = {Transactions on Visualization and Computer Graphics},
publisher = {IEEE},
series = {TVCG},
year = {2020},
month = {Apr},
volume = {27},
number = {4},
pages = {2488-2494},
doi = {https://doi.org/10.1109/TVCG.2020.2987834},
pdf = {papers/pinnpivot.pdf},
video = {videos/pinnpivot.mp4},
teaser = {teasers/pinnpivot.png},
abstract = {Object manipulation techniques in immersive virtual environments are either inaccurate or slow. We present a novel technique, PinNPivot, where pins are used to constrain 1DOF/2DOF/3DOF rotations. It also supports 6DOF manipulation and 3DOF translation. A comparison with three existing techniques shows that PinNPivot is significantly more accurate and faster.},
keywords = {3D manipulation, docking},
}
@article{batmaz2020beam,
title = {How Automatic Speed Control Based on Distance Affects User Behaviours in Telepresence Robot Navigation within Dense Conference-like Environments},
author = {Batmaz, Anil Ufuk and Maiero*, Jens and Kruijff, Ernst and Riecke, Bernhard E. and Neustaedter, Carman and Stuerzlinger, Wolfgang},
journal = {PLoS ONE},
publisher = {Public Library of Science},
year = {2020},
month = {Nov},
volume = {15},
number = {11},
articleno = {e0242078},
numpages = {47},
doi = {https://doi.org/10.1371/journal.pone.0242078},
pdf = {papers/beamspeed.pdf},
teaser = {teasers/beamspeed.png},
commented-series = {PLOS One},
abstract = {Telepresence robots allow users to be spatially and socially present in remote environments. Yet, it can be challenging to remotely operate telepresence robots, especially in dense environments such as academic conferences or workplaces. In this paper, we primarily focus on the effect that a speed control method, which automatically slows the telepresence robot down when getting closer to obstacles, has on user behaviors. In our first user study, participants drove the robot through a static obstacle course with narrow sections. Results indicate that the automatic speed control method significantly decreases the number of collisions. For the second study we designed a more naturalistic, conference-like experimental environment with tasks that require social interaction, and collected subjective responses from the participants when they were asked to navigate through the environment. While about half of the participants preferred automatic speed control because it allowed for smoother and safer navigation, others did not want to be influenced by an automatic mechanism. Overall, the results suggest that automatic speed control simplifies the user interface for telepresence robots in static dense environments, but should be considered as optionally available, especially in situations involving social interactions.},
keywords = {telepresence robot, automatic distance, 3D navigation, speed control},
}
@article{alharbi2020frustration,
title = {The Effects of Predictive Features of Mobile Keyboards on Text Entry Speed and Errors},
author = {Alharbi*, Ohoud and Stuerzlinger, Wolfgang and Putze, Felix},
journal = {Proceedings of the ACM Human-Computer Interaction},
publisher = {ACM},
series = {PACM-HCI},
year = {2020},
month = {Nov},
volume = {4},
number = {ISS},
articleno = {183},
numpages = {16},
doi = {https://doi.org/10.1145/3427311},
pdf = {papers/autocorrectfrustration.pdf},
teaser = {teasers/autocorrectfrustration.png},
abstract = {Mobile users rely on typing assistant mechanisms such as prediction and autocorrect. Previous studies on mobile keyboards showed decreased performance for heavy use of word prediction, which identifies a need for more research to better understand the effectiveness of predictive features for different users. Our work aims at such a better understanding of user interaction with autocorrections and the prediction panel while entering text, in particular when these approaches fail. We present a crowd-sourced mobile text entry study with 170 participants. Our mobile web application simulates autocorrection and word prediction to capture user behaviours around these features. We found that using word prediction saves an average of 3.43 characters per phrase but also adds an average of two seconds compared to actually typing the word, resulting in a negative effect on text entry speed. We also identified that the time to fix wrong autocorrections is on average 5.5 seconds but that autocorrection does not have a significant effect on typing speed.},
keywords = {text entry, autocorrect, prediction, errors},
note = {ISS '20},
}
@article{yamanaka2020obstacle,
title = {Necessary and Unnecessary Obstacle Avoidance Movements Affect User Behaviors in Crossing Operations},
author = {Yamanaka, Shota and Stuerzlinger, Wolfgang},
journal = {Transactions on Computer-Human Interaction},
publisher = {ACM},
series = {TOCHI},
year = {2020},
month = {Nov},
volume = {27},
number = {6},
articleno = {44},
numpages = {31},
doi = {https://doi.org/10.1145/3418413},
pdf = {papers/obstacleavoidance.pdf},
teaser = {teasers/obstacleavoidance.png},
abstract = {The "crossing time" to pass between objects in lassoing tasks is predicted by Fitts' law. When an unwanted object, or obstacle, intrudes into the user's path, users curve the stroke to avoid hitting that obstacle. We empirically show that, in the presence of an obstacle, modified Fitts models for pointing with obstacle avoidance can significantly improve the prediction accuracy of movement time compared with standard Fitts' law. Yet, we also found that when an object is (only) close to the crossing path, i.e., a distractor, users still curve their stroke, even though the object does not intrude. We tested the effects of distractor proximity and length. While the crossing motion is modified by a nearby distractor, our results also identify that overall its effect on crossing times was small, and thus Fitts' law can still be applied safely with distractors.},
keywords = {steering, crossing, lasso, group selection, obstacle},
}
@comment{c, c={could be re-classified as misc, see also the blog entry: steed2020covidblog}}
@article{steed2020covid,
title = {Evaluating Immersive Experiences during {COVID-19} and Beyond},
author = {Steed, Anthony and Ortega, Francisco R. and Williams, Adam S. and Kruijff, Ernst and Stuerzlinger, Wolfgang and Batmaz, Anil Ufuk and Stevenson Won, Andrea and Suma Rosenberg, Evan and Simeone, Adalberto L. and Hayes, Aleshia},
journal = {Interactions},
publisher = {ACM},
year = {2020},
month = {Jul},
volume = {27},
number = {4},
pages = {62–67},
doi = {https://doi.org/10.1145/3406098},
pdf = {papers/evaluatingimmersive.pdf},
abstract = {The COVID-19 pandemic has disrupted our daily lives. The safety and well-being of people are paramount, and there is no exception for the human-computer interaction (HCI) field. Most universities and research labs have closed non-critical research labs. With that closure and the student populations having left campus, in-person user studies have been suspended for the foreseeable future. Experiments that involve the usage of specialized technology, such as virtual and augmented reality headsets, create additional challenges. While some head-mounted displays (HMDs) have become more affordable for consumers (e.g., Oculus Quest), there are still multiple constraints for researchers, including the expense of high-end HMDs (e.g., Microsoft Hololens), high-end graphics hardware, and specialized sensors, as well as ethical concerns around reusing equipment that comes in close contact with each participant and may be difficult to sterilize. These difficulties have led the extended reality (XR) community (which includes the virtual reality (VR) and augmented reality (AR) research communities) to ask how we can continue to practically and ethically run experiments under these circumstances. Here, we summarize the status of a community discussion of short-term, medium-term, and long-term measures to deal with the current COVID-19 situation and its potential longer-term impacts. In particular, we outline steps we are taking toward community support of distributed experiments. There are a number of reasons to look at a more distributed model of participant recruitment, including the generalizability of the work and potential access to target-specific, hard-to-reach user groups. We hope that this article will inform the first steps toward addressing the practical and ethical concerns for such studies.},
keywords = {3D user interfaces, COVID-19, virtual reality, augmented reality, extended reality},
}
@article{maiero2019backofdevice,
title = {Back-of-Device Force Feedback Improves Touchscreen Interaction for Mobile Devices},
author = {Maiero*, Jens and Eibich*, David and Kruijff, Ernst and Hinkenjann, André and Stuerzlinger, Wolfgang and Benko, Hrvoje and Ghinea, George},
journal = {Transactions on Haptics},
publisher = {IEEE},
series = {TOH},
year = {2019},
month = {Oct},
volume = {12},
number = {4},
pages = {483-496},
doi = {https://doi.org/10.1109/TOH.2019.2911519},
pdf = {papers/hapticphone.pdf},
teaser = {teasers/hapticphone.png},
abstract = {Touchscreen interaction suffers from occlusion problems as fingers can cover small targets, which makes interacting with such targets challenging. To improve touchscreen interaction accuracy and consequently the selection of small or hidden objects, we introduce a back-of-device force feedback system for smartphones. We introduce a new solution that combines force feedback on the back to enhance touch input on the front screen. The interface includes three actuated pins at the back of a smartphone. All three pins are driven by microservos and can be actuated up to a frequency of 50 Hz and a maximum amplitude of 5 mm. In a first psychophysical user study, we explored the limits of the system. Thereafter, we demonstrate through a performance study that the proposed interface can enhance touchscreen interaction precision, compared to state-of-the-art methods. In particular, the selection of small targets performed remarkably well with force feedback. The study additionally shows that users subjectively felt significantly more accurate with force feedback. Based on the results, we discuss back-to-front feedback design issues and demonstrate potential applications through several prototypical concepts to illustrate where the back-of-device force feedback could be beneficial.},
keywords = {haptics, mobile device, touch},
}
@comment{c, c={issue appeared in 2021}}
@article{nguyenvo2019naviboard,
title = {{NaviBoard} and {NaviChair}: Limited Translation Combined with Full Rotation for Efficient Virtual Locomotion},
author = {Nguyen-Vo*, Thinh and Riecke, Bernhard E. and Stuerzlinger, Wolfgang and Pham*, Duc-Minh and Kruijff, Ernst},
journal = {Transactions on Visualization and Computer Graphics},
publisher = {IEEE},
series = {TVCG},
year = {2019},
month = {Aug},
volume = {27},
number = {1},
pages = {165-177},
doi = {https://doi.org/10.1109/TVCG.2019.2935730},
pdf = {papers/naviboard.pdf},
video = {https://www.youtube.com/watch?v=JCYL2qVFO6M},
teaser = {teasers/naviboard.png},
abstract = {Walking has always been considered as the gold standard for navigation in Virtual Reality research. Though full rotation is no longer a technical challenge, physical translation is still restricted through limited tracked areas. While rotational information has been shown to be important, the benefit of the translational component is still unclear with mixed results in previous work. To address this gap, we conducted a mixed-method experiment to compare four levels of translational cues and control: none (using the trackpad of the HTC Vive controller to translate), upper-body leaning (sitting on a "NaviChair", leaning the upper-body to locomote), whole-body leaning/stepping (standing on a platform called NaviBoard, leaning the whole body or stepping one foot off the center to navigate), and full translation (physically walking). Results showed that translational cues and control had significant effects on various measures including task performance, task load, and simulator sickness. While participants performed significantly worse when they used a controller with no embodied translational cues, there was no significant difference between the NaviChair, NaviBoard, and actual walking. These results suggest that translational body-based motion cues and control from a low-cost leaning/stepping interface might provide enough sensory information for supporting spatial updating, spatial awareness, and efficient locomotion in VR, although future work will need to investigate how these results might or might not generalize to other tasks and scenarios.},
keywords = {3D navigation, speed control},
}
@article{wagner2019evaluating,
title = {Evaluating an Immersive Space-Time Cube Geovisualization for Intuitive Trajectory Data Exploration},
author = {Wagner Filho*, Jorge and Stuerzlinger, Wolfgang and Nedel, Luciana},
journal = {Transactions on Visualization and Computer Graphics},
publisher = {IEEE},
series = {TVCG},
year = {2019},
month = {Oct},
volume = {26},
number = {1},
pages = {514-524},
doi = {https://doi.org/10.1109/TVCG.2019.2934415},
pdf = {papers/stcvirtualdesk.pdf},
video = {videos/stcvirtualdesk.mp4},
teaser = {teasers/stcvirtualdesk.png},
abstract = {A Space-Time Cube enables analysts to clearly observe spatio-temporal features in movement trajectory datasets in geovisualization. However, its general usability is impacted by a lack of depth cues, a reported steep learning curve, and the requirement for efficient 3D navigation. In this work, we investigate a Space-Time Cube in the Immersive Analytics domain. Based on a review of previous work and selecting an appropriate exploration metaphor, we built a prototype environment where the cube is coupled to a virtual representation of the analyst's real desk, and zooming and panning in space and time are intuitively controlled using mid-air gestures. We compared our immersive environment to a desktop-based implementation in a user study with 20 participants across 7 tasks of varying difficulty, which targeted different user interface features. To investigate how performance is affected in the presence of clutter, we explored two scenarios with different numbers of trajectories. While the quantitative performance was similar for the majority of tasks, large differences appear when we analyze the patterns of interaction and consider subjective metrics. The immersive version of the Space-Time Cube received higher usability scores, much higher user preference, and was rated to have a lower mental workload, without causing participants discomfort in 25-minute-long VR sessions.},
keywords = {visual analytics, immersive analytics, space-time cube, 3D visualization},
note = {VIS '19},
}
@article{yamanaka2018analysis,
title = {Analysis and Modeling the Steering Operations in Sequential Linear Path Segments},
author = {Yamanaka*, Shota and Stuerzlinger, Wolfgang and Miyashita, Homei},
journal = {IPSJ Journal},
publisher = {Information Processing Society of Japan},
issn = {1882-7764},
year = {2018},
month = {Feb},
volume = {59},
number = {2},
pages = {633-643},
commented-url = {http://id.nii.ac.jp/1001/00185782},
url = {https://ipsj.ixsq.nii.ac.jp/records/185870},
keywords = {steering, lasso, group selection},
note = {In Japanese},
}
@article{seim2017passivehaptic,
title = {Passive Haptic Training to Improve Speed and Performance on a Keypad},
author = {Seim*, Caitlyn and Doering+, Nick and Zhang+, Yang and Stuerzlinger, Wolfgang and Starner, Thad},
journal = {Proceedings on Interactive, Mobile, Wearable and Ubiquitous Technologies},
publisher = {ACM},
series = {IMWUT},
year = {2017},
month = {Sep},
volume = {1},
number = {3},
articleno = {100},
numpages = {13},
doi = {https://doi.org/10.1145/3132026},
pdf = {papers/passivehapticslearning.pdf},
teaser = {teasers/passivehapticslearning.png},
abstract = {Learning text entry systems is challenging, yet necessary. Many layouts and keyboards exist, but they rely on laborious learning techniques. Passive haptic learning (PHL) has already demonstrated some benefit for learning the Braille text entry system. Could this computing-enabled technique be used to improve desktop keyboard typing skills? It is unknown whether passive haptic training can improve speed on a motor task (as opposed to initial learning). We use a randomized numeric keypad to examine users' typing performance with or without passive haptic training. When users were prevented from looking at the keyboard, the PHL group demonstrated consistent accuracy (-0.011 KSPC) while those in the control group greatly increased their error (+1.26 KSPC on average). This result is consistent with the finding that PHL users looked significantly less at the keyboard. In a second, longer study, users exposed to PHL were found to significantly improve their typing speed (mean increase of 11 WPM) versus control (mean increase of 2.2 WPM).},
keywords = {haptics, learning, text entry},
note = {Ubicomp '17},
}
@article{waese2017eplant,
title = {{ePlant}: Visualizing and Exploring Multiple Levels of Data for Hypothesis Generation in Plant Biology},
author = {Waese*, Jamie and Fan+, Jim and Pasha+, Asher and Yu+, Hans and Fucile, Geoffrey and Shi+, Ian and Cumming+, Matthew and Kelley, Lawrence and Sternberg, Michael and Krishnakumar, Vivek and Ferlanti, Erik and Miller, Jason and Town, Chris and Stuerzlinger, Wolfgang and Provart, Nicholas},
journal = {The Plant Cell},
publisher = {American Society of Plant Biologists},
year = {2017},
month = {Aug},
volume = {29},
number = {8},
pages = {1806-1821},
doi = {https://doi.org/10.1105/tpc.17.00073},
url = {http://bar.utoronto.ca/eplant},
pdf = {papers/eplant.pdf},
teaser = {teasers/eplant.png},
abstract = {A big challenge in current systems biology research arises when different types of data must be accessed from separate sources and visualized using separate tools. The high cognitive load required to navigate such a workflow is detrimental to hypothesis generation. Accordingly, there is a need for a robust research platform that incorporates all data and provides integrated search, analysis, and visualization features through a single portal. Here, we present ePlant (http://bar.utoronto.ca/eplant), a visual analytic tool for exploring multiple levels of Arabidopsis thaliana data through a zoomable user interface. ePlant connects to several publicly available web services to download genome, proteome, interactome, transcriptome, and 3D molecular structure data for one or more genes or gene products of interest. Data are displayed with a set of visualization tools that are presented using a conceptual hierarchy from big to small, and many of the tools combine information from more than one data type. We describe the development of ePlant in this article and present several examples illustrating its integrative features for hypothesis generation. We also describe the process of deploying ePlant as an "app" on Araport. Building on readily available web services, the code for ePlant is freely available for any other biological species research.},
keywords = {visualization, visual analytics},
}
@comment{c, c={not sure if this is best article or proceedings}}
@article{dwyer2016dagstuhl,
title = {Immersive Analytics (Dagstuhl Seminar 16231)},
author = {Dwyer, Tim and Henry Riche, Nathalie and Klein, Karsten and Stuerzlinger, Wolfgang and Thomas, Bruce H.},
journal = {Dagstuhl Reports},
publisher = {Schloss Dagstuhl-Leibniz-Zentrum fuer Informatik},
commented-series = {Dagstuhl Seminar 16231},
issn = {2192-5283},
year = {2016},
month = {Nov},
volume = {6},
number = {6},
pages = {1-9},
doi = {https://doi.org/10.4230/DagRep.6.6.1},
pdf = {papers/dagstuhl_IA.pdf},
teaser = {teasers/dagstuhl.png},
abstract = {This report documents the program and the outcomes of Dagstuhl Seminar 16231 "Immersive Analytics". Close to 40 researchers and practitioners participated in this seminar to discuss and define the field of Immersive Analytics, to create a community around it, and to identify its research challenges. As the participants had a diverse background in a variety of disciplines, including Human-Computer-Interaction, Augmented and Virtual Reality, Information Visualization, and Visual Analytics, the seminar featured a couple of survey talks on the first days, followed by plenary and working group discussions that were meant to shape the field of Immersive Analytics. As an outcome, a book publication is planned with book chapters provided by the participants.},
keywords = {visual analytics, visualization, immersive analytics},
}
@article{liang2013investigation,
title = {An Investigation of Suitable Interactions for {3D} Manipulation of Distant Objects Through a Mobile Device},
author = {Liang, Hai-Ning and Williams*, Cary and Semegen, Myron and Stuerzlinger, Wolfgang and Irani, Pourang},
journal = {International Journal on Innovative Computing, Information and Control},
issn = {1349-4198},
year = {2013},
month = {Dec},
volume = {9},
number = {12},
pages = {4737-4752},
url = {http://www.ijicic.org/vol-9(12).htm},
pdf = {papers/dualsurface2.pdf},
teaser = {teasers/dualsurface2.png},
abstract = {In this paper, we present our research linking two types of technologies that are gaining importance: mobile devices and large displays. Mobile devices now come integrated with a variety of sophisticated sensors, including multi-touch displays, gyroscopes and accelerometers, which allow them to capture rich varieties of gestures and make them ideal to be used as input devices to interact with an external display. In this research we explore what types of sensors are easy and intuitive to use to support people's exploration of 3D objects shown in large displays located at a distance. To conduct our research we have developed a device with two multi-touch displays, one on its front and the other in the back, and motion sensors. We then conducted an exploratory study in which we asked participants to provide interactions that they believe are easy and natural to perform operations with 3D objects. We have aggregated the results and found some common patterns about users' preferred input sensors and common interactions. In this paper we report the findings of the study and describe a new interface whose design is informed by the results.},
keywords = {3D manipulation, docking, mobile device},
}
@article{pintilie2013evaluation,
title = {An Evaluation of Interactive and Automated Next-best View Methods in {3D} Scanning},
author = {Pintilie*, Grigori D. and Stuerzlinger, Wolfgang},
journal = {Computer-Aided Design and Applications},
year = {2013},
month = {Mar},
volume = {10},
number = {2},
pages = {279-291},
doi = {https://doi.org/10.3722/cadaps.2013.279-291},
pdf = {papers/scanUI.pdf},
teaser = {teasers/scanUI.png},
abstract = {Scanning of objects to produce 3D models is becoming more commonplace as the required hardware is becoming less expensive and more widely attainable. The process involves obtaining scans of multiple views so as to create a complete 3D model. This is typically a user-driven process, and an analysis of the difficulty of this task, use of automation, visualization methods, and their effect on the final result has not yet been thoroughly investigated. In this paper we report on a user study related to 3D scanning in which the user is asked to use a simulated, somewhat simplified 3D scanner with a simple user interface. Our investigation focuses on scanning the complete surface of an object with decent sampling density, but does not take all sampling issues, such as reflections, into account. We evaluate different visualization methods, which aim to help the user complete or improve scans, and compare the results obtained by participants to those obtained using an automated approach. The results show that users can easily obtain complete scans or improve existing scans using this simple interface, and that different visualization methods are more or less equally effective; moreover, user performance is on par with automated scanning methods.},
keywords = {3D scanning, next-best view},
}
@article{mcarthur2010examining,
title = {Comparing {3D} Content Creation Interfaces in Two Virtual Worlds: World of Warcraft and Second Life},
author = {{McArthur}*, Victoria and Teather*, Robert J. and Stuerzlinger, Wolfgang},
journal = {Journal of Gaming & Virtual Worlds},
year = {2010},
month = {Dec},
volume = {2},
number = {3},
pages = {239-258},
doi = {https://doi.org/10.1386/jgvw.2.3.239_1},
pdf = {papers/3dui4virtualworldcreation.pdf},
teaser = {teasers/3dui4virtualworldcreation.png},
abstract = {In this article we compare the content creation systems of two popular virtual worlds: World of Warcraft and Second Life. We then discuss recommendations for 3D content creation systems based on current trends in 3D user interface research. We hypothesize that by designing 3D content creation systems that follow these recommendations, virtual world economies based on custom content creation (e.g., Second Life) may be transformed, as more people will be able to create and modify content.},
keywords = {3D modeling},
}
@article{bowman20083dui,
title = {{3D} User Interfaces: New Directions and New Perspectives},
author = {Bowman, Doug and Coquillart, Sabine and Fröhlich, Bernd and Hirose, Michitaka and Kitamura, Yoshifumi and Kiyokawa, Kiyoshi and Stuerzlinger, Wolfgang},
journal = {Computer Graphics & Applications},
publisher = {IEEE},
series = {CG&A},
year = {2008},
month = {Nov},
volume = {28},
number = {6},
pages = {20-36},
doi = {https://doi.org/10.1109/MCG.2008.109},
pdf = {papers/newdirections3dui.pdf},
abstract = {Three-dimensional user interfaces (3D UIs) allow users to interact with virtual objects, environments, or information using direct 3D input in the physical and/or virtual space. With the advent of systems like the Nintendo Wii, 3D UIs have entered the mainstream. Thus, research on 3D UIs is more relevant than ever. In this article, the founders and organizers of the IEEE Symposium on 3D User Interfaces reflect on the current state-of-the-art in several key aspects of 3D UIs, and speculate on future research directions for 3D UIs as well.},
keywords = {3D user interfaces},
}
@article{stuerzlinger2006covid,
title = {The Design and Realization of {CoViD}: A System for Collaborative Virtual {3D} Design},
author = {Stuerzlinger, Wolfgang and Zaman*, Loutfouz and Pavlovych*, Andriy and Oh*, Ji-Young},
journal = {Virtual Reality},
publisher = {Springer},
year = {2006},
month = {Oct},
volume = {10},
number = {2},
pages = {135-147},
doi = {https://doi.org/10.1007/s10055-006-0048-0},
pdf = {papers/covid.pdf},
teaser = {teasers/covid.png},
abstract = {Many important decisions in the design process are made fairly early on, after designers have presented initial concepts. In many domains, these concepts are already realized as 3D digital models. Then, in a meeting, the stakeholders for the project get together and evaluate these potential solutions. Frequently, the participants in this meeting want to interactively modify the proposed 3D designs to explore the design space better. Today's systems and tools do not support this, as computer systems typically support only a single user and computer-aided design tools require significant training.
This paper presents the design of a new system to facilitate a collaborative 3D design process. First, we discuss a set of guidelines which have been introduced by others and that are relevant to collaborative 3D design systems. Then, we introduce the new system, which consists of two main parts. The first part is an easy-to-use conceptual 3D design tool that can be used productively even by naive users. The tool provides novel interaction techniques that support important properties of conceptual design. The user interface is non-obtrusive, easy-to-learn, and supports rapid creation and modification of 3D models. The second part is a novel infrastructure for collaborative work, which offers an interactive table and several large interactive displays in a semi-immersive setup. It is designed to support multiple users working together. This infrastructure also includes novel pointing devices that work both as a stylus and a remote pointing device. The combination of the (modified) design tool with the collaborative infrastructure forms a new platform for collaborative virtual 3D design. Then, we present an evaluation of the system against the guidelines for collaborative 3D design. Finally, we present results of a preliminary user study, which asked naive users to collaborate in a 3D design task on the new system.},
keywords = {3D modeling, collaboration, design},
}
@article{vorozcovs2006hedgehog,
title = {The Hedgehog: A Novel Optical Tracking Method for Spatially Immersive Displays},
author = {Vorozcovs*, Andrew and Stuerzlinger, Wolfgang and Hogue*, Andrew and Allison, Robert},
journal = {Presence: Teleoperators & Virtual Environments},
year = {2006},
month = {Feb},
volume = {15},
number = {1},
pages = {108-121},
doi = {https://doi.org/10.1162/pres.2006.15.1.108},
pdf = {papers/hedgehog2.pdf},
teaser = {teasers/hedgehog2.png},
abstract = {Existing commercial technologies do not adequately meet the requirements for tracking in fully-enclosed Virtual Reality displays. We present a novel six degree of freedom tracking system, the Hedgehog, which overcomes several limitations inherent in existing sensors and tracking technology. The system reliably estimates the pose of the user's head with high resolution and low spatial distortion. Light emitted from an arrangement of lasers projects onto the display walls. An arrangement of cameras images the walls and the two-dimensional centroids of the projections are tracked to estimate the pose of the device. The system is able to handle ambiguous laser projection configurations, static and dynamic occlusions of the lasers, and incorporates an auto-calibration mechanism due to the use of the SCAAT (Single Constraint At A Time) algorithm. A prototype system was evaluated relative to a state-of-the-art motion tracker and showed comparable positional accuracy (1-2 mm RMS) and significantly better absolute angular accuracy (0.1 deg RMS).},
keywords = {3D tracking},
}
@article{seetzen2004hdrdisplay,
title = {High Dynamic Range Display Systems},
author = {Seetzen*, Helge and Heidrich, Wolfgang and Stuerzlinger, Wolfgang and Ward, Greg and Whitehead, Lorne and Trentacoste*, Matthew and Ghosh*, Abhijeet and Vorozcovs*, Andrew},
journal = {Transactions on Graphics},
publisher = {ACM},
series = {TOG},
year = {2004},
month = {Aug},
volume = {23},
number = {3},
pages = {760-768},
doi = {https://doi.org/10.1145/1015706.1015797},
pdf = {papers/hdrdisplays.pdf},
teaser = {teasers/hdrdisplays.png},
abstract = {The dynamic range of many real-world environments exceeds the capabilities of current display technology by several orders of magnitude. In this paper we discuss the design of two different display systems that are capable of displaying images with a dynamic range much more similar to that encountered in the real world. The first display system is based on a combination of an LCD panel and a DLP projector, and can be built from off-the-shelf components. While this design is feasible in a lab setting, the second display system, which relies on a custom-built LED panel instead of the projector, is more suitable for usual office workspaces and commercial applications. We describe the design of both systems as well as the software issues that arise. We also discuss the advantages and disadvantages of the two designs and potential applications for both systems.},
keywords = {high dynamic range, display},
note = {SIGGRAPH '04},
}
@article{oh2004conceptual,
title = {A System for Desktop Conceptual {3D} Design},
author = {Oh*, Ji-Young and Stuerzlinger, Wolfgang},
journal = {Virtual Reality},
publisher = {Springer},
year = {2004},
month = {Jun},
volume = {7},
number = {3-4},
pages = {198-211},
doi = {https://doi.org/10.1007/s10055-004-0128-y},
pdf = {papers/virtuallegodraft.pdf},
teaser = {teasers/virtuallego.png},
abstract = {In the traditional design process for a 3D environment, people usually depict a rough prototype to verify their ideas, and iteratively modify its configuration until they are satisfied with the general layout. In this activity, one of the main operations is the rearrangement of single and composite parts of a scene. With current desktop virtual reality (VR) systems, the selection and manipulation of arbitrary objects in 3D is still difficult. In this work, we present new and efficient techniques that allow even novice users to perform meaningful rearrangement tasks with traditional input devices. The results of our work show that the presented techniques can be mastered quickly and enable users to perform complex tasks on composite objects. Moreover, the system is easy to learn, supports creativity, and is fun to use.},
keywords = {3D modeling, 3D manipulation, 3D positioning, content creation, design},
}
@article{parilov2002perpixel,
title = {Per-pixel divisions},
author = {Parilov*, Sergey and Stuerzlinger, Wolfgang},
journal = {Journal of Graphics Tools},
series = {JGT},
year = {2002},
month = {Jun},
volume = {7},
number = {4},
pages = {53-59},
doi = {https://doi.org/10.1080/10867651.2002.10487572},
pdf = {papers/divisions.pdf},
abstract = {We describe a method to perform per-pixel divisions using graphics hardware, with a simple iterative algorithm. In the worst case, the number of rendering passes is 17 for approximate divisions, and 18 for accurate divisions. The algorithm can be used for 3D vector normalization, evaluating complex lighting models, and image reconstruction.},
keywords = {rendering, real-time},
}
@article{parilov2002layered,
title = {Layered Relief Textures},
author = {Parilov*, Sergey and Stuerzlinger, Wolfgang},
journal = {Journal of WSCG},
issn = {1213-6972},
year = {2002},
month = {Feb},
volume = {10},
number = {2},
pages = {357-364},
url = {http://wscg.zcu.cz/wscg2002/Papers_2002/F87.pdf},
pdf = {papers/lrt.pdf},
teaser = {teasers/lrt.png},
abstract = {In this paper we present an Image-Based Rendering method for post-warping LDI's in real-time on existing systems. The algorithm performs accurate splatting at low computational costs, reduces memory-access bottlenecks, enables us to trade-off the quality for the speed, and is simple to implement.},
keywords = {rendering, real-time, image-based},
note = {WSCG '02},
}
@article{elinas2000realtime,
title = {Real-time Rendering of {3D} Clouds},
author = {Elinas*, Pantelis and Stuerzlinger, Wolfgang},
journal = {Journal of Graphics Tools},
series = {JGT},
year = {2000},
month = {Jul},
volume = {5},
number = {4},
pages = {33-45},
doi = {https://doi.org/10.1080/10867651.2000.10487531},
pdf = {papers/clouds.pdf},
teaser = {teasers/clouds.png},
abstract = {The visual realism of a computer graphics simulation of outdoor scenery is greatly enhanced by realistic display of clouds. In this paper, we present an algorithm based on Gardner's work that can render perspectively correct 3D clouds in real-time on current graphics hardware. The use of 3D ellipsoids as primitives permits even close-ups without the viewer noticing the approximation. We describe an implementation using OpenGL.},
keywords = {rendering, real-time, image-based},
}
@article{stuerzlinger1998raytracing,
title = {Ray-Tracing Triangular Trimmed Free-Form Surfaces},
author = {Stürzlinger, Wolfgang},
journal = {Transactions on Visualization and Computer Graphics},
publisher = {IEEE},
series = {TVCG},
year = {1998},
month = {Jul},
volume = {4},
number = {3},
pages = {202-214},
doi = {https://doi.org/10.1109/2945.722295},
pdf = {papers/rtttffs.pdf},
teaser = {teasers/rtttffs.png},
abstract = {This paper presents a new approach to rendering triangular algebraic free form surfaces. A hierarchical subdivision of the surface with associated tight bounding volumes provides for quick identification of the surface regions likely to be hit by a ray. For each leaf of the hierarchy an approximation to the corresponding surface region is stored. The approximation is used to compute a good starting point for the iteration, which ensures rapid convergence.
Trimming curves are described by a tree of trimming primitives such as squares, circles, polygons and free form curves combined with Boolean operations. For trimmed surfaces an irregular adaptive subdivision is constructed to quickly eliminate all parts outside the trimming curve from consideration during rendering. Cost heuristics are introduced to optimize the rendering time further.},
keywords = {rendering, ray tracing},
}
@comment{c, c={unfortunate-dup, because paper selected by conference for journal, but conference proceedings later also reclassified as journal by publisher}}
@article{stuerzlinger1998calculating,
title = {Calculating Global Illumination for Glossy Surfaces},
author = {Stürzlinger, Wolfgang},
journal = {Computers & Graphics},
publisher = {Elsevier},
series = {C&G},
year = {1998},
month = {Mar},
volume = {22},
number = {2-3},
pages = {175-180},
doi = {https://doi.org/10.1016/S0097-8493(98)00004-1},
pdf = {papers/calcglos.pdf},
teaser = {teasers/calcglos.png},
abstract = {Photorealistic rendering is used to generate views of computer stored scenes. Global illumination algorithms take all transfers of light in the scene into account thereby creating a realistic looking image. Previously several approaches have been presented which are able to deal with global illumination for diffuse surfaces. More general surfaces are handled only by few methods.
This work presents a new algorithm for the generation of photorealistic images for scenes with arbitrary surfaces. Initially particle tracing and a reconstruction phase are used to obtain a good approximation to the directionally dependent illumination in the scene. The illumination information is stored and can be used subsequently to generate images from different viewpoints directly from the stored solution. The whole system is structured into several independent phases and is designed to allow parallel processing and incremental refinement.},
keywords = {rendering, global illumination},
}
@comment{c, c={unfortunate-dup, because conference proceedings later reclassified as journal volume by WSCG}}
@article{stuerzlinger1997optimized,
title = {Global Illumination with Glossy Surfaces},
author = {Stürzlinger, Wolfgang},
journal = {Journal of WSCG},
issn = {1213-6972},
year = {1997},
month = {Feb},
volume = {5},
number = {3},
pages = {543-551},
url = {http://wscg.zcu.cz/wscg1997/papers97/Stuerzlinger_97.pdf},
pdf = {papers/glossyill.pdf},
teaser = {teasers/glossyill.png},
abstract = {Photorealistic rendering is used to generate views of computer stored scenes. Global illumination algorithms take all transfers of light in the scene into account thereby creating a realistic looking image. Previously several approaches have been presented which are able to deal with global illumination for diffuse surfaces. More general surfaces are handled only by few methods.
This work presents a new algorithm for the generation of photorealistic images for scenes with arbitrary surfaces. Initially particle tracing and a reconstruction phase are used to obtain a good approximation to the directionally dependent illumination in the scene. The illumination information is stored and can be used subsequently to generate images from different viewpoints directly from the stored solution. The whole system is structured into several independent phases and is designed to allow parallel processing and incremental refinement.},
keywords = {rendering, global illumination},
note = {WSCG '97},
footnote = {Conference proceedings later republished as journal volume by publisher},
}
@article{schaufler_stuerzlinger1996three,
title = {Three Dimensional Image Cache for Virtual Reality},
author = {Schaufler*, Gernot and Stürzlinger, Wolfgang},
journal = {Computer Graphics Forum},
year = {1996},
month = {Aug},
volume = {15},
number = {3},
pages = {227-235},
doi = {https://doi.org/10.1111/1467-8659.1530227},
commented-url = {http://www.gup.uni-linz.ac.at:8001/staff/schaufler/papers/octimp},
pdf = {papers/octimp.pdf},
teaser = {teasers/octimp.png},
abstract = {Despite recent advances in rendering hardware, large and complex virtual environments cannot be displayed with a sufficiently high frame rate, because of limitations in the available rendering performance. This paper presents a new approach of software accelerated rendering which draws from the concepts of impostors, hierarchical scene subdivision and levels of detail. So far software optimization in real-time rendering has merely considered individual objects. This work is actually optimizing the rendering of the whole virtual environment by implementing a three dimensional image cache. It speeds up rendering for large portions of the scene by exploiting the coherence inherent in any smooth frame sequence. The implementation of the three dimensional image cache is discussed and the savings in rendering load achievable on a suitable hardware platform are presented.},
keywords = {rendering, real-time},
award = {This work received a Günther Enderle award for Best Technical Paper},
note = {Eurographics '96},
footnote = {A co-evolution with "Hierarchical image caching for accelerated walkthroughs of complex environments", https://doi.org/10.1145/237170.237209},
}
@comment{c, c={conference proceedings later reclassified as journal volume by publisher}}
@article{stuerzlinger1996optimized,
title = {Optimized Local Pass Using Importance Sampling},
author = {Stürzlinger, Wolfgang},
journal = {Journal of WSCG},
issn = {1213-6972},
year = {1996},
month = {Feb},
volume = {4},
number = {2},
pages = {342-349},
url = {http://wscg.zcu.cz/wscg1996/papers96/Stuerzlinger_96.pdf},
pdf = {papers/localpass.pdf},
teaser = {teasers/localpass.png},
abstract = {Recent approaches to realistic image synthesis split the rendering process into two passes. The first pass calculates an approximate global illumination solution, the second produces an image of high quality (from a user selected view point) using the solution obtained in the first pass by applying the local illumination model to each surface point visible through each pixel.
This paper presents two new methods to compute the local illumination quickly. Instead of recalculating form factors and visibilities the information computed by a hierarchical radiosity solution algorithm is reused. The image generation time is reduced significantly by using stochastic methods.},
keywords = {rendering, global illumination},
note = {WSCG '96},
footnote = {Conference proceedings later republished as journal volume by publisher},
}
@comment{c, c={conference proceedings later reclassified as journal volume by publisher}}
@article{stuerzlinger1994parallel,
title = {Parallel Progressive Radiosity with Parallel Visibility Computations},
author = {Stürzlinger, Wolfgang and Wild*, Christoph},
journal = {Journal of WSCG},
issn = {1213-6972},
year = {1994},
month = {Feb},
volume = {2},
number = {1},
pages = {66-74},
url = {http://wscg.zcu.cz/wscg1994/papers94/Stuerzlinger_Wild_94.pdf},
pdf = {papers/parrad.pdf},
teaser = {teasers/parrad.png},
abstract = {The radiosity method models the interaction of light between diffuse reflecting surfaces, thereby accurately predicting global illumination effects. Due to the high computational effort to calculate the transfer of light between surfaces and the memory requirements for the scene description, a distributed, parallelized version of the algorithm is needed for scenes consisting of thousands of surfaces. We present a distributed, parallel radiosity algorithm, which can subdivide the surfaces adaptively. Additionally we present a scheme for parallel visibility calculations. Adaptive load redistribution is also discussed.},
keywords = {rendering, global illumination, parallel, visibility},
note = {WSCG '94},
footnote = {Conference proceedings later republished as journal volume by publisher},
}
@comment{c, c={leave the "_stuerzlinger" in the ID to enable umlaut-free search!}}
@article{barth_stuerzlinger1993efficient,
title = {Efficient Ray Tracing for Bezier and B-Spline Surfaces},
author = {Barth, Wilhem and Stürzlinger, Wolfgang},
journal = {Computers & Graphics},
publisher = {Elsevier},
series = {C&G},
year = {1993},
month = {Jul},
volume = {17},
number = {4},
pages = {423-430},
doi = {https://doi.org/10.1016/0097-8493(93)90031-4},
pdf = {papers/rtbez.pdf},
teaser = {teasers/rtbez.png},
abstract = {Generating realistic pictures by raytracing requires intersecting the objects with many rays (1~ million or more). With Bezier or B-Spline surfaces as objects the intersections must be calculated by an iterative method. This paper describes an algorithm which performs these calculations efficiently. In a preprocessing step the surface is subdivided adaptively into parts and a tight enclosure is calculated for each part. We selected parallelepipeds (first order approximations) as enclosures, their orientation and the angles between their edges are chosen in such a way that they enclose the respective part as tightly as possible, they are not rectangular in general. A binary tree built with these enclosures allows to test very fast which parts of the surface may be hit by a given ray. The leaves of the tree contain small, almost plane parts of the surface. For each part a linear approximation is calculated, this is a parallelogram, in general not rectangular. For each ray which hits the enclosure the intersection with this approximation is calculated first, yielding an accurate starting point for the following iteration.},
keywords = {rendering, ray tracing},
}
@comment{************************articles_in_books************************}
@inbook{seetzen2023hdrdisplay,
title = {High Dynamic Range Display Systems},
author = {Seetzen*, Helge and Heidrich, Wolfgang and Stuerzlinger, Wolfgang and Ward, Greg and Whitehead, Lorne and Trentacoste*, Matthew and Ghosh*, Abhijeet and Vorozcovs*, Andrew},
booktitle = {Seminal Graphics Papers: Pushing the Boundaries},
publisher = {ACM},
year = {2023},
month = {Aug},
volume = {2},
articleno = {5},
numpages = {9},
edition = {1},
doi = {https://doi.org/10.1145/3596711.3596717},
pdf = {papers/hdrdisplays2.pdf},
teaser = {teasers/hdrdisplays.png},
abstract = {The dynamic range of many real-world environments exceeds the capabilities of current display technology by several orders of magnitude. In this paper we discuss the design of two different display systems that are capable of displaying images with a dynamic range much more similar to that encountered in the real world. The first display system is based on a combination of an LCD panel and a DLP projector, and can be built from off-the-shelf components. While this design is feasible in a lab setting, the second display system, which relies on a custom-built LED panel instead of the projector, is more suitable for usual office workspaces and commercial applications. We describe the design of both systems as well as the software issues that arise. We also discuss the advantages and disadvantages of the two designs and potential applications for both systems.},
keywords = {high dynamic range, display},
note = {Republished by ACM},
}
@inbook{batmaz2022rotposjitter,
title = {Rotational and Positional Jitter in Virtual Reality Interaction},
author = {Batmaz, Anil Ufuk and Stuerzlinger, Wolfgang},
booktitle = {Everyday Virtual Reality},
publisher = {Springer},
year = {2022},
month = {May},
pages = {89–118},
doi = {https://doi.org/10.1007/978-3-031-05804-2_4},
pdf = {papers/rotposjitter.pdf},
teaser = {teasers/rotposjitter.png},
abstract = {One of the elements that affect 3D tracking performance in Virtual Reality (VR) systems is fluctuations in the signal, called jitter, which occurs regardless of the sensor technology used. In real-life VR systems, positional and rotational jitter can be found in all tracked objects, including the headset, controllers, or other trackers. Previous work had identified that ±0.5° rotational jitter negatively affects user performance for distal pointing. Yet, they also found that even using a second controller to reduce the “Heisenberg effect” introduced by the button press does not address the problem completely. Moreover, with jitter on the position of a virtual object, user performance significantly decreases with jitter above one fourth of the size of that virtual object. Still, users preferred to have positional jitter on a virtual target rather than rotational jitter on a VR controller. In this paper, we extended the previous literature by conducting a user study on angular jitter with controllers held with two different grip styles and targets at two different depth distances. The results revealed that user performance decreases (already) with ±0.25° jitter. Thus, we suggest that practitioners/developers who design 3D user interfaces, controllers, and interaction techniques for daily 3D VR usage should focus on reducing jitter. Decreasing jitter not only improves user performance, but also decreases frustration, which improves the user experience.},
keywords = {3D pointing, mid-air, jitter},
}
@inbook{dwyer2018immersive,
title = {Immersive analytics: An Introduction},
author = {Dwyer, Tim and Marriott, Kim and Isenberg, Tobias and Klein, Karsten and Riche, Nathalie and Schreiber, Falk and Stuerzlinger, Wolfgang and Thomas, Bruce H.},
booktitle = {Immersive Analytics},
publisher = {Springer},
year = {2018},
month = {Oct},
volume = {LNCS 11190},
pages = {1-23},
doi = {https://doi.org/10.1007/978-3-030-01388-2_1},
pdf = {papers/IAchapter1_Intro.pdf},
teaser = {teasers/iabook.png},
abstract = {Immersive Analytics is a new research initiative that aims to remove barriers between people, their data and the tools they use for analysis and decision making. Here we clarify the aims of immersive analytics research, its opportunities and historical context, as well as providing a broad research agenda for the field. In addition, we review how the term immersion has been used to refer to both technological and psychological immersion, both of which are central to immersive analytics research.},
keywords = {immersive analytics, visualization, visual analytics},
}
@inbook{marriott2018immersive,
title = {Immersive Analytics: Time to Reconsider the Value of {3D} for Information Visualisation},
author = {Marriott, Kim and Chen, Jian and Hlawatsch, Marcel and Itoh, Takayuki and Nacenta, Miguel A. and Reina, Guido and Stuerzlinger, Wolfgang},
booktitle = {Immersive Analytics},
publisher = {Springer},
year = {2018},
month = {Oct},
volume = {LNCS 11190},
pages = {25-55},
doi = {https://doi.org/10.1007/978-3-030-01388-2_2},
pdf = {papers/IAchapter2_3DVis.pdf},
teaser = {teasers/iabook.png},
abstract = {Modern virtual reality display technologies engender spatial immersion by using a variety of depth cues such as perspective and head-tracked binocular presentation to create visually realistic 3D worlds. While 3D visualisations are common in scientific visualisation, they are much less common in information visualisation. In this chapter we explore whether immersive analytic applications should continue to use traditional 2D information visualisations or whether there are situations when 3D may offer benefits. We identify a number of potential applications of 3D depth cues for abstract data visualisation: using depth to show an additional data dimension, such as in 2.5D network layouts, views on non-flat surfaces and egocentric views in which the data is placed around the viewer, and visualising abstract data with a spatial embedding. Another important potential benefit is the ability to arrange multiple views in the 3D space around the user and to attach abstract visualisations to objects in the real world.},
keywords = {immersive analytics, visual analytics, 3D visualization},
}
@inbook{bueschel2018interaction,
title = {Interaction for Immersive Analytics},
author = {Büschel, Wolfgang and Chen, Jian and Dachselt, Raimund and Drucker, Steven and Dwyer, Tim and Görg, Carsten and Isenberg, Tobias and Kerren, Andreas and North, Chris and Stuerzlinger, Wolfgang},
booktitle = {Immersive Analytics},
publisher = {Springer},
year = {2018},
month = {Oct},
volume = {LNCS 11190},
pages = {95-138},
doi = {https://doi.org/10.1007/978-3-030-01388-2_4},
pdf = {papers/IAchapter4_Interaction.pdf},
teaser = {teasers/iabook.png},
abstract = {In this chapter, we briefly review the development of natural user interfaces and discuss their role in providing human-computer interaction that is immersive in various ways. Then we examine some opportunities for how these technologies might be used to better support data analysis tasks. Specifically, we review and suggest some interaction design guidelines for immersive analytics. We also review some hardware setups for data visualization that are already archetypal. Finally, we look at some emerging system designs that suggest future directions.},
keywords = {immersive analytics, visualization, visual analytics},
}
@inbook{stuerzlinger2018immersive,
title = {Immersive human-centered computational analytics},
author = {Stuerzlinger, Wolfgang and Dwyer, Tim and Drucker, Steven and Görg, Carsten and North, Chris and Scheuermann, Gerik},
booktitle = {Immersive Analytics},
publisher = {Springer},
year = {2018},
month = {Oct},
volume = {LNCS 11190},
pages = {139-163},
doi = {https://doi.org/10.1007/978-3-030-01388-2_5},
pdf = {papers/IAchapter5_humancentered.pdf},
teaser = {teasers/iabook.png},
abstract = {In this chapter we seek to elevate the role of the human in human-machine cooperative analysis through a careful consideration of immersive design principles. We consider both strategic immersion through more accessible systems as well as enhanced understanding and control through immersive interfaces that enable rapid workflows. We extend the classic sensemaking loop from visual analytics to incorporate multiple views, scenarios, people, and computational agents. We consider both sides of machine/human collaboration: allowing the human to more fluidly control the machine process; and also allowing the human to understand the results, derive insights and continue the analytic cycle. We also consider system and algorithmic implications of enabling real-time control and feedback in immersive human-centered computational analytics.},
keywords = {immersive analytics, visualization, visual analytics, collaboration},
}
@inbook{marriott2018just,
title = {Just 5 Questions: Toward a Design Framework for Immersive Analytics},
author = {Marriott, Kim and Chen, Jian and Hlawatsch, Marcel and Itoh, Takayuki and Nacenta, Miguel A. and Reina, Guido and Stuerzlinger, Wolfgang},
booktitle = {Immersive Analytics},
publisher = {Springer},
year = {2018},
month = {Oct},
volume = {LNCS 11190},
pages = {259-288},
doi = {https://doi.org/10.1007/978-3-030-01388-2_9},
pdf = {papers/IAchapter9_5Questions.pdf},
teaser = {teasers/iabook.png},
abstract = {We present an initial design framework for immersive analytics based on Brehmer and Munzner's "What-Why-How" data visualisation framework. We extend their framework to take into account Who are the people or teams of people who are going to use the system, and Where is the system to be used and what are the available devices and technology. In addition, the How component is extended to cater for collaboration, multisensory presentation, interaction with an underlying computational model, degree of fidelity and organisation of the workspace around the user. By doing so we provide a framework for understanding immersive analytics research and applications as well as clarifying how immersive analytics differs from traditional data visualisation and visual analytics.},
keywords = {immersive analytics, visualization, visual analytics},
}
@inbook{stuerzlinger2014considerations,
title = {Considerations for Targets in {3D} Pointing Experiments},
author = {Stuerzlinger, Wolfgang and Teather*, Robert J.},
booktitle = {{HCI} Korea},
series = {HCIK '15},
year = {2014},
commented-year = {2015},
month = {Dec},
commented-month = {Jan},
pages = {162–168},
url = {https://dl.acm.org/doi/abs/10.5555/2729485.2729510},
pdf = {papers/considerations.pdf},
teaser = {teasers/considerations.png},
abstract = {We identify various tradeoffs in the design of 3D pointing experiments based on Fitts' law and the ISO9241-9 methodology. The advantages and disadvantages of several approaches for such experiments are analyzed and compared against each other. Results of an experiment that investigates various visual aids are presented as evidence. We conclude with recommendations for 3D pointing experiments and avenues of future work.},
keywords = {3D pointing},
}
@inbook{stuerzlinger2011value,
title = {The Value of Constraints for {3D} User Interfaces},
author = {Stuerzlinger, Wolfgang and Wingrave*, Chad},
booktitle = {Virtual Realities},
publisher = {Springer},
year = {2011},
month = {Jan},
pages = {203-224},
doi = {https://doi.org/10.1007/978-3-211-99178-7_11},
pdf = {papers/valueconstraints.pdf},
abstract = {User interfaces to three-dimensional environments are becoming more and more popular. Today this trend is fuelled through the introduction of social communication via virtual worlds, console and computer games, as well as 3D televisions.
We present a synopsis of the relevant abilities and restrictions introduced by both input and output technologies, as well as an overview of related human capabilities and limitations, including perceptual and cognitive issues. Partially based on this, we present a set of guidelines for 3D user interfaces. These guidelines are intended for developers of interactive 3D systems, such as computer and console games, 3D modeling packages, augmented reality systems, computer aided design systems, and virtual environments. The guidelines promote techniques, such as using appropriate constraints, that have been shown to work well in these types of environments.},
keywords = {3D user interfaces, constraints},
}
@comment{************************conference_articles************************}
@inproceedings{gemici2026crossingrealities,
title = {Crossing Realities Has a Cost: Evaluating AR Second Screens for AI-Assisted Desktop Authoring},
author = {Gemici*, Mucahit and Bashar*, Mohammad Raihanul and Stuerzlinger, Wolfgang and Phadnis, Vrushank and Batmaz, Anil Ufuk},
booktitle = {Symposium on Spatial User Interaction},
publisher = {ACM},
series = {SUI '26},
year = {2026},
month = {Oct},
commented-articleno = {2},
numpages = {12},
commented-doi = {https://doi.org/10.1145/00000.00000},
commented-pdf = {papers/crossingrealities.pdf},
commented-teaser = {teasers/crossingrealities.png},
abstract = {AI-assisted authoring requires users to frequently exchange user-generated and AI-generated content between a primary workspace and a Large Language Model (LLM) assistant. Such repetitive actions can fragment attention and compete for limited display space. While Augmented Reality (AR) has been proposed as a way to extend desktop workspaces with virtual displays, just adding a spatial display area does not address the repeated attention shifts, input-focus changes, and content-transfer steps required in LLM-assisted workflows. This creates a gap in understanding whether AR second screens support such workflows or introduce cross-reality transition costs that limit their effectiveness. To investigate this gap, we designed an AR-Second-Screen system around a unified keyboard-and-mouse interaction model and evaluated it against Single-Screen and Dual-Screen desktop setups. Results show that Dual-Screen remained more efficient than AR-Second-Screen, with significantly lower task completion time and switching cost. AR-Second-Screen also produced higher task and LLM idle ratios, indicating re-engagement costs when users crossed between physical and virtual workspaces. At the same time, participants rated AR positively and preferred it significantly over Single-Screen, with no significant difference in preference compared to Dual-Screen. These findings show that spatially extending AI-assisted workflows into AR can be appealing, yet effective cross-reality interfaces must minimize transition costs rather than just simply adding a virtual display space.},
keywords = {extended reality, LLM, crossing realities},
note = {Conditionally accepted, to appear},
}
@inproceedings{noh2026drattention,
title = {Exploring Diminished Reality for Attention Support: A Co-Design Study with Students with ADHD},
author = {Noh+, Alex and Safikhani+, Audrey and Zhu*, Anjun and Stuerzlinger, Wolfgang and Kim, Lawrence},
booktitle = {Designing Interactive Systems},
publisher = {ACM},
series = {DIS '26},
year = {2026},
month = {Jun},
pages = {891-903},
doi = {https://doi.org/10.1145/3800645.3813095},
pdf = {papers/drattention.pdf},
commented-video = {videos/drattention.mp4},
teaser = {teasers/drattention.png},
abstract = {Diminished Reality (DR) modifies or removes elements of the perceived environment. We explored DR for attention support through diary studies, interviews, and speculative co-design with 15 university students with ADHD. Participants described a persistent gap between intention and attention, and the use of externalization strategies that encounter fundamental limits in physical reality. In co-design, rather than reasoning from visual operations, participants articulated which properties of stimuli they needed to perceive versus filter, revealing cases where visual diminishment does not reliably map to attentional diminishment. We contribute rich descriptive data on the attentional challenges and DR preferences of students with ADHD, and propose Attentional Diminishment, a sensitizing concept that reframes DR for attention support from visual outcomes to attentional effects.},
keywords = {diminished reality, filtered reality, adhd, attention deficit hyperactivity disorder},
}
@inproceedings{amini2026steeringthroughput3d,
title = {Improving Steering Law Throughput Calculation by Defining Effective Parameters in 3D Virtual Environments},
author = {Amini*, Mohammadreza and Stuerzlinger, Wolfgang and Yamanaka, Shota and Liang, Hai-Ning and Batmaz, Anil Ufuk},
booktitle = {Conference on Human Factors in Computing Systems},
publisher = {ACM},
series = {CHI '26},
year = {2026},
month = {Apr},
articleno = {1141},
numpages = {20},
doi = {https://doi.org/10.1145/3772318.3790579},
pdf = {papers/steeringthroughput3d.pdf},
video = {videos/steeringthroughput3d.mp4},
teaser = {teasers/steeringthroughput3d.png},
abstract = {Throughput is a widely used performance metric, combining speed and accuracy into a single measure, while reducing the effect of subjective speed–accuracy trade-offs. Despite its wide application in 2D steering tasks, its direct extension to 3D presents unique challenges since 3D trajectories exhibit higher variability, and perceptual–motor factors undermine existing formulations. Consequently, throughput has not been systematically adopted for evaluating steering in 3D virtual environments. In this paper, using a controlled virtual reality user study with a ring-and-wire task, we introduce and validate a novel throughput formulation for 3D steering based on the bivariate standard deviation of the trajectory for the effective width calculation. Our results show that this formulation provides smoother throughput values across subjective speed–accuracy differences and improves model fit compared to traditional approaches. This work advances our theoretical understanding of the Steering law in 3D contexts, provides researchers and practitioners with a robust evaluation method, and establishes a foundation for future studies of complex 3D trajectory interactions.},
keywords = {3D steering, 3D user interface, 3D interaction, trajectory-based interaction, behavior modeling},
}
@inproceedings{turkmen2026handvis,
title = {Investigating Adaptive Hand Visibilities for Accurate 3D User Interactions in Augmented Reality},
author = {Turkmen*, Rumeysa and Hatira*, Nour and Teather, Robert J and Kersten-Oertel, Marta and Stuerzlinger, Wolfgang and Batmaz, Anil Ufuk},
booktitle = {Conference on Virtual Reality and {3D} User Interfaces Abstracts and Workshops, Workshop on Novel Input Devices and Interaction Techniques at {VR}},
publisher = {IEEE},
series = {NIDIT '26},
year = {2026},
month = {Mar},
pages = {338-343},
doi = {https://doi.org/10.1109/VRW70859.2026.00067},
pdf = {papers/handvis.pdf},
teaser = {teasers/handvis.png},
commented-video = {videos/handvis.mp4},
abstract = {Augmented Reality (AR) tasks that require fine motor control often rely on visual hand representations, yet fully visible hands can introduce occlusion and reduce accuracy. In this work, we investigate adaptive hand visualization techniques that dynamically adjust hand visibility based on the current interaction phase to improve accuracy in AR. We designed an AR-based pedicle screw placement task, in which users insert virtual screws into a physical spine model. To evaluate how hand visualization affects task performance, we conducted a user study with 15 participants who performed the task under five hand visualization conditions: Opaque, Transparent, Invisible, Speed-based and Position-based visibility. Our results show that adaptive visualization techniques significantly improve screw placement accuracy compared to the commonly used opaque hand representation. These findings demonstrate the benefits of dynamically adapting hand visibility can support accuracy-critical interactions.},
keywords = {hand visibility, 3D docking},
}
@inproceedings{zhao2026hybridsthfp,
title = {A User-Friendly Accurate Bare-Handed Manipulation Technique for Distant Objects in Virtual Reality},
author = {Zhao*, Di Bill and Stuerzlinger, Wolfgang},
booktitle = {Conference on Virtual Reality and {3D} User Interfaces Abstracts and Workshops, Workshop on Novel Input Devices and Interaction Techniques at {VR}},
publisher = {IEEE},
series = {NIDIT '26},
year = {2026},
month = {Mar},
pages = {373-378},
doi = {https://doi.org/10.1109/VRW70859.2026.00073},
pdf = {papers/hybridsthfp.pdf},
teaser = {teasers/hybridsthfp.png},
video = {videos/hybridsthfp.mp4},
abstract = {Bare-hand interaction is now common in virtual reality, but does not afford accurate manipulation of distant objects. Prior approaches rely on ray-casting, motion scaling, proxies, or near-field widgets, often trading precision for speed or increasing cognitive and physical demand. We present two bare-hand techniques for distant object manipulation: Scaled Two-Hand Finger-Palm (STHFP), which uses the non-dominant hand as a control surface for precise manipulation, and HYBRID, which combines fast ray-based positioning with two-handed refinement.
Results from our user study comparing STHFP and HYBRID against scaled bare-hand HOMER show that both new techniques significantly improve positional and rotational accuracy while reducing physical workload. While STHFP requires more interaction time, HYBRID achieves a balanced trade-off between speed and precision. Qualitative findings further reveal how constraint-based control and staged workflows shape user strategies and perceived effort. Together, our results demonstrate that leveraging the hand as a control surface can enable accurate, usable, and controller-free manipulation of distant objects in VR.},
keywords = {hand interaction, bare-hand, 3D manipulation, 3D positioning, 3D rotation, 3D pose},
}
@inproceedings{liu2026scaledmouse,
title = {Scaled Mouse: An Efficient and Accurate Interaction Technique for 3D Docking in Seated VR},
author = {Liu*, Xinpeng and Zhao*, Di Bill and Stuerzlinger, Wolfgang},
booktitle = {Conference on Virtual Reality and {3D} User Interfaces},
publisher = {IEEE},
series = {VR '26},
year = {2026},
month = {Mar},
pages = {718-728},
doi = {https://doi.org/10.1109/VR67842.2026.00091},
pdf = {papers/scaledmouse.pdf},
video = {videos/scaledmouse.mp4},
teaser = {teasers/scaledmouse.png},
abstract = {This paper presents an empirical evaluation of mouse-based interaction in seated Virtual Reality (VR) scenarios as an alternative to traditional VR controllers. We introduce Scaled Mouse, an interaction technique that shows the position of the real mouse in VR and maps standard mouse actions to 3D object manipulation using velocity-based scaling. We present two user studies assessing this method. In the first study, we compared a VR controller against our mouse-based method for manipulation tasks. Results show that the mouse consistently achieved higher rotation accuracy in 3D rotation and docking tasks than the controller, while maintaining comparable task completion times. Building on prior scaled interaction techniques, our second study investigated mouse interaction in a productivity-oriented scenario where users could combine 3D manipulation with a 2D adjustment panel. Scaled Mouse interaction was significantly faster and more accurate than the controller for 3D docking tasks and was rated significantly higher in usability and workload measures. Together, these findings establish the mouse as a viable and effective input device for seated VR contexts, offering both familiarity and accuracy advantages over controllers, particularly for professional and productivity-focused applications.},
keywords = {3D pointing, 3D selection, 3D manipulation},
}
@inproceedings{amini2025tunnelsvswires,
title = {Tunnels vs. Wires: A Comparative Analysis of Two 3D Steering Tasks in Virtual Environments},
author = {Amini*, Mohammadreza and Stuerzlinger, Wolfgang and Yamanaka, Shota and Liang, Hai-Ning and Batmaz, Anil Ufuk},
booktitle = {31st Symposium on Virtual Reality Software and Technology},
publisher = {ACM},
series = {VRST '25},
year = {2025},
month = {Nov},
articleno = {15},
numpages = {11},
doi = {https://doi.org/10.1145/3756884.3766023},
pdf = {papers/tunnelsvswires.pdf},
video = {videos/tunnelsvswires.mp4},
teaser = {teasers/tunnelsvswires.png},
abstract = {Steering involves continuous movement along constrained paths, well-studied in 2D. The extensions to 3D using the Ring-and-Wire and Ball-and-Tunnel tasks were often treated as interchangeable in previous work. In this paper, we directly compare these two tasks through a within-subjects user study (n = 18) with varying 3D path orientations. The results show that Ring-and-Wire significantly outperformed Ball-and-Tunnel, with 17.17% lower task time, 21.65% higher throughput, and 21.52% faster average speed. Participants also preferred Ring-and-Wire and reported lower workload. Visual ambiguity, especially near the tunnel's rear surface, complicated spatial perception in the Ball-and-Tunnel task. We thus recommend that future studies choose 3D steering tasks carefully for experiments, as the two tasks are not interchangeable.},
keywords = {3D steering},
award = {This work was nominated for a Best Paper Award},
}
@inproceedings{panda2025evaluatingdyndash,
title = {Evaluating the Utility of Multiple Workspaces and Easy Chart Creation for Visual Analytics},
author = {Panda, Swaroop and Stuerzlinger, Wolfgang},
booktitle = {Human-Computer Interaction},
commented-publisher = {Springer},
series = {HCI International '25},
year = {2025},
month = {May},
volume = {LNCS 15766},
pages = {103-122},
doi = {https://doi.org/10.1007/978-3-031-93835-1_7},
pdf = {papers/evaluatingdyndash.pdf},
teaser = {teasers/evaluatingdyndash.png},
abstract = {Visual Analytics involves interactive visual exploration of data sets. Interaction methods allow data analysts to explore different aspects and investigate various hypotheses. This work investigates if chart creation and multiple tabs enable analysts to pursue multiple hypotheses or analysis paths better than other approaches. To evaluate this, new features were added to an existing Visual Analytics prototype with a multi-tab design. Two user studies with professional data analysts confirmed the utility of our approach within the Visual Analytics process. Analysts can easily work within multiple workspaces, enabling them to frame and track multiple hypotheses about the data and pursue different exploratory analysis paths, ultimately yielding more comprehensive analysis outcomes.},
keywords = {visual analytics},
}
@inproceedings{le2025redirectedstepper,
title = {RedirectedStepper: Exploring Walking-In-Place Locomotion in VR Using a Mini Stepper for Ascents},
author = {Le*, Quang-Tri and Nham*, Huynh-Duc and Tran, Tanh Quang and Fjeld, Morten and Stuerzlinger, Wolfgang and Zank, Markus and Tran, Minh-Triet and Le, Khanh-Duy},
booktitle = {Conference on Human Factors in Computing Systems},
publisher = {ACM},
series = {CHI '25},
year = {2025},
month = {Apr},
articleno = {614},
numpages = {17},
doi = {https://doi.org/10.1145/3706598.3713313},
pdf = {papers/redirectedstepper.pdf},
video = {videos/redirectedstepper.mp4},
teaser = {teasers/redirectedstepper.png},
abstract = {Walking on inclined surfaces is common in some Virtual Reality (VR) scenarios, for instance when moving between floors of a building, climbing a tower, or ascending a virtual mountain. Existing approaches enabling realistic walking experiences in such settings typically require the user to use bulky walking-in-place hardware or to walk in a physical area. Addressing this challenge, we present RedirectedStepper, a locomotion technique leveraging a novel device based on a mini exercise stepper to provide realistic VR staircase walking experiences by alternating the tilt of the two stepper pedals. RedirectedStepper employs a new exponential mapping function to visually morph the user’s real foot motion to a corresponding curved path in the virtual environment (VE). Combining this stepper and the visual mapping function provides an in-place locomotion technique allowing users to virtually ascend an infinite staircase or slope while walking-in-place (WIP). We conducted three within-subject user studies (n=36) comparing RedirectedStepper with a WIP locomotion technique using the Kinect. Our studies indicate that RedirectedStepper improves the users’ sense of realism in walking on staircases in VR. Based on a set of design implications derived from the user studies, we developed SnowRun, a VR exergame application, demonstrating the use of the RedirectedStepper concept.},
keywords = {locomotion, 3d navigation},
}
@inproceedings{amini2025review3dfitts,
title = {A Systematic Review of Fitts' Law in 3D Extended Reality},
author = {Amini*, Mohammadreza and Stuerzlinger, Wolfgang and Teather, Robert J and Batmaz, Anil Ufuk},
booktitle = {Conference on Human Factors in Computing Systems},
publisher = {ACM},
series = {CHI '25},
year = {2025},
month = {Apr},
articleno = {625},
numpages = {25},
doi = {https://doi.org/10.1145/3706598.3713623},
pdf = {papers/review3dfitts.pdf},
teaser = {teasers/review3dfitts.png},
abstract = {Fitts' law is widely used as an evaluation tool for pointing or selection tasks, evolving into diverse applications, including 3D extended reality (XR) environments like virtual, augmented, and mixed reality. Despite standards like ISO 9241:411, the application of Fitts' law varies significantly across studies, complicating comparisons and undermining the reliability of findings in 3D XR research. To address this, we conducted a systematic review of 1957 papers, focusing on 122 studies that used Fitts' law in 3D XR user experiments. Our analysis shows that over half of these studies referenced Fitts' law without thoroughly investigating throughput, movement time, or error rate. We performed an in-depth meta-analysis to examine how Fitts' law is incorporated into research. By highlighting trends and inconsistencies, and making recommendations this review aims to guide researchers in designing and performing more effective and consistent Fitts-based studies in 3D XR, enhancing the quality and impact of future research.},
keywords = {3d pointing, 3d selection},
}
@inproceedings{srabonee2025hexacotext,
title = {Exploring the Impacts of HEXACO Personality Traits on Text Composition and Transcription},
author = {Srabonee*, Jannatul Ferdous and Alharbi, Ohoud and Stuerzlinger, Wolfgang and Arif, Ahmed Sabbir},
booktitle = {Conference on Human Factors in Computing Systems},
publisher = {ACM},
series = {CHI '25},
year = {2025},
month = {Apr},
articleno = {577},
numpages = {24},
doi = {https://doi.org/10.1145/3706598.3714149},
pdf = {papers/hexacotext.pdf},
teaser = {teasers/hexacotext.png},
abstract = {This study investigates the relationship between the HEXACO personality traits and text entry behaviors in composition and transcription tasks. By analyzing metrics such as entry speed, accuracy, editing efforts, and readability, we identified correlations between specific traits and text entry performance. In composition, honesty-humility and agreeableness were the strongest predictors, correlating significantly with composition time, text length, and editing efforts. In transcription, openness, honesty-humility, and agreeableness influenced performance, though no single trait consistently predicted all metrics. Interestingly, extraversion did not show strong correlations in either task, despite its established link to composition performance in academic contexts. These findings suggest that personality traits affect text entry behavior differently depending on the task, with creative tasks like composition being shaped by distinct traits compared to repetitive tasks like transcription. This research provides valuable insights into the relationship between personality and text entry, opening avenues for personalizing interaction systems based on individual traits.},
keywords = {text entry, personality, text composition, transcription},
}
@inproceedings{mutasim2025gazemtd,
title = {There Is More to Dwell Than Meets the Eye: Toward Better Gaze-Based Text Entry Systems With Multi-Threshold Dwell},
author = {Mutasim*, Aunnoy K and Bashar*, Mohammad Raihanul and Lutteroth, Christof and Batmaz, Anil Ufuk and Stuerzlinger, Wolfgang},
booktitle = {Conference on Human Factors in Computing Systems},
publisher = {ACM},
series = {CHI '25},
year = {2025},
month = {Apr},
articleno = {1088},
numpages = {18},
doi = {https://doi.org/10.1145/3706598.3713781},
pdf = {papers/gazemtd.pdf},
video = {videos/gazemtd.mp4},
teaser = {teasers/gazemtd.png},
abstract = {Dwell-based text entry seems to peak at 20 words per minute (WPM). Yet, little is known about the factors contributing to this limit, except that it requires extensive training. Thus, we conducted a longitudinal study, broke the overall dwell-based selection time into six different components, and identified several design challenges and opportunities. Subsequently, we designed two novel dwell keyboards that use multiple yet much shorter dwell thresholds: Dual-Threshold Dwell (DTD) and Multi-Threshold Dwell (MTD). The performance analysis showed that MTD (18.3 WPM) outperformed both DTD (15.3 WPM) and the conventional Constant-Threshold Dwell (12.9 WPM). Notably, absolute novices achieved these speeds within just 30 phrases. Moreover, MTD’s performance is also the fastest-ever reported average text entry speed for gaze-based keyboards. Finally, we discuss how our chosen parameters can be further optimized to pave the way toward more efficient dwell-based text entry.},
keywords = {gaze, eye tracking, text entry},
}
@inproceedings{zhao2025thfp,
title = {A Novel Bare-Handed Manipulation Technique for Distant Objects in Virtual Reality},
author = {Zhao*, Di Bill and Stuerzlinger, Wolfgang},
booktitle = {Conference on Virtual Reality and {3D} User Interfaces Abstracts and Workshops, Workshop on Novel Input Devices and Interaction Techniques at {VR}},
publisher = {IEEE},
series = {NIDIT '25},
year = {2025},
month = {Mar},
pages = {353-360},
doi = {https://doi.org/10.1109/VRW66409.2025.00083},
pdf = {papers/thfp.pdf},
teaser = {teasers/thfp.png},
video = {videos/thfp.mp4},
abstract = {Advancements in bare-hand tracking technology, featured in many modern virtual reality (VR) headsets, have enabled intuitive hand interaction for proximate 3D object manipulation. However, manipulating distant 3D objects in VR with bare hands remains a challenge, and our work explores the potential of two-handed interaction in this context. Previous work highlighted the ease of using the non-dominant wrist as an interactive surface for interaction, by pointing at it with the dominant hand's index finger. Our research expands this paradigm by extending the interactive zone to the entire non-dominant hand so that the user can interact with their index finger on the non-dominant hand’s fingers and palm to adeptly and precisely manipulate a distant 3D object's position and rotation. Through a user study, we compared our Two-Hand Fingertip-Palm technique (THFP) with a bare-hand variant of HOMER (BHOMER) on efficiency, accuracy, and usability. The results demonstrate a notable accuracy improvement (at least 75% better), especially in complex tasks, such as hanging a painting on a slanted wall, albeit at the expense of efficiency (about 47% slower) compared to BHOMER. While BHOMER is faster, it also exhibits more variation in time, and at the average BHOMER end time, our new technique is still substantially more accurate than BHOMER. Further, our method received a more favorable rating on the System Usability Scale (SUS), underscoring our approach's user-centric and intuitive design. Further, the NASA Task Load Index (NASA-TLX) indicates that THFP not only improves the task completion rate and user satisfaction but also reduces the cognitive, physical, and temporal demand for users. In addition, we discuss insights into the integration of constraints, error prevention, and the facilitation of consistent interaction. Our findings lay a solid foundation for using our new method in the quickly advancing VR field.},
keywords = {hand interaction, bare-hand, 3D manipulation, 3D positioning, 3D rotation, 3D pose},
}
@inproceedings{xu2025predictingray,
title = {Predicting Ray Pointer Landing Poses in VR Using Multimodal LSTM-Based Neural Networks},
author = {Xu*, Wenxuan and Wei*, Yushi and Hu*, Xuning and Stuerzlinger, Wolfgang and Wang, Yuntao and Liang, Hai-Ning},
booktitle = {Conference on Virtual Reality and {3D} User Interfaces},
publisher = {IEEE},
series = {VR '25},
year = {2025},
month = {Mar},
pages = {93-103},
doi = {https://doi.org/10.1109/VR59515.2025.00034},
pdf = {papers/predictingray.pdf},
teaser = {teasers/predictingray.png},
abstract = {Target selection is one of the most fundamental tasks in VR interaction systems. Prediction heuristics can provide users with a smoother interaction experience in this process. Our work aims to predict the ray landing pose for hand-based raycasting selection in Virtual Reality (VR) using a Long Short-Term Memory (LSTM)-based neural network with time-series data input of speed and distance over time from three different pose channels: hand, Head-Mounted Display (HMD), and eye. We first conducted a study to collect motion data from these three input channels and analyzed these movement behaviors. Additionally, we evaluated which combination of input modalities yields the optimal result. A second study validates raycasting across a continuous range of distances, angles, and target sizes. On average, our technique's predictions were within 4.6° of the true landing pose when 50% of the way through the movement. We compared our LSTM neural network model to a kinematic information model and further validated its generalizability in two ways: by training the model on one user's data and testing on other users (cross-user) and by training on a group of users and testing on entirely new users (unseen users). Compared to the baseline and a previous kinematic method, our model increased prediction accuracy by a factor of 3.5 and 1.9, respectively, when 40% of the way through the movement.},
keywords = {3D pointing, 3D selection, ray pointing},
}
@inproceedings{gemici2024speedcontrol,
title = {Object Speed Control Based on Signed Distance Field for Mid-Air Object Manipulation in Virtual Reality},
author = {Gemici*, Mucahit and Stuerzlinger, Wolfgang and Batmaz, Anil Ufuk},
booktitle = {International Symposium on Mixed and Augmented Reality},
publisher = {IEEE},
series = {ISMAR '24},
year = {2024},
month = {Oct},
pages = {465-474},
doi = {https://doi.org/10.1109/ISMAR62088.2024.00061},
pdf = {papers/speedcontrol.pdf},
video = {videos/speedcontrol.mp4},
teaser = {teasers/speedcontrol.png},
abstract = {In Virtual Reality (VR) applications, interacting with distant objects relies heavily on mid-air object manipulation. However, the inherent distance between the user and the object often restricts precise movement capabilities. This paper introduces the Signed Distance Field (SDF) algorithm as a method for mid-air object manipulation, and combines it with the ray casting interaction technique to investigate its effect on user performance and user experience. To increase the accuracy of the movements, we leverage the speed-accuracy trade-off to dynamically adjust object manipulation speed based on the SDF algorithm's output. Our study, involving 18 participants, examines the effects of SDF across three different tasks with different complexities. Our results showed that ray casting with SDF reduces the number of errors in complex tasks without slowing down the participants. Further, our proposed method significantly improved the user experience for complex tasks. We hope that our proposed assistive system, designed for tasks and applications, can be used as an interaction technique to enable more accurate manipulation of distant objects in the fields like surgical planning, architecture, and games.},
keywords = {3D manipulation, 3D posing, wire task},
}
@inproceedings{jiang2024flexdoc,
title = {FlexDoc: Flexible Document Adaptation through Optimizing both Content and Layout},
author = {Jiang*, Yue and Lutteroth, Christof and Jain, Rajiv and Tensmeyer, Christopher and Manjunatha, Varun and Stuerzlinger, Wolfgang and Morariu, Vlad},
booktitle = {Symposium on Visual Languages and Human-Centric Computing},
publisher = {IEEE},
series = {VL/HCC '24},
year = {2024},
month = {Sep},
pages={217-222},
doi = {https://doi.org/10.1109/VL/HCC60511.2024.00032},
pdf = {papers/flexdoc.pdf},
video = {videos/flexdoc.mp4},
teaser = {teasers/flexdoc.png},
abstract = {Designing adaptive documents that are visually appealing across various devices and for diverse viewers is a challenging task. This is due to the wide variety of devices and different viewer requirements and preferences. Alterations to a document’s content, style, or layout often necessitate numerous adjustments, potentially leading to a complete layout redesign. We introduce FLEXDOC, a framework for creating and consuming documents that seamlessly adapt to different devices, author, and viewer preferences and interactions. It eliminates the need for manually creating multiple document layouts, as FLEXDOC enables authors to define desired document properties using templates and employs both discrete and continuous optimization in a novel comprehensive optimization process, which leverages automatic text summarization and image carving techniques to adapt both layout and content during consumption dynamically. Further, we demonstrate FLEXDOC in real-world scenarios.},
keywords = {document layout, flexible documents, adaptive documents, responsive documents},
}
@inproceedings{kasahara2024steeringthroughput,
title = {Better Definition and Calculation of Throughput and Effective Parameters for Steering to Account for Subjective Speed-accuracy Tradeoffs},
author = {Kasahara*, Nobuhito and Oba*, Yosuke and Yamanaka, Shota and Batmaz, Anil Ufuk and Stuerzlinger, Wolfgang and Miyashita, Homei},
booktitle = {Conference on Human Factors in Computing Systems},
publisher = {ACM},
series = {CHI '24},
year = {2024},
month = {May},
articleno = {722},
pages = {1-18},
doi = {https://doi.org/10.1145/3613904.3642084},
pdf = {papers/steeringthroughput.pdf},
video = {videos/steeringthroughput.mp4},
teaser = {teasers/steeringthroughput.png},
abstract = {In Fitts' law studies to investigate pointing, throughput is used to characterize the performance of input devices and users, which is claimed to be independent of task difficulty or the user's subjective speed-accuracy bias.
While throughput has been recognized as a useful metric for target-pointing tasks, the corresponding formulation for path-steering tasks and its evaluation have not been thoroughly examined in the past. In this paper, we conducted three experiments using linear, circular, and sine-wave path shapes to propose and investigate a novel formulation for the effective parameters and the throughput of steering tasks. Our results show that the effective width substantially improves the fit to data with mixed speed-accuracy biases for all task shapes. Effective width also smoothed out the throughput across all biases, while the usefulness of the effective amplitude depended on the task shape. Our study thus advances the understanding of user performance in trajectory-based tasks.},
keywords = {steering, throughput},
}
@inproceedings{dash2024me911,
title = {Multimedia-Enabled 911: Exploring 911 Callers’ Experience of Call Taker Controlled Video Calling in Simulated Emergencies},
author = {Dash*, Punyashlok and Axtell, Benett and Geiskkovitch, Denise Y. and Neustaedter, Carman and Stuerzlinger, Wolfgang},
booktitle = {Conference on Human Factors in Computing Systems},
publisher = {ACM},
series = {CHI '24},
year = {2024},
month = {May},
articleno = {500},
pages = {1-15},
doi = {https://doi.org/10.1145/3613904.3643055},
pdf = {papers/me911.pdf},
video = {videos/me911.mp4},
teaser = {teasers/me911.png},
abstract = {Emergency response to large-scale disasters is often supported with multimedia from social media. However, while these features are common in everyday video calls, the complex needs of 911 and other systems make it difficult to directly incorporate these features. We assess an ME911 (Multimedia-Enabled 911) app to understand how the design will need to deviate from common norms and how callers will respond to those non-standard choices. We expand the role of 911 call taker control over emergency situations to the calling interface while incorporating key features like map-based location finding. Participants’ experiences in mock emergencies show the non-standard design helps callers in the unfamiliar setting of emergency calling yet it also causes confusion and delays. We find the need for emergency-specific deviations from design norms is supported by participant feedback. We discuss how broader system changes will support callers to use these non-standard designs during emergencies.},
keywords = {emergency, 911, video calling, teleconference, V4Space},
}
@inproceedings{yamanaka2024latencysteering,
title = {The Effect of Latency on Movement Time in Path-steering},
author = {Yamanaka, Shota and Stuerzlinger, Wolfgang},
booktitle = {Conference on Human Factors in Computing Systems},
publisher = {ACM},
series = {CHI '24},
year = {2024},
month = {May},
articleno = {622},
pages = {1-19},
doi = {https://doi.org/10.1145/3613904.3642316},
pdf = {papers/latencysteering.pdf},
video = {videos/latencysteering_application.mp4},
teaser = {teasers/latencysteering.png},
abstract = {In current graphical user interfaces, there exists a (typically unavoidable) end-to-end latency from each pointing-device movement to its corresponding cursor response on the screen, which is known to affect user performance in target selection, e.g., in terms of movement time (MTs). Previous work also reported that a long latency increases MTs in path-steering tasks, but the quantitative relationship between latency and MT had not been previously investigated for path-steering. In this work, we derive models to predict MTs for path-steering and evaluate them with five tasks: goal crossing as a preliminary task for model derivation, linear-path steering, circular-path steering, narrowing-path steering, and steering with target pointing. The results show that the proposed models yielded an adjusted R^2 > 0.94, with lower AICs and smaller cross-validation RMSEs than the baseline models, enabling more accurate prediction of MTs.},
keywords = {steering, latency},
}
@inproceedings{turkmen2024eyeconguide,
title = {EyeGuide & EyeConGuide: Gaze-based Visual Guides to Improve 3D Sketching Systems},
author = {Turkmen+, Rumeysa and Gelmez+, Zeynep Ecem and Batmaz, Anil Ufuk and Stuerzlinger, Wolfgang and Asente, Paul and Sarac, Mine and Pfeuffer, Ken and Barrera Machuca, Mayra Donaji},
booktitle = {Conference on Human Factors in Computing Systems},
publisher = {ACM},
series = {CHI '24},
year = {2024},
month = {May},
articleno = {178},
pages = {1-14},
doi = {https://doi.org/10.1145/3613904.3641947},
pdf = {papers/eyeconguide.pdf},
video = {videos/eyeconguide.mp4},
teaser = {teasers/eyeconguide.png},
abstract = {Visual guides in Virtual Reality sketching systems help to align strokes and raise accuracy. Guides that appear dynamically where one wants to draw have the potential to both lower the reliance on manual guide activation and improve the sketching experience. We propose novel guide techniques for sketching that exploit eye-tracking to modulate where a grid fragment appears. EyeGuide and EyeConGuide cause this grid fragment to appear spatially close to the user's intended sketches, with one relying on the user's eyes and the other on both the eyes and the hand location. In two user studies, we evaluated the techniques in basic and complex sketching tasks. The results show that gaze-based guides increased sketching accuracy compared to no guides, improved the system usability over manual activation, and were preferred by most users. Our research contributes highly usable techniques to assist accurate sketching and insights into multimodal gaze-contingent sketching.},
keywords = {eye tracking, gaze tracking, 3D sketching, 3D drawing},
}
@inproceedings{rind2024longitudinalehct,
title = {Eye-Hand Coordination Training: A Systematic Comparison of 2D, VR, and AR Screen Technologies and Task Motives},
author = {Rind*, Aliza and Zaugg+, Irene and Celik+, Elif and Stuerzlinger, Wolfgang and Ortega, Francisco and Batmaz, Anil Ufuk and Sarac, Mine},
booktitle = {Conference on Virtual Reality and {3D} User Interfaces},
publisher = {IEEE},
series = {VR '24},
year = {2024},
month = {Mar},
pages = {200-210},
doi = {https://doi.org/10.1109/VR58804.2024.00043},
pdf = {papers/longitudinalehct.pdf},
teaser = {teasers/longitudinalehct.png},
video = {videos/longitudinalehct.mp4},
abstract = {This study compares Augmented Reality (AR), Virtual Reality (VR), and 2D touchscreen approaches for eye-hand coordination training. We thoroughly analyze the motor performance of twenty participants throughout the course of a ten-session longitudinal study. Our study includes five different assessment criteria: speed, error rate, accuracy, precision, and none. We also analyze the participants' performance in terms of effective throughput as a novel evaluation criterion. The results showed that each task execution strategy has a different effect on one or more psychomotor characteristics of the trainee, which highlights the importance of the training program. We also showed that effective throughput is a candidate for monitoring the overall motor performance progress in eye-hand coordination training systems.},
keywords = {3D pointing, vergence-accomodation conflict, virtual hand},
}
@inproceedings{wagner2024taxivis,
title = {Reimagining TaxiVis through an Immersive Space-Time Cube Metaphor and Reflecting on Potential Benefits of Immersive Analytics for Urban Data Exploration},
author = {Wagner Filho*, Jorge and Silva, Claudio and Stuerzlinger, Wolfgang and Nedel, Luciana},
booktitle = {Conference on Virtual Reality and {3D} User Interfaces},
publisher = {IEEE},
series = {VR '24},
year = {2024},
month = {Mar},
pages = {827-838},
doi = {https://doi.org/10.1109/VR58804.2024.00102},
pdf = {papers/immersivetaxivis.pdf},
teaser = {teasers/immersivetaxivis.png},
video = {videos/immersivetaxivis.mp4},
url = {https://arxiv.org/abs/2402.00344},
abstract = {Recent studies suggest that immersion into 3D environments could increase the usability of 3D visualizations by facilitating 3D perception and easier interaction, and also better support collaboration between local or remote analysts. This is particularly relevant for domains with an obvious three-dimensional mapping, such as urban space-time data. To explore how a traditional visualization system could be adapted into an immersive framework, and how it could benefit from this, we decided to revisit a landmark paper presented ten years ago at IEEE VIS. TaxiVis, by Ferreira et al., enabled interactive spatial-temporal querying of a large dataset of taxi trips in New York City. Here, we reimagine how TaxiVis’ functionalities could be implemented and extended in a 3D immersive environment. Among the unique features we identify as being enabled by the Immersive TaxiVis prototype are alternative uses of the additional visual dimension, a fully-visual 3D spatio-temporal query framework, and the opportunity to explore the data at different scales and frames of reference. The intent behind our work is to complement and enhance established forms of visualization, not to replace them. Through reporting on our findings, and on the vision and reasoning behind our design decisions, we hope to contribute to the debate on how conventional and immersive visualization paradigms can help each other and also how the exploration of urban datasets can be facilitated in the coming years.},
keywords = {visual analytics, immersive analytics, space-time cube, 3D visualization, 3D interaction},
}
@inproceedings{batmaz2023gripstyle,
title = {Effect of Grip Style on Pointing in Head Mounted Displays},
author = {Batmaz, Anil Ufuk and Turkmen+, Rumeysa and Sarac, Mine and Barrera Machuca, Mayra Donaji and Stuerzlinger, Wolfgang},
booktitle = {International Symposium on Mixed and Augmented Reality},
publisher = {IEEE},
series = {ISMAR '23},
year = {2023},
month = {Oct},
pages = {425-433},
doi = {https://doi.org/10.1109/ISMAR59233.2023.00057},
pdf = {papers/gripstyle.pdf},
teaser = {teasers/gripstyle.png},
abstract = {When working in Virtual Reality (VR), the user's performance is affected by how the user holds the input device (e.g., controller), typically using either a precision or a power grip. Previous work examined these grip styles for 3D pointing at targets at different depths in peripersonal space. They found that participants had a lower error rate with the precision grip but no difference in movement speed, throughput, or interaction with target depth, but their experiment was potentially affected by tracking differences between devices. This paper reports an experiment that partially replicates and extends this study by evaluating the effect of grip style on the 3D selection of nearby targets with the same device. Furthermore, our experiment investigates the effect of the vergence-accommodation conflict (VAC) present in current stereo displays on 3D pointing in peripersonal space. Our results show that grip style significantly affects user performance. We hope that our results can guide developers, researchers, and designers when creating virtual environments.},
keywords = {3D pointing, vergence-accomodation conflict},
}
@inproceedings{batmaz2023reinvestigatingvac,
title = {Re-investigating the Effect of the Vergence-Accommodation Conflict on 3D Pointing},
author = {Batmaz, Anil Ufuk and Turkmen+, Rumeysa and Sarac, Mine and Barrera Machuca, Mayra Donaji and Stuerzlinger, Wolfgang},
booktitle = {29th Symposium on Virtual Reality Software and Technology},
publisher = {ACM},
series = {VRST '23},
year = {2023},
month = {Oct},
articleno = {8},
numpages = {10},
doi = {https://doi.org/10.1145/3611659.3615686},
pdf = {papers/reinvestigatingvac.pdf},
teaser = {teasers/reinvestigatingvac.png},
abstract = {The vergence-accommodation conflict (VAC) limits user performance in current Virtual Reality (VR) systems. In this paper, we investigate the effects of the VAC in a single focal VR system using three experimental conditions: with no VAC, with a constant VAC, and with a varying VAC. Previous work had yielded conflicting results, so we decided to re-investigate this issue. Eighteen participants performed an ISO 9241:411 task in a study that closely replicates previous work, except that the angle of the task space was rotated 20 degrees downward, to make the task less fatiguing to perform, which addresses a potential confound in previous work. We found that the varying VAC condition had worse performance than the other conditions, which indicates that the contrasting results in previous work were very likely due to biomechanical factors. We hope that our work contributes to the understanding of the influence of the VAC in VR systems and potential strategies for improving user experience and performance in immersive virtual environments.},
keywords = {3D pointing, vergence-accomodation conflict},
}
@inproceedings{han2023drseye,
title = {Dr.’s Eye: The Design and Evaluation of a Video Conferencing System to Support Doctor Appointments in Home Settings},
author = {Han*, Dongqi and Geiskkovitch, Denise Y. and Yuan, Ye and Mills*, Chelsea and Zhong*, Ce and Chen*, Amy Yo Sue and Stuerzlinger, Wolfgang and Neustaedter, Carman},
booktitle = {Conference on Human Factors in Computing Systems},
publisher = {ACM},
series = {CHI '23},
year = {2023},
month = {Apr},
articleno = {343},
numpages = {18},
doi = {https://doi.org/10.1145/3544548.3581350},
pdf = {papers/drseye.pdf},
video = {videos/drseye.mp4},
teaser = {teasers/drseye.png},
abstract = {The spread of COVID-19 has encouraged the practice of using video conferencing for family doctor appointments. Existing applications and devices face challenges in capturing the correct view of patients' bodies and supporting ease of use. We created Dr.’s Eye, a video conferencing prototype to support varying types of body exams in home settings. An exploratory study was conducted with patients in mock appointments to explore the use of our video system. Results show the benefits of providing more flexibility with a decoupled camera and display, and privacy protection by limiting the camera view. Yet, challenges remain in maneuvering two devices, presenting feedback of the camera view, coordinating camera work between the doctor and patient, and coping with discomfort in showing private body regions. This inspires future research on how to design a video system for doctor appointments.},
keywords = {teleconference, doctor},
}
@inproceedings{lee2023multiscaletransitions,
title = {Designing Viewpoint Transition Techniques in Multiscale Virtual Environments},
author = {Lee*, Jong-In and Asente, Paul and Stuerzlinger, Wolfgang},
booktitle = {Conference on Virtual Reality and {3D} User Interfaces},
publisher = {IEEE},
series = {VR '23},
year = {2023},
month = {Mar},
pages = {680-690},
doi = {https://doi.org/10.1109/VR55154.2023.00083},
pdf = {papers/multiscaletransitions.pdf},
video = {videos/multiscaletransitions.mp4},
teaser = {teasers/multiscaletransitions.png},
abstract = {Viewpoint transitions have been shown to improve users' spatial orientation and help them build a cognitive map when they are navigating an unfamiliar virtual environment. Previous work has investigated transitions in single-scale virtual environments, focusing on trajectories and continuity. We extend this work with an in-depth investigation of transition techniques in multiscale virtual environments (MVEs). We identify challenges in navigating MVEs with nested structures and assess how different transition techniques affect spatial understanding and usability. Through two user studies, we investigated transition trajectories, interactive control of transition movement, and speed modulation in a nested MVE. We show that some types of viewpoint transitions enhance users' spatial awareness and confidence in their spatial orientation and reduce the need to revisit a target point of interest multiple times.},
keywords = {3D navigation, multiscale virtual environment, transitions, speed control},
}
@inproceedings{batmaz2023virtualhandvac,
title = {Measuring the Effect of Stereo Deficiencies on Peripersonal Space Pointing},
author = {Batmaz, Anil Ufuk and Hudhud Mughrabi+, Moaaz and Sarac, Mine and Barrera Machuca, Mayra Donaji and Stuerzlinger, Wolfgang},
booktitle = {Conference on Virtual Reality and {3D} User Interfaces},
publisher = {IEEE},
series = {VR '23},
year = {2023},
month = {Mar},
pages = {1-11},
doi = {https://doi.org/10.1109/VR55154.2023.00063},
pdf = {papers/virtualhandvac.pdf},
teaser = {teasers/virtualhandvac.png},
abstract = {State-of-the-art Virtual Reality (VR) and Augmented Reality (AR) headsets rely on singlefocal stereo displays. For objects away from the focal plane, such displays create a vergence-accommodation conflict (VAC), potentially degrading user interaction performance. In this paper, we study how the VAC affects pointing at targets within arm's reach with virtual hand and raycasting interaction in current stereo display systems. We use a previously proposed experimental methodology that extends the ISO 9241-411:2015 multi-directional selection task to enable fair comparisons between selecting targets in different display conditions. We conducted a user study with eighteen participants and the results indicate that participants were faster and had higher throughput in the constant VAC condition with the virtual hand. We hope that our results enable designers to choose more efficient interaction methods in virtual environments.},
keywords = {3D pointing, vergence-accomodation conflict, virtual hand},
}
@inproceedings{shi2022groupalignment,
title = {Group-based Object Alignment in Virtual Reality Environments},
author = {Shi*, Rongkai and Zhang*, Jialin and Stuerzlinger, Wolfgang and Liang, Hai-Ning},
booktitle = {Symposium on Spatial User Interaction},
publisher = {ACM},
series = {SUI '22},
year = {2022},
month = {Dec},
articleno = {2},
numpages = {11},
doi = {https://doi.org/10.1145/3565970.3567682},
pdf = {papers/groupalign3D.pdf},
teaser = {teasers/groupalign3D.png},
abstract = {Group-based object alignment is an essential manipulation task, particularly for complex scenes. In conventional 2D user interfaces, such alignment tasks are generally achieved via a command/menu-based interface. Virtual reality (VR) head-mounted displays (HMDs) provide a rich immersive interaction experience, which opens more design options for group-based object alignment interaction techniques. However, object alignment techniques in immersive environments are underexplored. In this paper, we present four interaction techniques for 3 degrees-of-freedom translational alignments: AlignPanel, AlignWidget, AlignPin, and AlignGesture. We evaluated their performance, workload, and usability in a user study with 20 participants. Our results indicate different benefits and drawbacks of these techniques for group-based alignment in immersive systems. Based on the findings, we distill a set of design choices and recommendations for these techniques in various application scenarios.},
keywords = {3D positioning, 3D manipulation, alignment, 3D user interfaces},
}
@inproceedings{batmaz2022improvingperformance,
title = {Improving Effective Throughput Performance using Auditory Feedback in Virtual Reality Training Systems},
author = {Batmaz, Anil Ufuk and Yu*, Kangyou and Liang, Hai-Ning and Stuerzlinger, Wolfgang},
booktitle = {Symposium on Spatial User Interaction},
publisher = {ACM},
series = {SUI '22},
year = {2022},
month = {Dec},
articleno = {18},
numpages = {11},
doi = {https://doi.org/10.1145/3565970.3567702},
pdf = {papers/audiothroughput.pdf},
teaser = {teasers/audiothroughput.png},
abstract = {During the complex process of motor skill acquisition, novices might focus on different criteria, such as speed or accuracy, in their training. Previous research on virtual reality (VR) training systems has shown that effective throughput could also be used as such an assessment criterion. Effective throughput combines speed, accuracy, and precision into one measure, and can be influenced by auditory feedback. This paper investigates through a user study how to improve participants' effective throughput performance using auditory feedback. In the study, we mapped the speed and accuracy of the participants to the pitch of the auditory error feedback in an ISO 9241-411 multidirectional pointing task and evaluated participants' performance. The results showed it is possible to regulate the time or accuracy performance of the participants and thus the effective throughput. Based on the findings of our work, we also identify that effective throughput is an appropriate assessment criterion for VR training systems. We hope that our results can be used for VR training applications.},
keywords = {3D pointing, auditory feedback, training},
}
@inproceedings{batmaz2022stereodistal,
title = {Effect of Stereo Deficiencies on Virtual Distal Pointing},
author = {Batmaz, Anil Ufuk and Hudhud Mughrabi+, Moaaz and Barrera Machuca, Mayra Donaji and Stuerzlinger, Wolfgang},
booktitle = {28th Symposium on Virtual Reality Software and Technology},
publisher = {ACM},
series = {VRST '22},
year = {2022},
month = {Nov},
articleno = {12},
numpages = {8},
doi = {https://doi.org/10.1145/3562939.3565621},
pdf = {papers/vac_distal.pdf},
teaser = {teasers/vac_distal.png},
abstract = {Previous work has shown that the mismatch between disparity and optical focus cues, i.e., the vergence and accommodation conflict (VAC), affects virtual hand selection in immersive systems. To investigate if the VAC also affects distal pointing with ray casting, we ran a user study with an ISO 9241:411 multidirectional selection task where participants selected 3D targets with three different VAC conditions, no VAC, i.e., targets placed roughly at 75 cm, which matches the focal plane of the VR headset, constant VAC, i.e., at 400 cm from the user, and varying VAC, where the depth distance of targets changed between 75 cm and 400 cm. According to our results, the varying VAC condition requires the most time and decreases the throughput performance of the participants. It also takes longer for users to select targets in the constant VAC condition than without the VAC. Our results show that in distal pointing placing objects at different depth planes has detrimental effect on the user performance.},
keywords = {3D pointing, vergence-accomodation conflict, ray casting},
}
@inproceedings{mutasim2022performance,
title = {Performance Analysis of Saccades for Primary and Confirmatory Target Selection},
author = {Mutasim*, Aunnoy K and Batmaz, Anil Ufuk and Hudhud Mughrabi+, Moaaz and Stuerzlinger, Wolfgang},
booktitle = {28th Symposium on Virtual Reality Software and Technology},
publisher = {ACM},
series = {VRST '22},
year = {2022},
month = {Nov},
articleno = {18},
numpages = {12},
doi = {https://doi.org/10.1145/3562939.3565619},
pdf = {papers/saccadeconfirm.pdf},
video = {videos/saccadeconfirm.mp4},
teaser = {teasers/saccadeconfirm.png},
abstract = {In eye-gaze-based selection, dwell suffers from several issues, e.g., the Midas Touch problem. Here we investigate saccade-based selection techniques as an alternative to dwell. First, we designed a novel user interface (UI) for Actigaze and used it with (goal-crossing) saccades for confirming the selection of small targets (i.e., < 1.5-2°). We compared it with three other variants of Actigaze (with button press, dwell, and target reverse crossing) and two variants of target magnification (with button press and dwell). Magnification-dwell exhibited the most promising performance. Among Actigaze, goal-crossing was the fastest and achieved the highest throughput but suffered the most errors. We then evaluated goal-crossing as a primary selection technique for targets ≥ 2° and implemented a novel UI for such interaction. Results revealed that dwell achieved the best performance. Yet, we identified goal-crossing as a good compromise between dwell and button press. Our findings thus identify novel options for gaze-only interaction.},
keywords = {eye tracking, pointing, saccades},
}
@inproceedings{chidambaram2022editar,
title = {EditAR: A Digital Twin Authoring and Editing Environment for Creation of AR/VR and Video Instructions from a Single Demonstration},
author = {Chidambaram*, Subramanian and Reddy*, Sai Swarup and Rumple*, Matthew David and Ipsita*, Ananya and Villanueva*, Ana M and Redick, Thomas S and Stuerzlinger, Wolfgang and Ramani, Karthik},
booktitle = {International Symposium on Mixed and Augmented Reality},
publisher = {IEEE},
series = {ISMAR '22},
year = {2022},
month = {Oct},
pages = {326-335},
doi = {https://doi.org/10.1109/ISMAR55827.2022.00048},
pdf = {papers/editar.pdf},
video = {videos/editar.mp4},
teaser = {teasers/editar.png},
abstract = {Augmented/Virtual reality and video-based media play a vital role in the digital learning revolution to train novices in spatial tasks. However, creating content for these different media requires expertise in several fields. We present EditAR, a unified authoring and editing workflow to create content for AR, VR, and video with a single demonstration. EditAR captures the user’s interaction within an environment and creates a digital twin enabling users with no prior programming background to develop content. We conducted formative interviews with both subject and media experts to design the system. The prototype then developed was reviewed by experts. We also performed a comparative study on 2D video creation from 3D recordings, via a 3D editor, which uses freehand interaction for in-headset editing vs. traditional video creation. Users took 5x less time to record instructions and preferred EditAR in a qualitative survey, along with giving significantly higher usability scores.},
keywords = {augmented reality, 3d user interfaces, authoring, digital twin},
}
@inproceedings{alharbi2022autocucumber,
title = {Auto-Cucumber: The Impact of Autocorrection Failures on Users' Frustration},
author = {Alharbi*, Ohoud and Stuerzlinger, Wolfgang},
booktitle = {Graphics Interface},
series = {GI '22},
year = {2022},
month = {May},
articleno = {16},
pages = {148-160},
doi = {https://doi.org/10.20380/GI2022.16},
pdf = {papers/autocucumber.pdf},
commented-url = {https://openreview.net/forum?id=dcbsb4qTmnt},
teaser = {teasers/autocucumber.png},
abstract = {Many mobile users rely on autocorrection mechanisms during text entry on their smartphone. Previous studies investigated the effects of autocorrection mechanisms on typing speed and accuracy but did not explore the level of frustration and perceived mental workload often associated with autocorrection. In this paper, we investigate the effect of autocorrection failures on the user’s frustration, mental and physical demand, performance, and effort using a mixed-methods user study. We identified that perceived mental and physical demand, and frustration are directly affected by autocorrection.},
keywords = {text entry, autocorrect, errors, frustration},
}
@inproceedings{batmaz2022vacpointing,
title = {The Effect of the Vergence-Accommodation Conflict on Virtual Hand Pointing in Immersive Displays},
author = {Batmaz, Anil Ufuk and Barrera Machuca, Mayra D. and Sun, Junwei and Stuerzlinger, Wolfgang},
booktitle = {Conference on Human Factors in Computing Systems},
publisher = {ACM},
series = {CHI '22},
year = {2022},
month = {May},
articleno = {633},
numpages = {15},
doi = {https://doi.org/10.1145/3491102.3502067},
pdf = {papers/vacpointing.pdf},
video = {videos/vacpointing.mp4},
teaser = {teasers/vacpointing.png},
abstract = {Previous work hypothesized that for Virtual Reality (VR) and Augmented Reality (AR) displays a mismatch between disparities and optical focus cues, known as the vergence and accommodation conflict (VAC), affects depth perception and thus limits user performance in 3D selection tasks within arm’s reach (peri-personal space). To investigate this question, we built a multifocal stereo display, which can eliminate the influence of the VAC for pointing within the investigated distances. In a user study, participants performed a virtual hand 3D selection task with targets arranged laterally or along the line of sight, with and without a change in visual depth, in display conditions with and without the VAC. Our results show that the VAC influences 3D selection performance in common VR and AR stereo displays and that multifocal displays have a positive effect on 3D selection performance with a virtual hand.},
keywords = {3D pointing, vergence-accomodation conflict, immersive display system, multifocal display},
}
@inproceedings{hudhud2022jitter,
title = {My Eyes Hurt: Effects of Jitter in 3D Gaze Tracking},
author = {Hudhud Mughrabi+, Moaaz and Mutasim*, Aunnoy K and Stuerzlinger, Wolfgang and Batmaz, Anil Ufuk},
booktitle = {Conference on Virtual Reality and {3D} User Interfaces Abstracts and Workshops, Workshop on Novel Input Devices and Interaction Techniques at {VR}},
publisher = {IEEE},
series = {NIDIT '22},
year = {2022},
month = {Mar},
pages = {310-315},
doi = {https://doi.org/10.1109/VRW55335.2022.00070},
pdf = {papers/gazejitter.pdf},
abstract = {Jitter, small fluctuations in the signal, is one of the major sources for a decrease of motor performance and a negative user experience in virtual reality (VR) systems. Current technologies still cannot eliminate jitter in VR systems, especially in the eye-gaze tracking systems embedded in many head-mounted displays. In this work, we used an HTC Vive Pro Eye, artificially added 0.5°, 1°, and 1.5° jitter to the eye-tracking data, and analyzed user performance in a ISO 9241:411 pointing task with targets at 1 or 2 meters visual distance using angular Fitts’ law. The results showed that the user’s error rate significantly increases with increased jitter levels. No significant difference was observed for time and throughput. Additionally, we observed a significant decrease in terms of time, error rate, and throughput for the more distant targets. We hope that our results guide researcher, practitioners, and developers towards better gaze-tracking-based VR applications.},
keywords = {3D pointing, jitter, virtual reality},
}
@inproceedings{batmaz2021anchoring,
title = {When Anchoring Fails: Interactive Alignment of Large Virtual Objects in Occasionally Failing AR Systems},
author = {Batmaz, Anil Ufuk and Stuerzlinger, Wolfgang},
booktitle = {Future Technologies Conference},
publisher = {Springer},
series = {FTC '21},
year = {2021},
month = {Oct},
volume = {LNNS 358},
numpages = {13},
doi = {https://doi.org/10.1007/978-3-030-89906-6_4},
pdf = {papers/aranchoring.pdf},
teaser = {teasers/aranchoring.png},
abstract = {Augmented reality systems show virtual object models overlaid over real ones, which is helpful in many contexts, e.g., during maintenance. Assuming all geometry is known, misalignments in 3D poses will still occur without perfectly robust viewer and object 3D tracking. Such misalignments can impact the user experience and reduce the potential benefits associated with AR systems. In this paper, we implemented several interactive algorithms to make manual virtual object alignment easier, based on previously presented methods, such as HoverCam, SHOCam, and a Signed Distance Field. Our approach also simplifies the user interface for manual 3D pose alignment. The results of our work indicate that our approach can reduce the time needed for interactive 3D pose alignment, which improves the user experience.},
keywords = {augmented reality, 3D navigation, 3D orbiting, 3D tracking, anchoring},
}
@inproceedings{chakraborty2021vizinteract,
title = {VizInteract: Rapid Data Exploration through Multi-Touch Interaction with Multi-Dimensional Visualizations},
author = {Chakraborty*, Supratim and Stuerzlinger, Wolfgang},
booktitle = {Human-Computer Interaction},
publisher = {Springer},
series = {INTERACT '21},
year = {2021},
month = {Aug},
volume = {LNCS 12934},
pages = {610–632},
doi = {https://doi.org/10.1007/978-3-030-85613-7_39},
pdf = {papers/vizinteract.pdf},
url = {https://heysupratim.com/projects/vizinteract},
video = {videos/vizinteract.mp4},
teaser = {teasers/vizinteract.png},
abstract = {Creating and editing multi-dimensional data visualizations with current tools typically involves complex interactions. We present VizInteract, an interactive data visualization tool for touch-enabled displays. VizInteract supports efficient multi-touch data exploration through rapid construction of and interaction with multi-dimensional data visualizations. Building on primitive visualization idioms like histograms, VizInteract addresses the need for easy data exploration by facilitating the construction of multi-dimensional visualizations, such as scatter plots, parallel coordinate plots, radar charts, and scatter plot matrices, through simple multi-touch actions. Touch-based brushing-and-linking as well as attribute-based filter bubbles support “diving into the data” during analysis. We present the results of two explorative studies, one on a tablet and another on a large touchscreen and analyze the usage patterns that emerge while participants conducted visual analytics data exploration tasks in both conditions.},
keywords = {visual analytics, visualization, touch},
}
@inproceedings{chidambaram2021processar,
title = {ProcessAR: An augmented reality-based tool to create in-situ procedural 2D/3D AR Instructions},
author = {Chidambaram*, Subramanian and Huang*, Hank and He*, Fengming and Qian*, Xun and Villanueva*, Ana M and Redick, Thomas S and Stuerzlinger, Wolfgang and Ramani, Karthik},
booktitle = {Designing Interactive Systems},
publisher = {ACM},
series = {DIS '21},
year = {2021},
month = {Jun},
pages = {234-249},
doi = {https://doi.org/10.1145/3461778.3462126},
pdf = {papers/processar.pdf},
video = {videos/processar.mp4},
teaser = {teasers/processar.png},
abstract = {Augmented reality (AR) is an efficient form of delivering spatial information and has great potential for training workers. However, AR is still not widely used due to the technical skills, expertise, required to develop appropriate and interactive AR content. We developed ProcessAR, an AR-based system to develop 2D/3D content by capturing subject matter expert (SME) environment-object interactions, in situ. To enable smooth workflows, ProcessAR locates and identifies different tools/objects in the workspace where the author looks at them, by utilizing a computer vision algorithm. We explored additional features such as embedding 2D videos to detected objects and user-adaptive triggers. The design space for ProcessAR was identified from formative interviews with AR programming experts and SMEs, alongside a comparative design study with SMEs and novice users. A final user evaluation comparing ProcessAR and a baseline AR authoring environment studied, users rated ProcessAR as the better form on qualitative perceptional surveys.},
keywords = {augmented reality, mixed reality, AR authoring},
}
@inproceedings{mutasim2021pinchclickdwell,
title = {Pinch, Click, or Dwell: Comparing Different Selection Techniques for Eye-Gaze-Based Pointing in Virtual Reality},
author = {Mutasim*, Aunnoy K. and Batmaz, Anil Ufuk and Stuerzlinger, Wolfgang},
booktitle = {Symposium on Eye Tracking Research and Applications},
publisher = {ACM},
series = {ETRA '21},
year = {2021},
month = {May},
articleno = {15},
numpages = {7},
doi = {https://doi.org/10.1145/3448018.3457998},
pdf = {papers/pinchclickdwell.pdf},
teaser = {teasers/pinchclickdwell.png},
abstract = {While a pinch action is gaining popularity for selection/activation of virtual objects in eye-gaze-based systems, it is still unknown how well it performs compared to other popular alternatives, e.g., a button click or a dwell action. To determine pinch's performance in terms of execution time, error rate, and throughput, we implemented a Fitts' law task in Virtual Reality (VR) where the subjects pointed with their eye-gaze and selected/activated the targets by either pinch, clicking a button, or dwell. Results revealed that although pinch was slower, resulted in more errors, and had less throughput compared to button clicks, none of these differences between the two conditions were significant. Dwell exhibited the least errors but was significantly slower and achieved less throughput compared to the other conditions. Based on these findings, we conclude that the pinch gesture is a reasonable alternative to button clicks for eye-gaze-based VR systems.},
keywords = {eye tracking, selection, pointing},
}
@inproceedings{jiang2021reverseorc,
title = {{ReverseORC}: Reverse Engineering of Resizable User Interface Layouts with {OR}-Constraints},
author = {Jiang*, Yue and Stuerzlinger, Wolfgang and Lutteroth, Christof},
booktitle = {Conference on Human Factors in Computing Systems},
publisher = {ACM},
series = {CHI '21},
year = {2021},
month = {May},
articleno = {316},
numpages = {18},
doi = {https://doi.org/10.1145/3411764.3445043},
pdf = {papers/reverseorc.pdf},
url = {https://github.com/YueJiang-nj/ReverseORC-CHI2021},
video = {https://youtu.be/uBVRtUvLFSk},
teaser = {teasers/reverseorc.png},
abstract = {Reverse engineering (RE) of user interfaces (UIs) plays an important role in software evolution. However, the large diversity of UI technologies and the need for UIs to be resizable make this challenging.
We propose ReverseORC, a novel RE approach able to discover diverse layout types and their dynamic resizing behaviours independently of their implementation, and to specify them by using OR constraints. Unlike previous RE approaches, ReverseORC infers flexible layout constraint specifications by sampling UIs at different sizes and analyzing the differences between them. It can create specifications that replicate even some non-standard layout managers with complex dynamic layout behaviours. We demonstrate that ReverseORC works across different platforms with very different layout approaches, e.g., for GUIs as well as for the Web. Furthermore, it can be used to detect and fix problems in legacy UIs, extend UIs with enhanced layout behaviours, and support the creation of flexible UI layouts.},
keywords = {GUI, layout, constraints},
}
@inproceedings{batmaz2021pitch,
title = {The Effect of Pitch in Auditory Error Feedback for Fitts' Tasks in Virtual Reality Training Systems},
author = {Batmaz, Anil Ufuk and Stuerzlinger, Wolfgang},
booktitle = {Conference on Virtual Reality and {3D} User Interfaces},
publisher = {IEEE},
series = {VR '21},
year = {2021},
month = {Mar},
pages = {85-94},
doi = {https://doi.org/10.1109/VR50410.2021.00029},
pdf = {papers/pitchfeedback.pdf},
teaser = {teasers/pitchfeedback.png},
abstract = {Fitts' law and the associated throughput measure characterize user pointing performance in virtual reality (VR) training systems and simulators well. Yet, pointing performance can be affected by the feedback users receive from a VR application. This work examines the effect of the pitch of auditory error feedback on user performance in a Fitts' task through a distributed experiment. In our first study, we used middle- and high-frequency sound feedback and demonstrated that high-pitch error feedback significantly decreases user performance in terms of time and throughput. In the second study, we used adaptive sound feedback, where we increased the frequency with the error rate, while asking subjects to execute the task "as fast/as precise/as fast and precise as possible". Results showed that adaptive sound feedback decreases the error rate for "as fast as possible" task execution without affecting the time. The results can be used to enhance and design various VR systems.},
keywords = {3D pointing, feedback, augmented reality, touch},
}
@inproceedings{batmaz2021auditory,
title = {Effects of Different Auditory Feedback Frequencies in Virtual Reality {3D} Pointing Tasks},
author = {Batmaz, Anil Ufuk and Stuerzlinger, Wolfgang},
booktitle = {Conference on Virtual Reality and {3D} User Interfaces, Abstracts and Workshops, Workshop on Novel Input Devices and Interaction Techniques at {VR}},
publisher = {IEEE},
series = {NIDIT '21},
year = {2021},
month = {Mar},
pages = {189-194},
doi = {https://doi.org/10.1109/VRW52623.2021.00042},
pdf = {papers/auditoryfeedback.pdf},
abstract = {Auditory error feedback is commonly used in 3D Virtual Reality (VR) pointing experiments to increase participants' awareness of their misses. However, few papers describe the parameters of the auditory feedback, such as the frequency. In this study, we asked 15 participants to perform an ISO 9241-411 pointing task in a distributed remote experiment. In our study, we used three forms of auditory feedback, i.e., C4 (262 Hz), C8 (4186 Hz) and none. According to the results, we observed a speed-accuracy trade-off for the C8 tones compared to C4 ones: subjects were slower, and their throughput performance decreased with the C8 while their error rate decreased. Still, for larger targets there was no speed-accuracy trade-off, and subjects were only slower with C8 tones. Overall, the frequency of the feedback had a significant impact on the user's performance. We thus suggest that practitioners, developers, and designers report the frequency they used in their VR applications.},
keywords = {3D pointing, feedback, virtual reality},
}
@inproceedings{batmaz2020nojitter,
title = {No Jitter Please: Effects of Rotational and Positional Jitter on {3D} Mid-Air Interaction},
author = {Batmaz, Anil Ufuk and Rajabi Seraji*, Mohammad and Kneifel*, Johanna and Stuerzlinger, Wolfgang},
booktitle = {Future Technologies Conference},
publisher = {Springer},
series = {FTC '20},
year = {2020},
month = {Nov},
volume = {AISC 1289},
commented-volume = {2},
numpages = {16},
doi = {https://doi.org/10.1007/978-3-030-63089-8_52},
pdf = {papers/nojitter.pdf},
teaser = {teasers/nojitter.png},
abstract = {Virtual Reality (VR) 3D tracking systems are susceptible to minor fluctuations in signal (jitter). In this study, we explored how different levels of jitter affect user performance for 3D pointing. We designed a Fitts' Law experiment investigating target positional jitter and cursor rotational jitter at 3 different depth distances. Performance was negatively affected when up to ± 0.5° rotational jitter was applied to the controller and up to ± 0.375 cm positional jitter was applied to the target. At 2.25 m distance, user performance did not improve with decreasing positional jitter or rotational jitter compared to the no jitter condition. Our results can inform the design of 3D user interfaces, controllers, and interaction techniques in VR. Specifically, we suggest a focus on counteracting controller rotational jitter as this would globally increase performance for ray-based selection tasks.},
keywords = {3D pointing, mid-air, jitter},
}
@inproceedings{lee2020automatic,
title = {Evaluating Automatic Parameter Control Methods for Locomotion in Multiscale Virtual Environments},
author = {Lee*, Jong-In and Asente, Paul and Kim, Byungmoon and Kim, Yeojin and Stuerzlinger, Wolfgang},
booktitle = {26th Symposium on Virtual Reality Software and Technology},
publisher = {ACM},
series = {VRST '20},
year = {2020},
month = {Nov},
articleno = {11},
numpages = {10},
doi = {https://doi.org/10.1145/3385956.3418961},
pdf = {papers/navmultiscaleve.pdf},
video = {videos/navmultiscaleve.mp4},
teaser = {teasers/navmultiscaleve.png},
abstract = {Virtual environments with a wide range of scales are becoming commonplace in Virtual Reality applications. Methods to control locomotion parameters can help users explore such environments more easily. For multi-scale virtual environments, point-and-teleport locomotion with a well-designed distance control method can enable mid-air teleportation, which makes it competitive to flying interfaces. Yet, automatic distance control for point-and-teleport has not been studied in such environments. We present a new method to automatically control the distance for point-and-teleport. In our first user study, we used a solar system environment to compare three methods: automatic distance control for point-and-teleport, manual distance control for point-and-teleport, and automatic speed control for flying. Results showed that automatic control significantly reduces overshoot compared with manual control for point-and-teleport, but the discontinuous nature of teleportation made users prefer flying with automatic speed control. We conducted a second study to compare automatic-speed-controlled flying and two versions of our teleportation method with automatic distance control, one incorporating optical flow cues. We found that point-and-teleport with optical flow cues and automatic distance control was more accurate than flying with automatic speed control, and both were equally preferred to point-and-teleport without the cues.},
keywords = {3D navigation, multiscale virtual environment, teleportation, automatic distance, speed control},
}
@inproceedings{batmaz2020eyehand,
title = {Eye-Hand Coordination Training for Sports with Mid-air {VR}},
author = {Batmaz, Anil Ufuk and Sun*, Xintian and Taskiran, Dogu and Stuerzlinger, Wolfgang},
booktitle = {26th Symposium on Virtual Reality Software and Technology},
publisher = {ACM},
series = {VRST '20},
year = {2020},
month = {Nov},
articleno = {19},
numpages = {10},
doi = {https://doi.org/10.1145/3385956.3418971},
pdf = {papers/eyehandsports.pdf},
video = {videos/eyehandsports.mp4},
teaser = {teasers/eyehandsports.png},
abstract = {A relatively recent application area for Virtual Reality (VR) systems is sports training and user performance assessment. One of these applications is eye-hand coordination training systems (EHCTSs). Previous research identified that VR-based training systems have great potential for EHCTSs. While previous work investigated 3D targets on a 2D plane, here we aim to study full 3D movements and extend the application of throughput analysis to EHCTSs. We conducted two user studies to investigate how user performance is affected by different target arrangements, feedback conditions, and handedness in VR-based EHCTSs. In the first study, we explored handedness as well as vertical and horizontal target arrangements, and showed that user performance increases with the dominant hand and a vertical target plane. In the second study, we investigated different combinations of visual and haptic feedback and how they affect user performance with different target and cursor sizes. Results illustrate that haptic feedback did not increase user performance when it is added to visual feedback. Our results inform the creation of better EHCTSs with mid-air VR systems.},
keywords = {3D pointing, eye-hand coordination, sports training},
}
@inproceedings{jiang2020orcsolver,
title = {{ORCSolver}: An Efficient Solver for Adaptive {GUI} Layout with {OR}-Constraints},
author = {Jiang*, Yue and Stuerzlinger, Wolfgang and Zwicker, Matthias and Lutteroth, Christof},
booktitle = {Conference on Human Factors in Computing Systems},
publisher = {ACM},
series = {CHI '20},
year = {2020},
month = {Apr},
articleno = {483},
numpages = {14},
doi = {https://doi.org/10.1145/3313831.3376610},
url = {https://yuejiang-nj.github.io/papers/CHI2020_ORCSolver/project_page.html},
pdf = {papers/orcsolver.pdf},
video = {https://youtu.be/0S77vVG8btE},
teaser = {teasers/orcsolver.png},
abstract = {OR-constrained (ORC) graphical user interface layouts unify conventional constraint-based layouts with flow layouts, which enables the definition of flexible layouts that adapt to screens with different sizes, orientations, or aspect ratios with only a single layout specification. Unfortunately, solving ORC layouts with current solvers is time-consuming and the needed time increases exponentially with the number of widgets and constraints. To address this challenge, we propose ORCSolver, a novel solving technique for adaptive ORC layouts, based on a branch-and-bound approach with heuristic preprocessing. We demonstrate that ORCSolver simplifies ORC specifications at runtime and our approach can solve ORC layout specifications efficiently at near-interactive rates.},
keywords = {GUI, layout, constraints},
}
@inproceedings{putze2020eegautocorrect,
title = {Platform for Studying Self-Repairing Auto-Corrections in Mobile Text Entry Based on Brain Activity, Gaze, and Context},
author = {Putze, Felix and Ihrig*, Tilman and Schultz, Tanja and Stuerzlinger, Wolfgang},
booktitle = {Conference on Human Factors in Computing Systems},
publisher = {ACM},
series = {CHI '20},
year = {2020},
month = {Apr},
numpages = {13},
doi = {https://doi.org/10.1145/3313831.3376815},
pdf = {papers/eegautocorrect.pdf},
teaser = {teasers/eegautocorrect.png},
abstract = {Auto-correction is a standard feature of mobile text entry. While the performance of state-of-the-art auto-correct methods is usually relatively high, any errors that occur are cumbersome to repair, interrupt the flow of text entry, and challenge the user's agency over the process. In this paper, we describe a system that aims to automatically identify and repair auto-correction errors. This system comprises a multi-modal classifier for detecting auto-correction errors from brain activity, eye gaze, and context information, as well as a strategy to repair such errors by replacing the erroneous correction or suggesting alternatives. We integrated both parts in a generic Android component and thus present a research platform for studying self-repairing end-to-end systems. To demonstrate its feasibility, we performed a user study to evaluate the classification performance and usability of our approach.},
keywords = {autocorrect, EEG, errors, text entry},
}
@inproceedings{batmaz2020grip,
title = {Precision vs. Power Grip: A Comparison of Pen Grip Styles for Selection in Virtual Reality},
author = {Batmaz, Anil Ufuk and Mutasim*, Aunnoy K. and Stuerzlinger, Wolfgang},
booktitle = {Conference on Virtual Reality and {3D} User Interfaces, Abstracts and Workshops, Workshop on Novel Input Devices and Interaction Techniques at {VR}},
publisher = {IEEE},
series = {NIDIT '20},
year = {2020},
month = {Mar},
pages = {23-28},
doi = {https://doi.org/10.1109/VRW50115.2020.00012},
pdf = {papers/precisiongrip.pdf},
abstract = {While commercial Virtual Reality (VR) controllers are mostly designed to be held in a power grip, previous research showed that using pen-like devices with a precision grip can improve user performance for selection in VR, potentially even matching that achievable with a mouse. However, it is not known if the improvement is due to the grip style. In this work, 12 subjects performed a Fitts' task at 3 different depth conditions with a pen-like input device used in both a precision and power grip. Our results identify that the precision grip significantly improves user performance in VR through a significant reduction in error rate, but we did not observe a significant effect of the distance of targets from the user. We believe that our results are useful for designers and researchers to improve the usability of and user performance in VR systems.},
keywords = {3D pointing, grip},
}
@inproceedings{batmaz2020touch,
title = {Touch the Wall: Comparison of Virtual and Augmented Reality with Conventional {2D} Screen Eye-hand Coordination Training Systems},
author = {Batmaz, Anil Ufuk and Mutasim*, Aunnoy K. and Malekmakan*, Morteza and Sadr*, Elham and Stuerzlinger, Wolfgang},
booktitle = {Conference on Virtual Reality and {3D} User Interfaces},
publisher = {IEEE},
series = {VR '20},
year = {2020},
month = {Mar},
pages = {184-193},
doi = {https://doi.org/10.1109/VR46266.2020.1581205539914},
pdf = {papers/touchthewall.pdf},
teaser = {teasers/touchthewall.png},
abstract = {Previous research on eye-hand coordination training systems has investigated user performance on a wall, 2D touchscreens, and in Virtual Reality (VR). In this paper, we designed an eye-hand coordination reaction test to investigate and compare user performance in three different virtual environments (VEs) – VR, Augmented Reality (AR), and a 2D touchscreen. VR and AR conditions also included two feedback conditions – mid-air and passive haptics. Results showed that compared to AR, participants were significantly faster and made fewer errors both in 2D and VR. However, compared to VR and AR, throughput performance of the participants was significantly higher in the 2D touchscreen condition. No significant differences were found between the two feedback conditions. The results show the importance of assessing precision and accuracy in eye-hand coordination training and suggest that it is currently not advisable to use AR headsets in such systems.},
keywords = {3D pointing, eye-hand coordination, mid-air, passive haptics, augmented reality, touch},
}
@inproceedings{pham2019mightypen,
title = {Is the Pen Mightier than the Controller? A Comparison of Input Devices for Selection in Virtual and Augmented Reality},
author = {Pham*, Duc-Minh and Stuerzlinger, Wolfgang},
booktitle = {25th Symposium on Virtual Reality Software and Technology},
publisher = {ACM},
series = {VRST '19},
year = {2019},
month = {Nov},
articleno = {35},
numpages = {11},
doi = {https://doi.org/10.1145/3359996.3364264},
pdf = {papers/mightypen.pdf},
teaser = {teasers/mightypen.png},
abstract = {Controllers are currently the typical input device for commercial Virtual Reality (VR) systems. Yet, such controllers are not as efficient as other devices, including the mouse. This motivates us to investigate devices that substantially exceed the controller's performance, for both VR and Augmented Reality (AR) systems. We performed a user study to compare several input devices, including a mouse, controller, and a 3D pen-like device on a VR and AR pointing task. Our results show that the 3D pen significantly outperforms modern VR controllers in all evaluated measures and that it is comparable to the mouse. Participants also liked the 3D pen more than the controller. Finally, we show how 3D pen devices could be integrated into today's VR and AR systems.},
keywords = {3D pointing, input device},
}
@inproceedings{batmaz2019hittingwall,
title = {Hitting the Wall: Mid-Air Interaction for Eye-Hand Coordination},
author = {Batmaz, Anil Ufuk and Sun*, Xintian and Taskiran, Dogu and Stuerzlinger, Wolfgang},
booktitle = {25th Symposium on Virtual Reality Software and Technology},
publisher = {ACM},
series = {VRST '19},
year = {2019},
month = {Nov},
articleno = {30},
numpages = {5},
doi = {https://doi.org/10.1145/3359996.3364249},
pdf = {papers/hittingthewall.pdf},
video = {videos/hittingthewall.mp4},
teaser = {teasers/hittingthewall.png},
abstract = {Reaction time training systems are used to improve user performance. Until now, such setups use physical 2D flat surfaces, e.g., a 2D touch screen or buttons mounted on a wall. We designed and investigated a mid-air reaction time training system with an immersive virtual reality (VR) headset. 12 participants performed an eye-hand coordination reaction test in three conditions: both in mid-air with or without VR controller as well as with passive haptic feedback through hitting a soft-surface wall. We also altered target and cursor sizes and used a Fitts' law task to analyze user performance. According to the results, subjects were slower and their throughput was lower when they hit a solid surface to interact with virtual targets. Our results show that Fitts's model can be applied to these systems to measure and assess participant training.},
keywords = {3D pointing, mid-air, passive haptics, eye-hand coordination, augmented reality},
}
@inproceedings{machuca2019smart3dguides,
title = {{Smart3DGuides}: Making Unconstrained Immersive {3D} Drawing More Accurate},
author = {Barrera Machuca*, Mayra D. and Stuerzlinger, Wolfgang and Asente, Paul},
booktitle = {25th Symposium on Virtual Reality Software and Technology},
publisher = {ACM},
series = {VRST '19},
year = {2019},
month = {Nov},
articleno = {37},
numpages = {13},
doi = {https://doi.org/10.1145/3359996.3364254},
pdf = {papers/smart3dguides.pdf},
video = {videos/smart3dguides.mp4},
teaser = {teasers/smart3dguides.png},
abstract = {Most current commercial Virtual Reality (VR) drawing applications for creativity rely on freehand 3D drawing as their main interaction paradigm. However, the presence of the additional third dimension makes accurate freehand drawing challenging. Some systems address this problem by constraining or beautifying user strokes, which can be intrusive and can limit the expressivity of freehand drawing. In this paper, we evaluate the effectiveness of relying solely on visual guidance to increase overall drawing shape-likeness. We identified a set of common mistakes that users make while creating freehand strokes in VR and then designed a set of visual guides, the Smart3DGuides, which help users avoid these mistakes. We evaluated Smart3DGuides in two user studies, and our results show that non-constraining visual guides help users draw more accurately.},
keywords = {3D drawing, 3D sketching, 3D user interfaces, 3D modeling},
}
@inproceedings{pham2019hawkey,
title = {{HawKEY}: Efficient and Versatile Text Entry for Virtual Reality},
author = {Pham*, Duc-Minh and Stuerzlinger, Wolfgang},
booktitle = {25th Symposium on Virtual Reality Software and Technology},
publisher = {ACM},
series = {VRST '19},
year = {2019},
month = {Nov},
articleno = {21},
numpages = {11},
doi = {https://doi.org/10.1145/3359996.3364265},
pdf = {papers/hawkey.pdf},
teaser = {teasers/hawkey.png},
abstract = {Text entry is still a challenging task in modern Virtual Reality (VR) systems. The lack of efficient text entry methods limits the applications that can be used productively in VR. Previous work has addressed this issue through virtual keyboards or showing the physical keyboard in VR. While physical keyboards afford faster text entry, they usually require a seated user and an instrumented environment. We introduce a new keyboard, worn on a hawker's tray in front of the user, which affords a compact, simple, flexible, and efficient text entry solution for VR, without restricting physical movement. In our new video condition, we also show the keyboard only when the user is looking down at it. To evaluate our novel solution and to identify good keyboard visualizations, we ran a user study where we asked participants to enter both lowercase sentences as well as complex text while standing. The results show that text entry rates are affected negatively by simplistic keyboard visualization conditions and that our solution affords desktop text entry rates, even when standing.},
keywords = {3D user interfaces, text entry, augmented reality},
}
@inproceedings{sun2019sliding,
title = {Extended Sliding in Virtual Reality},
author = {Sun*, Junwei and Stuerzlinger, Wolfgang},
booktitle = {25th Symposium on Virtual Reality Software and Technology},
publisher = {ACM},
series = {VRST '19},
year = {2019},
month = {Nov},
articleno = {38},
numpages = {5},
doi = {https://doi.org/10.1145/3359996.3364251},
pdf = {papers/extendedsliding.pdf},
video = {videos/extendedsliding.mp4},
teaser = {teasers/extendedsliding.png},
abstract = {Although precise 3D positioning is not always necessary in virtual environments, it is still an important task for current and future applications of Virtual Reality (VR), including 3D modelling, engineering, and scientific applications. We focus on 3D positioning techniques in immersive environments that use a 6DOF controller as input device and present a new technique that improves 3D positioning performance in VR, in both speed and accuracy. Towards this goal, we adapted an extended sliding technique to VR systems with a controller as input device and compared it with previously presented 3DOF positioning techniques. The results showed that our new Extended VR Sliding technique significantly improved the accuracy for 3D positioning tasks, especially for targets in contact with the scene.},
keywords = {3D manipulation, 3D positioning, sliding},
}
@inproceedings{hayatpur2019planeraypoint,
title = {Plane, Ray, and Point: Enabling Precise Spatial Manipulations with Shape Constraints},
author = {Hayatpur+, Devamardeep and Heo, Seongkook and Xia, Haijun and Stuerzlinger, Wolfgang and Wigdor, Daniel},
booktitle = {32nd Annual Symposium on User Interface Software and Technology},
publisher = {ACM},
series = {UIST '19},
year = {2019},
month = {Oct},
pages = {1185–1195},
doi = {https://doi.org/10.1145/3332165.3347916},
pdf = {papers/planeraypoint.pdf},
video = {videos/planeraypoint.mp4},
teaser = {teasers/planeraypoint.png},
abstract = {We present Plane, Ray, and Point, a set of interaction techniques that utilizes shape constraints to enable quick and precise object alignment and manipulation in virtual reality. Users create the three types of shape constraints, Plane, Ray, and Point, by using symbolic gestures. The shape constraints are used like scaffoldings and limit and guide the movement of virtual objects that collide or intersect with them. The same set of gestures can be performed with the other hand, which allow users to further control the degrees of freedom for precise and constrained manipulation. The combination of shape constraints and bimanual gestures yield a rich set of interaction techniques to support object transformation. An exploratory study conducted with 3D design experts and novice users found the techniques to be useful in 3D scene design workflows and easy to learn and use.},
keywords = {3D manipulation},
}
@inproceedings{machuca2019spatial,
title = {The Effect of Spatial Ability on Immersive {3D} Drawing},
author = {Barrera Machuca*, Mayra D. and Stuerzlinger, Wolfgang and Asente, Paul},
booktitle = {Conference on Creativity and Cognition},
publisher = {ACM},
series = {C&C '19},
year = {2019},
month = {Jun},
pages = {173–186},
doi = {https://doi.org/10.1145/3325480.3325489},
pdf = {papers/drawingspatialability.pdf},
teaser = {teasers/drawingspatialability.png},
abstract = {Virtual Reality (VR) headsets have made immersive 3D drawing available to the general public. However, compared to 2D drawing, the presence of an additional dimension makes sketching in VR challenging, since creating precise strokes that are positioned as intended in all three dimensions imposes higher demands on the users' perception, motor and spatial skills. Another challenge users face is creating accurate shapes in which strokes are positioned correctly relative to previous ones, as they may need to use different views to plan their next hand movement. In this paper, we analyze the behaviours of users with different spatial abilities while drawing in VR. Our results indicate that there are different types of behaviours that affect different aspects of the sketches. We also found that the user's spatial ability affects the shape of the drawing, but not the line precision. Finally, we give recommendations for designing 3D drawing interfaces.},
keywords = {virtual reality, 3D sketching, 3D drawing, 3D modeling, spatial cognition},
}
@inproceedings{papoi20193dspeedcontrol,
title = {Improved Automatic Speed Control for {3D} Navigation},
author = {Papoi*, Domi and Stuerzlinger, Wolfgang},
booktitle = {Advances in Computer Graphics},
publisher = {Springer},
series = {CGI '19},
year = {2019},
month = {Jun},
volume = {LNCS 11542},
pages = {278-290},
doi = {https://doi.org/10.1007/978-3-030-22514-8_23},
pdf = {papers/navspeed.pdf},
video = {videos/navspeed.mp4},
teaser = {teasers/navspeed.png},
abstract = {As technology progresses, it is possible to increase the size and complexity of 3D virtual environments. Thus, we need deal with multiscale virtual environments today. Ideally, the user should be able to navigate such environments efficiently and robustly, which requires control of the user speed during navigation. Manual speed control across multiple scales of magnitude suffers from issues such as overshooting behaviors and introduces additional complexity. Most previously presented methods to automatically control the speed of navigation do not generalize well to environments with varying scales. We present an improved method to automatically control the speed of the user in 3D virtual environment navigation. The main benefit of our approach is that it automatically adapts the navigation speed in a manner that enables efficient navigation with maximum freedom, while still avoiding collisions. The results of a usability test show a significant reduction in completion time for a multi-scale navigation task.},
keywords = {3D navigation, speed control},
note = {Computer Graphics International},
}
@inproceedings{blum2019immersiveanalytics,
title = {Immersive Analytics Sensemaking on Different Platforms},
author = {Blum*, Sebastian and Cetin*, Gokhan and Stuerzlinger, Wolfgang},
booktitle = {Winter School of Computer Graphics},
series = {WSCG '19, CSRN 2902},
issn = {2464-4617},
year = {2019},
month = {Jan},
pages = {69-80},
url = {http://wscg.zcu.cz/DL/wscg_DL.htm},
doi = {https://doi.org/10.24132/CSRN.2019.2902.2.9},
pdf = {papers/VAonLHRD+VR.pdf},
teaser = {teasers/VAonLHRD+VR.png},
abstract = {In this work we investigated sensemaking activities on different immersive platforms. We observed user behaviours during a classification task on a very large wall-display system (experiment I) and in a modern Virtual Reality headset (experiment II). In experiment II, we also evaluated a condition with a VR headset with an extended field of view, through a sparse peripheral display. We evaluated the results across the two studies by analyzing quantitative and qualitative data, such as task completion time, number of classifications, followed strategies, and shape of clusters. The results showed differences in user behaviours between the different immersive platforms, i.e., the very large display wall and the VR headset. Even though quantitative data showed no significant differences, qualitatively, users used additional strategies on the wall-display, which hints at a deeper level of sensemaking compared to a VR Headset. The qualitative and quantitative results of the comparison between VR Headsets do not indicate that users perform differently with a VR Headset with an extended field of view.},
keywords = {immersive analytics, virtual reality, large display system, immersive display system, large display interaction, V4Space},
}
@inproceedings{alharbi2019wisetype,
title = {{WiseType}: A Tablet Keyboard with Color-Coded Visualization and Various Editing Options for Error Correction},
author = {Alharbi*, Ohoud and Arif, Ahmed Sabbir and Stuerzlinger, Wolfgang and Dunlop, Mark D. and Komninos, Andreas},
booktitle = {Graphics Interface},
series = {GI '19},
year = {2019},
month = {May},
articleno = {4},
numpages = {10},
doi = {https://doi.org/10.20380/GI2019.04},
pdf = {papers/wisetype.pdf},
video = {videos/wisetype.mp4},
teaser = {teasers/wisetype.png},
abstract = {To address the problem of improving text entry accuracy in mobile devices, we present a new tablet keyboard that offers both immediate and delayed feedback on language quality through auto-correction, prediction, and grammar checking. We combine different visual representations for grammar and spelling errors, accepted predictions, and auto-corrections. and also support interactive swiping/tapping features and improved interaction with previous errors, predictions, and auto-corrections. Additionally, we added smart error correction features to the system to decrease the overhead of correcting errors and to decrease the number of operations. We designed our new input method with an iterative user-centered approach through multiple pilots. We conducted a lab-based study with a refined experimental methodology and found that WiseType outperforms a standard keyboard in terms of text entry speed and error rate. The study shows that color-coded text background highlighting and underlining of potential mistakes in combination with fast correction methods can improve both writing speed and accuracy.},
keywords = {text entry, autocorrect, errors},
award = {This work received a Michael J Sweeney Best HCI Student Paper Award},
}
@inproceedings{sun2019selecting,
title = {Selecting and Sliding Hidden Objects in {3D} Desktop Environments},
author = {Sun*, Junwei and Stuerzlinger, Wolfgang},
booktitle = {Graphics Interface},
series = {GI '19},
year = {2019},
month = {May},
articleno = {8},
numpages = {8},
doi = {https://doi.org/10.20380/GI2019.08},
pdf = {papers/transparency.pdf},
video = {videos/transparency.mp4},
teaser = {teasers/transparency.png},
abstract = {Selecting and positioning objects in 3D space are fundamental tasks in 3D user interfaces. We present two new techniques to improve 3D selection and positioning. We first augment 3D user interfaces with a new technique that enables users to select objects that are hidden from the current viewpoint. This layer-based technique for selecting hidden objects works for arbitrary objects and scenes. We then also extend a mouse-based sliding technique to work even if the manipulated object is hidden behind other objects, by making the manipulated object always fully visible through a transparency mask during drag-and-drop positioning. Our user study shows that with the new techniques, users can easily select hidden objects and that sliding with transparency performs faster than the common 3D widgets technique.},
keywords = {3D manipulation, 3D positioning, sliding, transparency},
}
@inproceedings{machuca2019stereo,
title = {The Effect of Stereo Display Deficiencies on Virtual Hand Pointing},
author = {Barrera Machuca*, Mayra D. and Stuerzlinger, Wolfgang},
booktitle = {Conference on Human Factors in Computing Systems},
publisher = {ACM},
series = {CHI '19},
year = {2019},
month = {May},
articleno = {207},
numpages = {14},
doi = {https://doi.org/10.1145/3290605.3300437},
pdf = {papers/virtualhandfitts.pdf},
video = {videos/virtualhandfitts.mp4},
teaser = {teasers/virtualhandfitts.png},
abstract = {The limitations of stereo display systems affect depth perception, e.g., due to the vergence-accommodation conflict or diplopia. We performed three studies to understand how stereo display deficiencies impact 3D pointing for targets in front of a screen and close to the user, i.e., in peripersonal space. Our first two experiments compare movements with and without a change in visual depth for virtual respectively physical targets. Results indicate that selecting targets along the depth axis is slower and has less throughput for virtual targets, while physical pointing demonstrates the opposite result. We then propose a new 3D extension for Fitts' law that models the effect of stereo display deficiencies. Next, our third experiment verifies the model and measures more broadly how the change in visual depth between targets affects pointing performance in peripersonal space and confirms significant effects on time and throughput. Finally, we discuss implications for 3D user interface design.},
keywords = {3D pointing, mid-air, stereo},
}
@inproceedings{yamanaka2019lassomodel,
title = {Modeling Fully and Partially Constrained Lasso Movements in a Grid of Icons},
author = {Yamanaka, Shota and Stuerzlinger, Wolfgang},
booktitle = {Conference on Human Factors in Computing Systems},
publisher = {ACM},
series = {CHI '19},
year = {2019},
month = {May},
articleno = {120},
numpages = {12},
doi = {https://doi.org/10.1145/3290605.3300350},
pdf = {papers/gridlassomodel.pdf},
teaser = {teasers/gridlassomodel.png},
abstract = {Lassoing objects is a basic function in illustration software and presentation tools. Yet, for many common object arrangements lassoing is sometimes time-consuming to perform and requires precise pen operation. In this work, we studied lassoing movements in a grid of objects similar to icons. We propose a quantitative model to predict the time to lasso such objects depending on the margins between icons, their sizes, and layout, which all affect the number of stopping and crossing movements. Results of two experiments showed that our models predict fully and partially constrained movements with high accuracy. We also analyzed the speed profiles and pen stroke trajectories and identified deeper insights into user behaviors, such as that an unconstrained area can induce higher movement speeds even in preceding path segments.},
keywords = {lasso, steering, group selection},
}
@inproceedings{jiang2019orclayout,
title = {{ORC} Layout: Adaptive {GUI} Layout with {OR}-Constraints},
author = {Jiang*, Yue and Du*, Ruofei and Lutteroth, Christof and Stuerzlinger, Wolfgang},
booktitle = {Conference on Human Factors in Computing Systems},
publisher = {ACM},
series = {CHI '19},
year = {2019},
month = {May},
articleno = {413},
numpages = {12},
doi = {https://doi.org/10.1145/3290605.3300643},
pdf = {papers/orclayout.pdf},
video = {videos/orclayout.mp4},
teaser = {teasers/orclayout.png},
abstract = {We propose a novel approach for constraint-based graphical user interface (GUI) layout based on OR-constraints (ORC) in standard soft/hard linear constraint systems. ORC layout unifies grid layout and flow layout, supporting both their features as well as cases where grid and flow layouts individually fail. We describe ORC design patterns that enable designers to safely create flexible layouts that work across different screen sizes and orientations. We also present the ORC Editor, a GUI editor that enables designers to apply ORC in a safe and effective manner, mixing grid, flow and new ORC layout features as appropriate. We demonstrate that our prototype can adapt layouts to screens with different aspect ratios with only a single layout specification, easing the burden of GUI maintenance. Finally, we show that ORC specifications can be modified interactively and solved efficiently at runtime.},
keywords = {GUI, layout, constraints},
}
@inproceedings{kruijff2019flexurface,
title = {Multilayer Haptic Feedback for Pen-Based Tablet Interaction},
author = {Kruijff, Ernst and Biswas*, Saugata and Trepkowski*, Christina and Maiero*, Jens and Ghinea, George and Stuerzlinger, Wolfgang},
booktitle = {Conference on Human Factors in Computing Systems},
publisher = {ACM},
series = {CHI '19},
year = {2019},
month = {May},
articleno = {143},
numpages = {14},
doi = {https://doi.org/10.1145/3290605.3300373},
pdf = {papers/flexurface.pdf},
video = {videos/flexurface.mp4},
teaser = {teasers/flexurface.png},
abstract = {We present a novel, multilayer interaction approach that enables state transitions between spatially above-screen and 2D on-screen feedback layers. This approach supports the exploration of haptic features that are hard to simulate using rigid 2D screens. We accomplish this by adding a haptic layer above the screen that can be actuated and interacted with (pressed on) while the user interacts with on-screen content using pen input. The haptic layer provides variable firmness and contour feedback, while its membrane functionality affords additional tactile cues like texture feedback. Through two user studies, we look at how users can use the layer in haptic exploration tasks, showing that users can discriminate well between different firmness levels, and can perceive object contour characteristics. Demonstrated also through an art application, the results show the potential of multilayer feedback to extend on-screen feedback with additional widget, tool and surface properties, and for user guidance.},
keywords = {haptics, multilayer, pen},
}
@inproceedings{batmaz2019nidit,
title = {Effects of {3D} Rotational Jitter and Selection Methods on {3D} Pointing Tasks},
author = {Batmaz, Anil Ufuk and Stuerzlinger, Wolfgang},
booktitle = {Workshop on Novel Input Devices and Interaction Techniques at {VR}},
publisher = {IEEE},
series = {NIDIT '19},
year = {2019},
month = {Mar},
pages = {1687-1692},
doi = {https://doi.org/10.1109/VR.2019.8798038},
pdf = {papers/rotjitterselection.pdf},
abstract = {3D pointing is an integral part of Virtual Reality interaction. Typical pointing devices rely on 3D trackers and are thus subject to fluctuations in the reported pose, i.e., jitter. In this work, we explored how different levels of rotational jitter affect pointing performance and if different selection methods can mitigate the effects of jitter. Towards this, we designed a Fitts' Law experiment with three selection methods. In the first method, subjects used a single controller to position and select the object. In the second method, subjects used the controller in their dominant hand to point at objects and the trigger button of a second controller, held in their non-dominant hand, to select objects. Finally, subjects used the controller in their dominant hand to point the objects and pressed the space bar on a keyboard to select the object in the third condition. During the pointing task we added five different levels of jitter: no jitter, ±0.5°, ±1°, and ±2° uniform noise, as well as White Gaussian noise with 1° standard deviation. Results showed that the Gaussian noise and ±2° of jitters significantly reduced the throughput of the participants. Moreover, subjects made fewer errors when they performed the experiment with two controllers. Our results inform the design of 3D user interfaces, input devices and interaction techniques.},
keywords = {3D pointing, jitter},
}
@inproceedings{batmaz2019stereo,
title = {Do Head-Mounted Display Stereo Deficiencies Affect {3D} Pointing Tasks in {AR} and {VR}?},
author = {Batmaz, Anil Ufuk and Barrera Machuca*, Mayra D. and Pham*, Duc-Minh and Stuerzlinger, Wolfgang},
booktitle = {Conference on Virtual Reality and {3D} User Interfaces},
publisher = {IEEE},
series = {VR '19},
year = {2019},
month = {Mar},
pages = {585-592},
doi = {https://doi.org/10.1109/VR.2019.8797975},
pdf = {papers/virtualhandARVR.pdf},
video = {videos/virtualhandARVR.mp4},
teaser = {teasers/virtualhandARVR.png},
abstract = {Most AR and VR headsets use stereoscopic displays to show virtual objects in 3D. However, the limitations of current stereo display systems affect depth perception through conflicting depth cues, which then also affect virtual hand interaction in peri-personal space, i.e., within arm's reach. We performed a Fitts' law experiment to better understand the impact of stereo display deficiencies of AR and VR headsets on pointing at close-by targets arranged laterally or along the line of sight. According to our results, the movement direction and the corresponding change in target depth affect pointing time and throughput; subjects' movements towards/away from their head were slower and less accurate than their lateral movements (left/right). However, even though subjects moved faster in AR, we did not observe a significant difference for pointing performance between AR and VR headsets, which means that previously identified differences in depth perception between these platforms seem to have no strong effect on interaction. Our results also help 3D user interface designers understand how changes in target depth affect users' performance in different movement directions in AR and VR.},
keywords = {3D pointing, mid-air, stereo},
}
@inproceedings{marquardt2018audiotactile,
title = {Audio-Tactile Proximity Feedback for Enhancing {3D} Manipulation},
author = {Marquardt*, Alexander and Kruijff, Ernst and Trepkowski*, Christina and Maiero*, Jens and Schwandt, Andrea and Hinkenjann, André and Stuerzlinger, Wolfgang and Schöning, Johannes},
booktitle = {24th Symposium on Virtual Reality Software and Technology},
publisher = {ACM},
series = {VRST '18},
year = {2018},
month = {Nov},
articleno = {2},
numpages = {10},
doi = {https://doi.org/10.1145/3281505.3281525},
pdf = {papers/tactaproximity.pdf},
teaser = {teasers/tactaproximity.png},
abstract = {In presence of conflicting or ambiguous visual cues in complex scenes, performing 3D selection and manipulation tasks can be challenging. To improve motor planning and coordination, we explore audio-tactile cues to inform the user about the presence of objects in hand proximity, e.g., to avoid unwanted object penetrations. We do so through a novel glove-based tactile interface, enhanced by audio cues. Through two user studies, we illustrate that proximity guidance cues improve spatial awareness, hand motions, and collision avoidance behaviors, and show how proximity cues in combination with collision and friction cues can significantly improve performance.},
keywords = {haptics, tactile feedback, 3D manipulation},
}
@inproceedings{marquardt2018guidance,
title = {Tactile Hand Motion and Pose Guidance for {3D} Interaction},
author = {Marquardt*, Alexander and Maiero*, Jens and Kruijff, Ernst and Trepkowski*, Christina and Schwandt, Andrea and Hinkenjann, André and Schöning, Johannes and Stuerzlinger, Wolfgang},
booktitle = {24th Symposium on Virtual Reality Software and Technology},
publisher = {ACM},
series = {VRST '18},
year = {2018},
month = {Nov},
articleno = {3},
numpages = {10},
doi = {https://doi.org/10.1145/3281505.3281526},
pdf = {papers/tactaguide.pdf},
video = {videos/tactaguide.mp4},
teaser = {teasers/tactaguide.png},
abstract = {We present a novel forearm-and-glove tactile interface that can enhance 3D interaction by guiding hand motor planning and coordination. In particular, we aim to improve hand motion and pose actions related to selection and manipulation tasks. Through our user studies, we illustrate how tactile patterns can guide the user, by triggering hand pose and motion changes, for example to grasp (select) and manipulate (move) an object. We discuss the potential and limitations of the interface, and outline future work.},
keywords = {haptics, guidance, tactile feedback, 3D manipulation},
}
@inproceedings{cetin2018valarge,
title = {Visual Analytics on Large Displays: Exploring User Spatialization and How Size and Resolution Affect Task Performance},
author = {Cetin*, Gokhan and Stuerzlinger, Wolfgang and Dill, John},
booktitle = {Symposium on Big Data Visual Analytics},
publisher = {IEEE},
series = {BDVA '18},
year = {2018},
month = {Oct},
pages = {21-30},
doi = {https://doi.org/10.1109/BDVA.2018.8534027},
pdf = {papers/space2VA.pdf},
teaser = {teasers/space2VA.png},
abstract = {Large, high-resolution displays (LHRDs) have been shown to enable increased productivity over conventional monitors. Previous work has identified the benefits of LHRDs for Visual Analytics tasks, where the user is analyzing complex data sets. However, LHRDs are fundamentally different from desktop and mobile computing environments, presenting some unique usability challenges and opportunities, and need to be better understood. There is thus a need for additional studies to analyze the impact of LHRD size and display resolution on content spatialization strategies and Visual Analytics task performance. We present the results of two studies of the effects of physical display size and resolution on analytical task successes and also analyze how participants spatially cluster visual content in different display conditions. Overall, we found that navigation technique preferences differ significantly among users, that the wide range of observed spatialization types suggest several different analysis techniques are adopted, and that display size affects clustering task performance whereas display resolution does not.},
keywords = {visual analytics, visualization, large display system, large display interaction, V4Space},
}
@inproceedings{elmeseery2018dynspace,
title = {Multiple Workspaces in Visual Analytics},
author = {El Meseery*, Maha and Wu*, Yuyao and Stuerzlinger, Wolfgang},
booktitle = {Symposium on Big Data Visual Analytics},
publisher = {IEEE},
series = {BDVA '18},
year = {2018},
month = {Oct},
pages = {70-81},
doi = {https://doi.org/10.1109/BDVA.2018.8534019},
pdf = {papers/dynspace.pdf},
video = {videos/dynspace.mp4},
teaser = {teasers/dynspace.png},
abstract = {Exploratory visual analysis is an iterative process, where analysts often start from an overview of the data. Subsequently, they often pursue different hypotheses through multiple rounds of interaction and analysis. Commercial visualization packages support mostly a model with a single analysis path, where the system view represents only the final state of the users' current analysis. In this paper, we investigate the benefit of using multiple workspaces to support alternative analyses, enabling users to create different workspaces to pursue multiple analysis paths at the same time. We implemented a prototype for multiple workspaces using a multi-tab design in a visual analytics system. The results of our user studies show that multiple workspaces: enable analysts to work on concurrent tasks, work well for organizing an analysis, and make it easy to revisit previous parts of their work.},
keywords = {visual analytics, visualization, alternatives, scenarios},
}
@inproceedings{machuca2018multiplanes,
title = {Multiplanes: Assisted Freehand VR Sketching},
author = {Barrera Machuca*, Mayra D. and Asente, Paul and Lu*, Jingwan and Kim, Byungmoon and Stuerzlinger, Wolfgang},
booktitle = {Symposium on Spatial User Interaction},
publisher = {ACM},
series = {SUI '18},
year = {2018},
month = {Oct},
pages = {36-47},
doi = {https://doi.org/10.1145/3267782.3267786},
pdf = {papers/multiplanes.pdf},
video = {videos/multiplanes.mp4},
teaser = {teasers/multiplanes.png},
abstract = {The presence of a third dimension makes accurate drawing in virtual reality (VR) more challenging than 2D drawing. These challenges include higher demands on spatial cognition and motor skills, as well as the potential for mistakes caused by depth perception errors. We present Multiplanes, a VR drawing system that supports both the flexibility of freehand drawing and the ability to draw accurate shapes in 3D by affording both planar and beautified drawing. The system was designed to address the above-mentioned challenges. Multiplanes generates snapping planes and beautification trigger points based on previous and current strokes and the current controller pose. Based on geometrical relationships to previous strokes, beautification trigger points serve to guide the user to reach specific positions in space. The system also beautifies user's strokes based on the most probable intended shape while the user is drawing them. With Multiplanes, in contrast to other systems, users do not need to manually activate such guides, allowing them to focus on the creative process.},
keywords = {3D sketching, 3D drawing, 3D modeling, 3D user interfaces},
}
@inproceedings{sun2018comparing,
title = {Comparing Input Methods and Cursors for {3D} Positioning with Head-Mounted Displays},
author = {Sun*, Junwei and Stuerzlinger, Wolfgang and Riecke, Bernhard E.},
booktitle = {15th Symposium on Applied Perception},
publisher = {ACM},
series = {SAP '18},
year = {2018},
month = {Aug},
articleno = {8},
numpages = {8},
doi = {https://doi.org/10.1145/3225153.3225167},
pdf = {papers/input4VR.pdf},
teaser = {teasers/input4VR.png},
abstract = {Moving objects is an important task in 3D user interfaces. In this work, we focus on (precise) 3D object positioning in immersive virtual reality systems, especially head-mounted displays (HMDs). To evaluate input method performance for 3D positioning, we focus on an existing sliding algorithm, in which objects slide on any contact surface. Sliding enables rapid positioning of objects in 3D scenes on a desktop system but is yet to be evaluated in an immersive system. We performed a user study that compared the efficiency and accuracy of different input methods (mouse, hand-tracking, and trackpad) and cursor display conditions (stereo cursor and one-eyed cursor) for 3D positioning tasks with the HTC Vive. The results showed that the mouse outperformed hand-tracking and the trackpad, in terms of efficiency and accuracy. Stereo cursor and one-eyed cursor did not demonstrate a significant difference in performance, yet the stereo cursor condition was rated more favourable. For situations where the user is seated in immersive VR, the mouse is thus still the best input device for precise 3D positioning.},
keywords = {3D positioning, input device},
}
@inproceedings{yamanaka2018steering,
title = {Steering Through Successive Objects},
author = {Yamanaka*, Shota and Stuerzlinger, Wolfgang and Miyashita, Homei},
booktitle = {Conference on Human Factors in Computing Systems},
publisher = {ACM},
series = {CHI '18},
year = {2018},
month = {Apr},
articleno = {603},
numpages = {13},
doi = {https://doi.org/10.1145/3173574.3174177},
pdf = {papers/steervscross.pdf},
teaser = {teasers/steervscross.png},
abstract = {We investigate stroking motions through successive objects with styli. There are several promising models for stroking motions, such as crossing tasks, which require endpoint accuracy of a stroke, or steering tasks, which require continuous accuracy throughout the trajectory. However, a task requiring users to repeatedly steer through constrained path segments has never been studied, although such operations are needed in GUIs, e.g., for selecting icons or objects on illustration software through lassoing. We empirically confirmed that the interval, trajectory width, and obstacle size significantly affect the movement speed. Existing models can not accurately predict user performance in such tasks. We found several unexpected results such as that steering through denser objects sometimes required less times than expected. Speed profile analysis showed the reasons behind such behaviors, such as participants' anticipation strategies. We also discuss the applicability of exiting performance models and revisions.},
keywords = {steering, lasso, group selection},
}
@inproceedings{ortega2018wiggle,
title = {Pointing at Wiggle {3D} Displays},
author = {Ortega, Michael and Stuerzlinger, Wolfgang},
booktitle = {Conference on Virtual Reality and {3D} User Interfaces},
publisher = {IEEE},
series = {VR '18},
year = {2018},
month = {Mar},
pages = {335-340},
doi = {https://doi.org/10.1109/VR.2018.8447552},
pdf = {papers/wigglepoint.pdf},
video = {videos/wigglepoint.m4v},
teaser = {teasers/wigglepoint.png},
abstract = {This paper presents two new pointing techniques for wiggle 3D displays, which present the 2D projection of 3D content with automatic (rotatory) motion parallax. Standard pointing at targets in wiggle 3D displays is challenging as the content is constantly in motion. The two pointing techniques presented here take advantage of the cursor's current position or the user's gaze direction for collocating the wiggle rotation center and potential targets. We evaluate the performance of the pointing techniques with a novel methodology that integrates 3D distractors into the ISO-9241-9 standard task. The experimental results indicate that the new techniques are significantly more efficient than standard pointing techniques in wiggle 3D displays. Given that we observed no performance variation for different targets, our new techniques seem to negate any interaction performance penalties of wiggle 3D displays.},
keywords = {3D pointing},
}
@inproceedings{nguyenvo2018referenceframe,
title = {Simulated Reference Frame: A Cost-Effective Solution to Improve Spatial Orientation in {VR}},
author = {Nguyen-Vo*, Thinh and Riecke, Bernhard E. and Stuerzlinger, Wolfgang},
booktitle = {Conference on Virtual Reality and {3D} User Interfaces},
publisher = {IEEE},
series = {VR '18},
year = {2018},
month = {Mar},
pages = {415-422},
doi = {https://doi.org/10.1109/VR.2018.8446383},
pdf = {papers/spatialreferenceframe.pdf},
teaser = {teasers/spatialreferenceframe.png},
abstract = {Virtual Reality (VR) is increasingly used in spatial cognition research, as it offers high experimental control in naturalistic multimodal environments, which is hard to achieve in real-world settings. Although recent technological advances offer a high level of photorealism, locomotion in VR is still restricted because people might not perceive their self-motion as they would in the real world. This might be related to the inability to use embodied spatial orientation processes, which support automatic and obligatory updating of our spatial awareness. Previous research has identified the roles reference frames play in retaining spatial orientation. Here, we propose using visually overlaid rectangular boxes, simulating reference frames in VR, to provide users with a better insight into spatial direction in landmark-free virtual environments. The current mixed-method study investigated how different variations of the visually simulated reference frames might support people in a navigational search task. Performance results showed that the existence of a simulated reference frame yields significant effects on participants completion time and travel distance. Though a simulated CAVE translating with the navigator (one of the simulated reference frames) did not provide significant benefits, the simulated room (another simulated reference frame depicting a rest frame) significantly boosted user performance in the task as well as improved participants preference in the post-experiment evaluation. Results suggest that adding a visually simulated reference frame to VR applications might be a cost-effective solution to the spatial disorientation problem in VR.},
keywords = {3D navigation},
}
@inproceedings{tran2017virtualarm,
title = {Effects of Virtual Arm Representations on Interaction in Virtual Environments},
author = {Tran+, Tanh Quang and Shin*, HyunJu and Stuerzlinger, Wolfgang and Han, JungHyun},
booktitle = {23rd Symposium on Virtual Reality Software and Technology},
publisher = {ACM},
series = {VRST '17},
year = {2017},
month = {Nov},
articleno = {40},
numpages = {9},
doi = {https://doi.org/10.1145/3139131.3139149},
pdf = {papers/armrepresentation.pdf},
teaser = {teasers/armrepresentation.png},
abstract = {Many techniques for visualization and interaction that potentially increase user performance have been studied in the growing field of virtual reality. However, the effects of virtual-arm representations on users' performance and perception in selection tasks have not been studied before. This paper presents the results of a user study of three different representations of the virtual arm: "hand only," "hand+forearm," and "whole arm" which includes the upper arm. In addition to the representations' effects on performance and perception in selection tasks, we investigate how the users' performance changes depending on whether collisions with objects are allowed or not. The relationship between the virtual-arm representations and the senses of agency and ownership are also explored. Overall, we found that the "whole arm" condition performed worst.},
keywords = {3D pointing, presence},
}
@inproceedings{putze2017eeg,
title = {Automatic Classification of Auto-Correction Errors in Predictive Text Entry Based on {EEG} and Context Information},
author = {Putze, Felix and Schünemann*, Maik and Schultz, Tanja and Stuerzlinger, Wolfgang},
booktitle = {19th Conference on Multimodal Interaction},
publisher = {ACM},
series = {ICMI '17},
year = {2017},
month = {Nov},
pages = {137–145},
doi = {https://doi.org/10.1145/3136755.3136784},
pdf = {papers/classifyAutoCorrectEEG.pdf},
teaser = {teasers/classifyAutoCorrectEEG.png},
abstract = {State-of-the-art auto-correction methods for predictive text entry systems work reasonably well, but can never be perfect due to the properties of human language. We present an approach for the automatic detection of erroneous auto-corrections based on brain activity and text-entry-based context features. We describe an experiment and a new system for the classification of human reactions to auto-correction errors. We show how auto-correction errors can be detected with an average accuracy of 85%.},
keywords = {EEG, text entry, autocorrect, errors},
}
@inproceedings{zaman2017mace,
title = {{MACE}: A New Interface for Comparing and Editing of Multiple Alternative Documents for Generative Design},
author = {Zaman, Loutfouz and Stuerzlinger, Wolfgang and Neugebauer+, Christian},
booktitle = {Symposium on Document Engineering},
publisher = {ACM},
series = {DocEng '17},
year = {2017},
month = {Sep},
pages = {67–76},
doi = {https://doi.org/10.1145/3103010.3103013},
pdf = {papers/mace.pdf},
teaser = {teasers/mace.png},
abstract = {We present a new interface for interactive comparisons of more than two alternative documents in the context of a generative design system that uses generative data-flow networks defined via directed acyclic graphs. To better show differences between such networks, we emphasize added, deleted, (un)changed nodes and edges. We emphasize differences in the output as well as parameters using highlighting and enable post-hoc merging of the state of a parameter across a selected set of alternatives. To minimize visual clutter, we introduce new difference visualizations for selected nodes and alternatives using additive and subtractive encodings, which improve readability and keep visual clutter low. We analyzed similarities in networks from a set of alternative designs produced by architecture students and found that the number of similarities outweighs the differences, which motivates use of subtractive encoding. We ran a user study to evaluate the two main proposed difference visualization encodings and found that they are equally effective.},
keywords = {alternatives, difference visualization, design},
}
@inproceedings{zeidler2017automatic,
title = {Automatic Generation of User Interface Layouts for Alternative Screen Orientations},
author = {Zeidler*, Clemens and Weber, Gerald and Stuerzlinger, Wolfgang and Lutteroth, Christof},
booktitle = {Human-Computer Interaction},
publisher = {Springer},
series = {INTERACT '17},
year = {2017},
month = {Sep},
volume = {LNCS 10513},
pages = {13-35},
doi = {https://doi.org/10.1007/978-3-319-67744-6_2},
pdf = {papers/autoorientlayout.pdf},
video = {videos/autoorientlayout.mp4},
teaser = {teasers/autoorientlayout.png},
abstract = {Creating multiple layout alternatives for graphical user interfaces to accommodate different screen orientations for mobile devices is labor intensive. Here, we investigate how such layout alternatives can be generated automatically from an initial layout. Providing good layout alternatives can inspire developers in their design work and support them to create adaptive layouts. We performed an analysis of layout alternatives in existing apps and identified common real-world layout transformation patterns. Based on these patterns we developed a prototype that generates landscape and portrait layout alternatives for an initial layout. In general, there is a very large number of possibilities of how widgets can be rearranged. For this reason we developed a classification method to identify and evaluate "good" layout alternatives automatically. From this set of "good" layout alternatives, designers can choose suitable layouts for their applications. In a questionnaire study we verified that our method generates layout alternatives that appear well structured and are easy to use.},
keywords = {GUI, layout},
award = {This work received a Reviewer's Choice Award},
}
@inproceedings{bjerre2017predictive,
title = {Predictive Model for Group Selection Performance on Touch Devices},
author = {Bjerre+, Per and Christensen+, Allan and Pedersen+, Andreas Køllund and Pedersen+, Simon André and Stuerzlinger, Wolfgang and Stenholt, Rasmus},
booktitle = {Human-Computer Interaction, Interaction Contexts},
publisher = {Springer},
series = {HCI International '17},
year = {2017},
month = {Jul},
volume = {LNCS 10272},
pages = {142-161},
doi = {https://doi.org/10.1007/978-3-319-58077-7_12},
pdf = {papers/lazytouch.pdf},
teaser = {teasers/lazytouch.png},
abstract = {Users spend hours making selections with ineffective tools, we therefore examine selection methods for efficiency in various touch trials. In a preliminary study three alternative selection methods were identified, we compared these to a smart selection tool. The study showed that a single selection method was the fastest; however, when the amount of targets increased, a multiple selection tool became more efficient. A secondary study with more targets revealed similar results. We therefore examined the single selection method against traditional selection methods in a user study. The results reveal a model of the average action and time cost for all methods within the parameters of mental preparation and target addition. The study revealed that the most favored selection methods were a lasso and brush selection tool. The study provides evidence towards a predictive model of selection performance for multiple target selection trials.},
keywords = {group selection, touch},
}
@inproceedings{yamanaka2017steering,
title = {Steering Through Sequential Linear Path Segments},
author = {Yamanaka*, Shota and Stuerzlinger, Wolfgang and Miyashita, Homei},
booktitle = {Conference on Human Factors in Computing Systems},
publisher = {ACM},
series = {CHI '17},
year = {2017},
month = {May},
pages = {232–243},
doi = {https://doi.org/10.1145/3025453.3025836},
pdf = {papers/pathsequencesteering.pdf},
teaser = {teasers/pathsequencesteering.png},
abstract = {The steering law models human motor performance and has been verified to hold for a single linear and/or circular path. Some extensions investigated steering around corners. Yet, little is known about human performance in navigating joined linear paths, i.e., successions of path segments with different widths. Such operations appear in graphical user interface tasks, including lasso operations in illustration software. In this work, we conducted several experiments involving joined paths. The results show that users significantly changed their behavior, and that this strategy change can be predicted beforehand. A simple model summing the two indexes of difficulty (IDs) for each path predicts movement time well, but more sophisticated models were also evaluated. The best model in terms of both of R2 and AIC values includes the ID of the crossing operation to enter the second path.},
keywords = {steering, lasso, group selection},
}
@inproceedings{jang2017fatigue,
title = {Modeling Cumulative Arm Fatigue in Mid-Air Interaction Based on Perceived Exertion and Kinetics of Arm Motion},
author = {Jang*, Sujin and Stuerzlinger, Wolfgang and Ambike, Satyajit and Ramani, Karthik},
booktitle = {Conference on Human Factors in Computing Systems},
publisher = {ACM},
series = {CHI '17},
year = {2017},
month = {May},
pages = {3328–3339},
doi = {https://doi.org/10.1145/3025453.3025523},
url = {https://github.com/CDesignGitHub/Cumulative-Arm-Fatigue_CHI-2017},
pdf = {papers/cumulativearmfatigue.pdf},
teaser = {teasers/cumulativearmfatigue.png},
abstract = {Quantifying cumulative arm muscle fatigue is a critical factor in understanding, evaluating, and optimizing user experience during prolonged mid-air interaction. A reasonably accurate estimation of fatigue requires an estimate of an individual's strength. However, there is no easy-to-access method to measure individual strength to accommodate inter-individual differences. Furthermore, fatigue is influenced by both psychological and physiological factors, but no current HCI model provides good estimates of cumulative subjective fatigue. We present a new, simple method to estimate the maximum shoulder torque through a mid-air pointing task, which agrees with direct strength measurements. We then introduce a cumulative fatigue model informed by subjective and biomechanical measures. We evaluate the performance of the model in estimating cumulative subjective fatigue in mid-air interaction by performing multiple cross-validations and a comparison with an existing fatigue metric. Finally, we discuss the potential of our approach for real-time evaluation of subjective fatigue as well as future challenges.},
keywords = {fatigue, mid-air, model},
}
@inproceedings{yamanaka2017analysis,
title = {Analysis and Modeling of Steering Behavior of Connected Straight Paths},
author = {Yamanaka*, Shota and Stuerzlinger, Wolfgang and Miyashita, Homei},
booktitle = {Interaction},
year = {2017},
month = {Mar},
pages = {17-26},
url = {http://www.interaction-ipsj.org/proceedings/2017},
pdf = {papers/steeringanalysis.pdf},
teaser = {teasers/steeringanalysis.png},
commented-title = {Analysis and Modeling of the Operation of Steering a Connected Linear Route},
abstract = {The steering law models human motor performance and has been verified to hold for a single linear and/or circular path. Some extensions investigated steering around corners. Yet, little is known about human performance in navigating joined linear paths, i.e., successions of path segments with different widths, although such operations appear in our graphical user interface tasks, including lasso operations in illustration software. In this work, we conducted three experiments involving joined paths. The results showed that users significantly changed their behavior, and that that strategy change can be determined beforehand. A simple model summing the two indexes of difficulty (IDs) for each path was efficient to predict the time (R2 > 0.96), but more sophisticated models were also evaluated. The best model includes the ID of the crossing operation to enter the second path, in terms of both of R2 and AIC values.},
keywords = {steering, lasso, group selection},
award = {This work received a Best Paper Award},
note = {In Japanese},
}
@inproceedings{kim2016holostation,
title = {{HoloStation}: Augmented Visualization and Presentation},
author = {Kim*, Minju and Lee*, Jungjin and Stuerzlinger, Wolfgang and Wohn, Kwangyun},
booktitle = {{SIGGRAPH} {ASIA} Symposium on Visualization},
publisher = {ACM},
series = {SA Vis '16},
year = {2016},
month = {Dec},
articleno = {12},
numpages = {9},
doi = {https://doi.org/10.1145/3002151.3002161},
pdf = {papers/holostation.pdf},
teaser = {teasers/holostation.png},
abstract = {As much as stories need to be told, images need to be presented. Although visualizations are meant to be self-explanatory, often enhancing their expressive power by incorporating a certain degree of interactivity, visualized images today often fail to encourage the active engagement of the user/audience. In many cases, interactive interventions by a human presenter have the potential to drastically improve the engagement with visualization. Rather than just showing the content, the presenter then enhances information delivery, e.g., by providing the context of the visualization. In this paper, we propose a novel concept called augmented presentation in which the human presenter occupies the same physical space as the visualized information, thereby presenting and interacting with the visualized images seamlessly. Depending on the level of engagement the presenter's role may vary: from a simple storyteller to an augmented presenter who may be regarded as a part of the visualized entity. To further the development of the new idea of augmented presentation, we have designed, implemented, and user-tested a visualization system named HoloStation. The presenter is placed between two projection screens: the front one is half-mirrored and the rear one is a conventional wall screen. The 3D stereoscopic images are rendered to appear in-between, thereby creating a coherent 3D visualization space filled with digital information and the human presenter. We have conducted a controlled experiment to investigate the subjective level of immersion and engagement of the audience with HoloStation compared to the traditional presentation. Our results suggest that our new form of augmented presentation has a potential not only to enhance the quality of information presentation but also to enrich the user experience on visualizations.},
keywords = {stereo, display, augmented reality},
}
@inproceedings{waese2016rsvp,
title = {An Evaluation of Interaction Methods for Controlling RSVP Displays in Visual Search Tasks},
author = {Waese*, Jamie and Stuerzlinger, Wolfgang and Provart, Nicholas},
booktitle = {Symposium on Big Data Visual Analytics},
publisher = {IEEE},
series = {BDVA '16},
year = {2016},
month = {Nov},
pages = {1-8},
doi = {https://doi.org/10.1109/BDVA.2016.7787041},
pdf = {papers/rsvp.pdf},
teaser = {teasers/rsvp.png},
abstract = {Accurately identifying images with subtly varying features from a large set of similar images can be a challenging task. To succeed, viewers must perceive subtle differences between multiple nearly identical images and react appropriately. The Rapid Serial Visual Presentation (RSVP) display technique has the potential to improve performance as it exploits our ability to preattentively recognize differences between images when they are flashed on a screen in a rapid and serial manner. We compared the speed and accuracy of three RSVP interface methods ("Hover", "Slide Show" and "Velocity") against a traditional "Point & Click" non-RSVP interface to test whether an RSVP display improves performance in visual search tasks. In a follow-up study we compared "Hover" and "Velocity" RSVP interface methods against a "Small Multiples" non-RSVP interface to explore the interaction of interface type and target size on visual search tasks. We found the "Hover" RSVP interface to significantly reduce the time it takes to perform visual search tasks with no reduction in accuracy, regardless of the size of the search targets. Beyond the gene identification task tested here, these experiments inform the design of user interfaces for many other visual search tasks.},
keywords = {visual analytics, rsvp, visualization, search},
}
@inproceedings{sun2016depthpop,
title = {Shift-Sliding and Depth-Pop for {3D} Positioning},
author = {Sun*, Junwei and Stuerzlinger, Wolfgang and Shuralyov*, Dmitri},
booktitle = {Symposium on Spatial User Interaction},
publisher = {ACM},
series = {SUI '16},
year = {2016},
month = {Oct},
pages = {69-78},
doi = {https://doi.org/10.1145/2983310.2985748},
pdf = {papers/depthpop.pdf},
video = {videos/depthpop.mp4},
teaser = {teasers/depthpop.png},
abstract = {Moving objects is an important task in 3D user interfaces. We describe two new techniques for 3D positioning, designed for a mouse, but usable with other input devices. The techniques enable rapid, yet easy-to-use positioning of objects in 3D scenes. With sliding, the object follows the cursor and moves on the surfaces of the scene. Our techniques enable precise positioning of constrained objects. Sliding assumes that by default objects stay in contact with the scene's front surfaces, are always at least partially visible, and do not interpenetrate other objects. With our new Shift-Sliding method the user can override these default assumptions and lift objects into the air or make them collide with other objects. Shift-Sliding uses the local coordinate system of the surface that the object was last in contact with, which is a new form of context-dependent manipulation. We also present Depth-Pop, which maps mouse wheel actions to all object positions along the mouse ray, where the object meets the default assumptions for sliding. For efficiency, both methods use frame buffer techniques. Two user studies show that the new techniques significantly speed up common 3D positioning tasks.},
keywords = {3D manipulation, sliding, 3D positioning},
award = {This work received a Best Demonstration Award},
}
@inproceedings{brown2016inair,
title = {Exploring the Throughput Potential of In-Air Pointing},
author = {Brown*, Michelle A. and Stuerzlinger, Wolfgang},
booktitle = {18th International Conference on Human-Computer Interaction. Interaction Platforms and Techniques, Part {II}},
publisher = {Springer},
series = {HCI International '16},
year = {2016},
month = {Jul},
volume = {LNCS 9732},
pages = {13–24},
doi = {https://doi.org/10.1007/978-3-319-39516-6_2},
pdf = {papers/fingercast.pdf},
teaser = {teasers/fingercast.png},
abstract = {We present an analysis of how pointing performance in in-air un-instrumented pointing can be improved, towards throughput equal to the mouse. Pointing using a chopstick is found to achieve the highest average throughput, with 3.89 bps. This is a substantial improvement over using the finger to point at the screen. Two potential reasons for the throughput gap between chopstick and finger operation were explored: the natural curvature of human fingers and tracking issues that occurs when fingers bend toward the device. Yet, neither one of these factors seems to significantly affect throughput. Thus other, yet unexplored factors must be the cause. Lastly, the effect of unreliable click detection was also explored, as this also affects un-instrumented performance, and was found to have a linear effect.},
keywords = {mid-air, 3D pointing, errors},
}
@inproceedings{bjerre2016transition,
title = {Transition Times for Manipulation Tasks in Hybrid Interfaces},
author = {Christensen+, Allan and Pedersen+, Simon André and Bjerre+, Per and Pedersen+, Andreas Køllund and Stuerzlinger, Wolfgang},
booktitle = {18th International Conference on Human-Computer Interaction. Interaction Platforms and Techniques, Part {II}},
publisher = {Springer},
series = {HCI International '16},
year = {2016},
month = {Jul},
volume = {LNCS 9732},
pages = {138-150},
doi = {https://doi.org/10.1007/978-3-319-39516-6_13},
pdf = {papers/transitions.pdf},
teaser = {teasers/transitions.png},
abstract = {Compared to the mouse, uninstrumented in-air interaction has been shown to be slower and less precise for pointing. Yet, in-air input is preferable or advantageous in some interaction scenarios. Thus, we examine a three-device hybrid setup involving the mouse, keyboard, and a Leap Motion. We performed a user study to quantify the costs associated with transitioning between these interaction devices, while performing simple 2D manipulation tasks using the mouse and Leap Motion. We found that transitioning to and from the Leap Motion takes on average 0.87 s longer than those between the mouse and keyboard.},
keywords = {mid-air, 3D manipulation, 3D positioning},
}
@inproceedings{arif2016smartbackspace,
title = {Evaluation of a Smart-Restorable Backspace Technique to Facilitate Text Entry Error Correction},
author = {Arif, Ahmed Sabbir and Kim, Sunjun and Stuerzlinger, Wolfgang and Lee, Geehyuk and Mazalek, Ali},
booktitle = {Conference on Human Factors in Computing Systems},
publisher = {ACM},
series = {CHI '16},
year = {2016},
month = {Apr},
pages = {5151–5162},
doi = {https://doi.org/10.1145/2858036.2858407},
pdf = {papers/smartrestorablebackspace.pdf},
video = {videos/SmartRestorableBackspace.mp4},
teaser = {teasers/smartrestorablebackspace.png},
abstract = {We present a new smart-restorable backspace technique to facilitate correction of "overlooked" errors on touchscreen-based tablets. We conducted an empirical study to compare the new backspace technique with the conventional one. Results of the study revealed that the new technique improves the overall text entry performance, both in terms of speed and operations per character, by significantly reducing error correction efforts. In addition, results showed that most users preferred the new technique to the one they use on their tablets, and found it easy to learn and use. Most of them also felt that it improved their overall text entry performance, thus wanted to keep using it.},
keywords = {text entry, errors},
}
@inproceedings{chan2016microgestures,
title = {User Elicitation on Single-Hand Microgestures},
author = {Chan*, Edwin and Seyed*, Teddy and Stuerzlinger, Wolfgang and Yang, Xing-Dong and Maurer, Frank},
booktitle = {Conference on Human Factors in Computing Systems},
publisher = {ACM},
series = {CHI '16},
year = {2016},
month = {Apr},
pages = {3403–3414},
doi = {https://doi.org/10.1145/2858036.2858589},
pdf = {papers/singlehandmicrogestureelicitation.pdf},
teaser = {teasers/singlehandmicrogestureelicitation.png},
abstract = {Gestural interaction has become increasingly popular, as enabling technologies continue to transition from research to retail. The mobility of miniaturized (and invisible) technologies introduces new uses for gesture recognition. This paper investigates single-hand microgestures (SHMGs), detailed gestures in a small interaction space. SHMGs are suitable for the mobile and discrete nature of interactions for ubiquitous computing. However, there has been a lack of end-user input in the design of such gestures. We performed a user-elicitation study with 16 participants to determine their preferred gestures for a set of referents. We contribute an analysis of 1,632 gestures, the resulting gesture set, and prevalent conceptual themes amongst the elicited gestures. These themes provide a set of guidelines for gesture designers, while informing the designs of future studies. With the increase in hand-tracking and electronic devices in our surroundings, we see this as a starting point for designing gestures suitable to portable ubiquitous computing.},
keywords = {gesture recognition, gestures, elicitation, mid-air},
award = {This work received a Best Paper Honorable Mention Award},
}
@inproceedings{perteneder2016ambientlight,
title = {Glowworms and Fireflies: Ambient Light on Large Interactive Surfaces},
author = {Perteneder*, Florian and Grossauer*, Eva-Maria Beatrix and Leong*, Joanne and Stuerzlinger, Wolfgang and Haller, Michael},
booktitle = {Conference on Human Factors in Computing Systems},
publisher = {ACM},
series = {CHI '16},
year = {2016},
month = {Apr},
pages = {5849–5861},
doi = {https://doi.org/10.1145/2858036.2858524},
pdf = {papers/glowwormsfireflies.pdf},
video = {videos/glowworms.mp4},
teaser = {teasers/glowworms.png},
abstract = {Ambient light is starting to be commercially used to enhance the viewing experience for watching TV. We believe that ambient light can add value in meeting and control rooms that use large vertical interactive surfaces. Therefore, we equipped a large interactive whiteboard with a peripheral ambient light display and explored its utility for different scenarios by conducting two controlled experiments. In the first experiment, we investigated how ambient light can be used for peripheral notifications, and how perception is influenced by the user's position and the type of work they are engaged in. The second experiment investigated the utility of ambient light for off-screen visualization. We condense our findings into several design recommendations that we then applied to application scenarios to show the versatility and usefulness of ambient light for large surfaces.},
keywords = {ambient light, large display system},
}
@inproceedings{makonin2016mixedinitiative,
title = {Mixed-Initiative for Big Data: The Intersection of Human + Visual Analytics + Prediction},
author = {Makonin, Stephen and {McVeigh}+, Daniel and Stuerzlinger, Wolfgang and Tran*, Khoa and Popowich, Fred},
booktitle = {Hawaii International Conference on System Sciences},
publisher = {IEEE},
series = {HICSS '16},
year = {2016},
month = {Jan},
pages = {1427-1436},
doi = {https://doi.org/10.1109/HICSS.2016.181},
pdf = {papers/mixedinitiativesurvey.pdf},
teaser = {teasers/mixedinitiativesurvey.png},
abstract = {Existing surveys in visual analytics focus on the importance of the topic. However, many do not discuss the increasingly critical area of mixed-initiative systems. In this survey we discuss the importance of research in mixed-initiative systems and how it is different from visual analytics and other research fields. We present the conceptual architecture of a mixed-initiative visual analytics system (MIVAS) and the five key components that make up MIVASs (data wrangling, alternative discovery and comparison, parametric interaction, history tracking and exploration, and system agency and adaptation), which forms our main contribution. We compare and contrast different research that claims to be mixed-initiative against MIVASs and show how there is still a considerable amount of work that needs to be accomplished before any system can truly be mixed-initiative.},
keywords = {visual analytics, visualization, mixed initiative},
}
@inproceedings{strothoff2015pinsntouches,
title = {Pins 'n' Touches: An Interface for Tagging and Editing Complex Groups},
author = {Strothoff*, Sven and Stuerzlinger, Wolfgang and Hinrichs, Klaus},
booktitle = {Conference on Interactive Tabletops & Surfaces},
publisher = {ACM},
series = {ITS '15},
year = {2015},
month = {Nov},
pages = {191–200},
doi = {https://doi.org/10.1145/2817721.2817731},
pdf = {papers/pinsntouches.pdf},
video = {videos/pinsntouches.mp4},
teaser = {teasers/pinsntouches.png},
abstract = {Influenced by mouse/pen-based user interfaces, most touch-based object tagging techniques rely mostly on a single interaction point. Once objects are tagged, typically only individual object inclusions/exclusions are possible. Yet, for tagging larger groups with complex spatial layouts, more refinement may be necessary to achieve the desired result. We apply visual tag markers to objects to visualize their group association. Through a new multi-touch pin gesture that "pins" one or more objects "down" while tagging, our new interface is capable of efficiently grouping objects, as identified in our user studies.},
keywords = {touch, group selection},
}
@inproceedings{ortega2015shocam,
title = {{SHOCam}: A {3D} Orbiting Algorithm},
author = {Ortega, Michael and Stuerzlinger, Wolfgang and Scheurich*, Doug},
booktitle = {28th Annual Symposium on User Interface Software & Technology},
publisher = {ACM},
series = {UIST '15},
year = {2015},
month = {Nov},
pages = {119–128},
doi = {https://doi.org/10.1145/2807442.2807496},
pdf = {papers/shocam.pdf},
video = {videos/SHOcam.mp4},
teaser = {teasers/shocam.png},
abstract = {In this paper we describe a new orbiting algorithm, called SHOCam, which enables simple, safe and visually attractive control of a camera moving around 3D objects. Compared with existing methods, SHOCam provides a more consistent mapping between the user's interaction and the path of the camera by substantially reducing variability in both camera motion and look direction. Also, we present a new orbiting method that prevents the camera from penetrating object(s), making the visual feedback - and with it the user experience - more pleasing and also less error prone. Finally, we present new solutions for orbiting around multiple objects and multi-scale environments.},
keywords = {3D navigation, 3D orbiting},
}
@inproceedings{vuibert2015docking,
title = {Evaluation of Docking Task Performance Using Mid-Air Interaction Techniques},
author = {Vuibert*, Vanessa and Stuerzlinger, Wolfgang and Cooperstock, Jeremy R.},
booktitle = {3rd Symposium on Spatial User Interaction},
publisher = {ACM},
series = {SUI '15},
year = {2015},
month = {Aug},
pages = {44–52},
doi = {https://doi.org/10.1145/2788940.2788950},
pdf = {papers/midairdock.pdf},
teaser = {teasers/midairdock.png},
abstract = {Mid-air interaction has the potential to manipulate objects in 3D with more natural input mappings. We compared the performance attainable using various mid-air interaction methods with a mechanically constrained input device in a 6 degrees-of-freedom (DoF) docking task in both accuracy and completion time. We found that tangible mid-air input devices supported faster docking performance, while exhibiting accuracy close to that of constrained devices. Interaction with bare hands in mid-air achieved similar time performance and accuracy compared to the constrained device.},
keywords = {3D manipulation, 3D positioning, docking, mid-air},
}
@inproceedings{teather2015factors,
title = {Factors Affecting Mouse-Based {3D} Selection in Desktop {VR} Systems},
author = {Teather, Robert J. and Stuerzlinger, Wolfgang},
booktitle = {3rd Symposium on Spatial User Interaction},
publisher = {ACM},
series = {SUI '15},
year = {2015},
month = {Aug},
pages = {10–19},
doi = {https://doi.org/10.1145/2788940.2788946},
pdf = {papers/mousestereo.pdf},
video = {videos/mousestereo.mp4},
teaser = {teasers/mousestereo.png},
abstract = {We present two experiments on mouse-based point selection in a desktop virtual reality system using stereo display and head-tracking. To address potential issues of using a mouse cursor with stereo display, we also evaluate the impact of using a one-eyed (mono) cursor. While a one-eyed cursor visualization eliminates depth conflicts, recent work suggests it offers worse performance than stereo cursors, possibly due to eye discomfort. Our results indicate that presenting the cursor in stereo significantly reduces performance for targets at different depths. The one-eyed cursor eliminates this effect, offering better performance than both screen-plane and geometry-sliding cursors visualized in stereo. However, it also performed slightly worse than stereo cursors in situations without depth conflicts. Our study suggests that this difference is not due exclusively to the relative transparency of such a cursor, hence eye fatigue or similar may be responsible.},
keywords = {3D positioning, stereo},
}
@inproceedings{zaman2015gemni,
title = {{GEM-NI}: A System for Creating and Managing Alternatives In Generative Design},
author = {Zaman*, Loutfouz and Stuerzlinger, Wolfgang and Neugebauer+, Christian and Woodbury, Robert and Elkhaldi*, Maher and Shireen*, Naghmi and Terry, Michael},
booktitle = {33rd Annual ACM Conference on Human Factors in Computing Systems},
publisher = {ACM},
series = {CHI '15},
year = {2015},
month = {Apr},
pages = {1201–1210},
doi = {https://doi.org/10.1145/2702123.2702398},
pdf = {papers/gem-ni.pdf},
video = {videos/GEM-NI.m4v},
teaser = {teasers/gem-ni.png},
abstract = {We present GEM-NI - a graph-based generative-design tool that supports parallel exploration of alternative designs. Producing alternatives is a key feature of creative work, yet it is not strongly supported in most extant tools. GEM-NI enables various forms of exploration with alternatives such as parallel editing, recalling history, branching, merging, comparing, and Cartesian products of and for alternatives. Further, GEM-NI provides a modal graphical user interface and a design gallery, which both allow designers to control and manage their design exploration. We conducted an exploratory user study followed by in-depth one-on-one interviews with moderately and highly skills participants and obtained positive feedback for the system features, showing that GEM-NI supports creative design work well.},
keywords = {alternatives, design},
}
@inproceedings{pfeiffer2015emsfeedback,
title = {{3D} Virtual Hand Pointing with {EMS} and Vibration Feedback},
author = {Pfeiffer*, Max and Stuerzlinger, Wolfgang},
booktitle = {Symposium on {3D} User Interfaces},
publisher = {IEEE},
series = {3DUI '15},
year = {2015},
month = {Mar},
pages = {117-120},
doi = {https://doi.org/10.1109/3DUI.2015.7131735},
pdf = {papers/EMSfeedback.pdf},
teaser = {teasers/EMSfeedback.png},
abstract = {Pointing is one of the most basic interaction methods for 3D user interfaces. Previous work has shown that visual feedback improves such actions. Here we investigate if electrical muscle stimulation (EMS) and vibration is beneficial for 3D virtual hand pointing. In our experiment we used a 3D version of a Fitts' task to compare visual feedback, EMS, vibration, with no feedback. The results demonstrate that both EMS and vibration provide reasonable addition to visual feedback. We also found good user acceptance for both technologies.},
keywords = {3D pointing, haptics},
}
@inproceedings{arif2014pseudopressure,
title = {The Use of Pseudo Pressure in Authenticating Smartphone Users},
author = {Arif*, Ahmed Sabbir and Ali, Mazalek and Stuerzlinger, Wolfgang},
booktitle = {11th International Conference on Mobile and Ubiquitous Systems: Computing, Networking and Services},
publisher = {ICST},
series = {MOBIQUITOUS '14},
year = {2014},
month = {Dec},
pages = {151–160},
doi = {https://doi.org/10.4108/icst.mobiquitous.2014.257919},
pdf = {papers/pressureauthentication.pdf},
teaser = {teasers/pressureauthentication.png},
abstract = {In this article, we present a new user authentication technique for touchscreen-based smartphone users that augments pseudo touch pressure as an extra security measure to the conventional digit-lock technique. The new technique enhances security by offering more unique password combinations than the most popular ones, by making each password specific to its owner, and by reducing the threat of smudge attacks. A study comparing the new technique with the digit-lock technique showed that overall it is slower and more error-prone, but performs substantially better in short term. Also, most users felt more secure using it and wanted to use it dominantly on their smartphones. A second study confirmed that it does enhance security by making it relatively more resistant to smudge attacks and less vulnerable to situations where attackers are already in possession of users' passwords.},
keywords = {authentication, password, mobile device},
}
@inproceedings{teather2014visualaids,
title = {Visual Aids in {3D} Point Selection Experiments},
author = {Teather*, Robert J. and Stuerzlinger, Wolfgang},
booktitle = {2nd Symposium on Spatial User Interaction},
publisher = {ACM},
series = {SUI '14},
year = {2014},
month = {Oct},
pages = {127–136},
doi = {https://doi.org/10.1145/2659766.2659770},
pdf = {papers/visualaidspointing.pdf},
video = {videos/3DvisualAids.mp4},
teaser = {teasers/visualaidspointing.png},
abstract = {We present a study investigating the influence of visual aids on 3D point selection tasks. In a Fitts' law pointing experiment, we compared the effects of texturing, highlighting targets upon being touched, and the presence of support cylinders intended to eliminate floating targets. Results of the study indicate that texturing and support cylinders did not significantly influence performance. Enabling target highlighting increased movement speed, while decreasing error rate. Pointing throughput was unaffected by this speed-accuracy tradeoff. Highlighting also eliminated significant differences between selection coordinate depth deviation and the deviation in the two orthogonal axes.},
keywords = {3D pointing, stereo},
}
@inproceedings{brown2014performance,
title = {The Performance of Un-Instrumented in-Air Pointing},
author = {Brown*, Michelle A. and Stuerzlinger, Wolfgang and de Mendonça Filho+, Euclides José},
booktitle = {Graphics Interface},
series = {GI '14},
year = {2014},
month = {May},
pages = {59–66},
url = {https://dl.acm.org/doi/10.5555/2619648.2619659},
footnote = {https://graphicsinterface.org/proceedings/gi2014/gi2014-8},
pdf = {papers/inairpointing.pdf},
teaser = {teasers/inairpointing.png},
abstract = {We present an analysis of in-air finger and hand controlled object pointing and selection. The study used a tracking system that required no instrumentation on the user. We compared the performance of the two pointing methods with and without elbow stabilization and found that the method that yielded the best performance varied for each participant, such that there was no method that performed significantly better than all others. We also directly compared user performance between un-instrumented in-air pointing and the mouse. We found that the un-instrumented in-air pointing performed significantly worse, at less than 75% of mouse throughput. Yet, the larger range of applications for un-instrumented 3D hand tracking makes this technology still an attractive option for user interfaces.},
keywords = {3D pointing, mid-air},
}
@inproceedings{arif2014adaptation,
title = {User Adaptation to a Faulty Unistroke-Based Text Entry Technique by Switching to an Alternative Gesture Set},
author = {Arif*, Ahmed Sabbir and Stuerzlinger, Wolfgang},
booktitle = {Graphics Interface},
series = {GI '14},
year = {2014},
month = {May},
pages = {183–192},
url = {https://dl.acm.org/doi/10.5555/2619648.2619679},
footnote = {https://graphicsinterface.org/proceedings/gi2014/gi2014-24},
pdf = {papers/faultygestures.pdf},
teaser = {teasers/faultygestures.png},
abstract = {This article presents results of two user studies to investigate user adaptation to a faulty unistroke gesture recognizer of a text entry technique. The intent was to verify the hypothesis that users gradually adapt to a faulty gesture recognition technique' s misrecognition errors and that this adaptation rate is dependent on how frequently they occur. Results confirmed that users gradually adapt to misrecognition errors by replacing the error prone gestures with alternative ones, as available. Also, users adapt to a particular misrecognition error faster if it occurs more frequently than others.},
keywords = {errors, gesture recognition, adaptation},
}
@inproceedings{latoschik2014evaluation,
title = {On the Art of the Evaluation and Presentation of RIS-Engineering},
author = {Latoschik, Marc Erich and Stuerzlinger, Wolfgang},
booktitle = {Software Engineering and Architectures for Realtime Interactive Systems},
publisher = {IEEE},
series = {SEARIS '14},
year = {2014},
month = {Mar},
pages = {9-17},
doi = {https://doi.org/10.1109/SEARIS.2014.7152796},
pdf = {papers/rispresent.pdf},
teaser = {teasers/rispresent.png},
abstract = {This article analyses the tasks of presenting and evaluating relevant scientific research in the field of Real-time Interactive Systems (RIS), i.e., in areas such as Virtual, Mixed, and Augmented Reality (VR, MR, and AR) and advanced Human-Computer Interaction. It identifies different methods for a structured approach to the description and evaluation of systems and their properties, including commonly found best practices as well as dos and don'ts. The article is targeted at authors as well as reviewers to guide both groups in the presentation as well as the appraisal of system engineering work.},
keywords = {systems, evaluation, virtual reality, augmented reality},
}
@inproceedings{arif2013pseudopressure,
title = {Pseudo-Pressure Detection and Its Use in Predictive Text Entry on Touchscreens},
author = {Arif*, Ahmed Sabbir and Stuerzlinger, Wolfgang},
booktitle = {Australian Computer-Human Interaction Conference: Augmentation, Application, Innovation, Collaboration},
series = {OzCHI '13},
year = {2013},
month = {Nov},
pages = {383-392},
doi = {https://doi.org/10.1145/2541016.2541024},
pdf = {papers/pseudopressure.pdf},
teaser = {teasers/pseudopressure.png},
abstract = {In this article we first present a new hybrid technique that combines existing time- and touch-point-based approaches to simulate pressure detection on standard touchscreens. Results of two user studies show that the new hybrid technique can distinguish (at least) two pressure levels, where the first requires on average 1.04 N and the second 3.24 N force on the surface. Then, we present a novel pressure-based predictive text entry technique that utilizes our hybrid pressure detection to enable users to bypass incorrect predictions by applying extra pressure on the next key. For inputting short English phrases with 10% non-dictionary words a comparison with conventional text entry in a study showed that the new technique increases entry speed by 9% and decreases error rates by 25%. Also, most users (83%) favour the new technique.},
keywords = {text entry, pressure, touch},
award = {This work received a Best Paper Award},
}
@inproceedings{arif2013evaluation,
title = {Evaluation of a New Error Prevention Technique for Mobile Touchscreen Text Entry},
author = {Arif*, Ahmed Sabbir and Stuerzlinger, Wolfgang},
booktitle = {Australian Computer-Human Interaction Conference: Augmentation, Application, Innovation, Collaboration},
series = {OzCHI '13},
year = {2013},
month = {Nov},
pages = {397-400},
doi = {https://doi.org/10.1145/2541016.2541063},
pdf = {papers/textpressure.pdf},
teaser = {teasers/textpressure.png},
abstract = {This paper presents a new pressure-based error prevention technique for mobile touchscreen text entry. Two user studies were conducted to compare the new technique with a conventional virtual keyboard, one with novice and another with expert users. Results of the first user study showed that with practice the new technique significantly improves accuracy. Yet, no such indication was observed during the second study.},
keywords = {text entry, errors, pressure, touch},
}
@inproceedings{lindlbauer2013perceptual,
title = {Perceptual Grouping: Selection Assistance for Digital Sketching},
author = {Lindlbauer*, David and Haller, Michael and Hancock, Mark and Scott, Stacey and Stuerzlinger, Wolfgang},
booktitle = {Conference on Interactive Tabletops and Surfaces},
publisher = {ACM},
series = {ITS '13},
year = {2013},
month = {Oct},
pages = {51-60},
doi = {https://doi.org/10.1145/2512349.2512801},
pdf = {papers/suggero.pdf},
video = {videos/Suggero.mp4},
teaser = {teasers/suggero.png},
abstract = {Modifying a digital sketch may require multiple selections before a particular editing tool can be applied. Especially on large interactive surfaces, such interactions can be fatiguing. Accordingly, we propose a method, called Suggero, to facilitate the selection process of digital ink. Suggero identifies groups of perceptually related drawing objects. These "perceptual groups" are used to suggest possible extensions in response to a person's initial selection. Two studies were conducted. First, a background study investigated participant's expectations of such a selection assistance tool. Then, an empirical study compared the effectiveness of Suggero with an existing manual technique. The results revealed that Suggero required fewer pen interactions and less pen movement, suggesting that Suggero minimizes fatigue during digital sketching.},
keywords = {group selection},
}
@inproceedings{zeidler2013ale,
title = {The Auckland Layout Editor: An Improved {GUI} Layout Specification Process},
author = {Zeidler*, Clemens and Lutteroth, Christof and Stuerzlinger, Wolfgang and Weber, Gerald},
booktitle = {26th Annual Symposium on User Interface Software and Technology},
publisher = {ACM},
series = {UIST '13},
year = {2013},
month = {Oct},
pages = {343-352},
doi = {https://doi.org/10.1145/2501988.2502007},
pdf = {papers/layoutALE.pdf},
video = {videos/ALE.mp4},
teaser = {teasers/layoutALE.png},
abstract = {Layout managers are used to control the placement of widgets in graphical user interfaces (GUIs). Constraint-based layout managers are among the most powerful. However, they are also more complex and their layouts are prone to problems such as over-constrained specifications and widget overlap. This poses challenges for GUI builder tools, which ideally should address these issues automatically. We present a new GUI builder - the Auckland Layout Editor (ALE) - that addresses these challenges by enabling GUI designers to specify constraint-based layouts using simple, mouse-based operations. We give a detailed description of ALE's edit operations, which do not require direct constraint editing. ALE guarantees that all edit operations lead to sound specifications, ensuring solvable and non-overlapping layouts. To achieve that, we present a new algorithm that automatically generates the constraints necessary to keep a layout non-overlapping. Furthermore, we discuss how our innovations can be combined with manual constraint editing in a sound way. Finally, to aid designers in creating layouts with good resize behavior, we propose a novel automatic layout preview. This displays the layout at its minimum and in an enlarged size, which allows visualizing potential resize issues directly. All these features permit GUI developers to focus more on the overall UI design.},
keywords = {GUI, layout, constraints, GUI builder},
}
@inproceedings{zabramski2013easy,
title = {Easy vs Tricky: The Shape Effect in Tracing, Selecting, and Steering With Mouse, Stylus, and Touch},
author = {Zabramski*, Stanislaw and Shrestha*, Suman and Stuerzlinger, Wolfgang},
booktitle = {International Conference on Making Sense of Converging Media},
series = {MindTrek '13},
year = {2013},
month = {Oct},
pages = {99-103},
doi = {https://doi.org/10.1145/2523429.2523444},
pdf = {papers/shapeeffect.pdf},
teaser = {teasers/shapeeffect.png},
abstract = {This short paper is a work-in-progress report on an experimental comparison and evaluation of users' performance in four line-tracing tasks based on two shapes and performed with three input methods (mouse, stylus, and touch-input). The shapes' properties used in the study created the two classes of shapes: easy and hard to replicate. As expected these two classes had different impact on user's performance in each task tested (tracing, lasso selection, steering through narrow and wide tunnel). The results show that participants replicating the shapes using touch-input were the least accurate but were the fastest in comparison to the remaining input methods. The stylus was the least error-prone method and the mouse was the slowest device in drawing tasks (tracing and selection). The differences in error distances between the input methods were less pronounced in steering tasks but timing data showed that mouse was still the slowest one. While the time of replication did not differ between the two shapes tested, the differences between the errors participants made were significant for all tasks and input devices, and patterns of these differences were consistent between the shapes. These results confirm predictions from a previous study and show which shapes' properties can make their replication more difficult. The results can be used to design shapes that are easy to replicate, e.g., in surface-based gestural interaction.},
keywords = {steering, tracing, drawing},
}
@inproceedings{agarwal2013widgetlens,
title = {{WidgetLens}: A System for Adaptive Content Magnification of Widgets},
author = {Agarwal*, Bhavna and Stuerzlinger, Wolfgang},
booktitle = {27th International BCS Human Computer Interaction Conference},
series = {BCS-HCI '13},
year = {2013},
month = {Sep},
articleno = {2},
numpages = {10},
doi = {https://doi.org/10.14236/ewic/HCI2013.4},
pdf = {papers/widgetlens.pdf},
video = {videos/WidgetLensOLD.mp4},
teaser = {teasers/widgetlens.png},
abstract = {On displays with high pixel densities or on mobile devices and due to limitations in current graphical user interface toolkits, content can appear (too) small and be hard to interact with. We present WidgetLens, a novel adaptive widget magnification system, which improves access to and interaction with graphical user interfaces. It is designed for usage of unmodified applications on screens with high pixel densities, remote desktop scenarios, and may also address some situations with visual impairments. It includes a comprehensive set of adaptive magnification lenses for standard widgets, each adjusted to the properties of that type of widget. These lenses enable full interaction with content that appears too small. We also present several extensions.},
keywords = {GUI, widget, magnification, layout},
}
@inproceedings{zabramski2013didwemiss,
title = {Did We Miss Something? Correspondence Analysis of Usability Data},
author = {Zabramski*, Stanislaw and Stuerzlinger, Wolfgang},
booktitle = {Human-Computer Interaction},
publisher = {Springer},
series = {INTERACT '13},
year = {2013},
month = {Sep},
volume = {LNCS 8120},
pages = {272-279},
doi = {https://doi.org/10.1007/978-3-642-40498-6_20},
pdf = {papers/correspondenceanalysisshort.pdf},
teaser = {teasers/correspondenceanalysisshort.png},
abstract = {We have applied a multivariate exploratory technique called Correspondence Analysis (CA) to create and analyze a model of the dataset of experiment results. The dataset originates from a comparative usability study of tracing with the use of mouse, pen, and touch input and contains both categorical and continuous data – i.e. results of questionnaires and task measurements. CA allowed to visually and numerically assess the main variables in the dataset and how they interact with each other. In our study, pen input had the best measured performance and was preferred by the users. Touch input was the least accurate of all input methods tested but it was preferred by users over mouse especially in the conditions lacking of visual feedback of drawing. CA helped to detect that secondary effect even though it cannot be explained by the performance results alone. The importance of the influence of user's previous experience is also noted. We conclude that CA helped to identify all major phenomena known from previous studies but also was sensitive to minor and secondary effects, what makes it a well suited method to quickly evaluate usability data.},
keywords = {steering, drawing, steering},
}
@inproceedings{zeidler2013evaluating,
title = {Evaluating Direct Manipulation Operations for Constraint-based Layout},
author = {Zeidler*, Clemens and Lutteroth, Christof and Stuerzlinger, Wolfgang and Weber, Gerald},
booktitle = {Human-Computer Interaction},
publisher = {Springer},
series = {INTERACT '13},
year = {2013},
month = {Sep},
volume = {LNCS 8118},
pages = {513-529},
doi = {https://doi.org/10.1007/978-3-642-40480-1_35},
pdf = {papers/layoutALEstudy.pdf},
teaser = {teasers/layoutALEstudy.png},
abstract = {Layout managers are used to control the placement of widgets in graphical user interfaces (GUIs). Constraint-based layout managers are more powerful than other ones. However, they are also more complex and their layouts are prone to problems that usually require direct editing of constraints. Today, designers commonly use GUI builders to specify GUIs. The complexities of traditional approaches to constraint-based layouts pose challenges for GUI builders.We evaluate a novel GUI builder, the Auckland Layout Editor (ALE), which addresses these challenges by enabling GUI designers to specify constraint-based layouts via direct manipulation using simple, mouse-based operations. These operations hide the complexity of the constraint-based layout model, while giving designers access to its benefits.In a user evaluation we compared ALE with two other mainstream layout builders, a grid-based and a constraint-based one. The time taken to create realistic sample layouts with our builder was significantly shorter, and most participants preferred ALE's approach. The evaluation demonstrates that good usability for authoring constraint-based layouts is possible.},
keywords = {GUI, layout, constraints},
}
@inproceedings{bruder2013touching,
title = {Touching the Void Revisited: Analyses of Touch Behavior On and Above Tabletop Surfaces},
author = {Bruder*, Gerd and Steinicke, Frank and Stuerzlinger, Wolfgang},
booktitle = {Human-Computer Interaction},
publisher = {Springer},
series = {INTERACT '13},
year = {2013},
month = {Sep},
volume = {LNCS 8117},
pages = {278-296},
doi = {https://doi.org/10.1007/978-3-642-40483-2_19},
pdf = {papers/stereotouchobserv.pdf},
teaser = {teasers/stereotouchobserv.png},
abstract = {Recent developments in touch and display technologies made it possible to integrate touch-sensitive surfaces into stereoscopic three-dimensional (3D) displays. Although this combination provides a compelling user experience, interaction with stereoscopically displayed objects poses some fundamental challenges. If a user aims to select a 3D object, each eye sees a different perspective of the same scene. This results in two distinct projections on the display surface, which raises the question where users would touch in 3D or on the two-dimensional (2D) surface to indicate the selection. In this paper we analyze the relation between the 3D positions of stereoscopically displayed objects and the on- as well as off-surface touch areas. The results show that 2D touch interaction works better close to the screen but also that 3D interaction is more suitable beyond 10cm from the screen. Finally, we discuss implications for the development of future touch-sensitive interfaces with stereoscopic display.},
keywords = {3D pointing, mid-air, touch},
}
@inproceedings{scheurich2013onehanded,
title = {A One-Handed Multi-Touch Method for {3D} Rotations},
author = {Scheurich*, Doug and Stuerzlinger, Wolfgang},
booktitle = {Human-Computer Interaction},
publisher = {Springer},
series = {INTERACT '13},
year = {2013},
month = {Sep},
volume = {LNCS 8117},
pages = {56-69},
doi = {https://doi.org/10.1007/978-3-642-40483-2_4},
pdf = {papers/touchrot.pdf},
video = {videos/touchRot.mp4},
teaser = {teasers/touchrot.png},
abstract = {Rotating 3D objects is a difficult task. We present a new rotation technique based on collision-free "mating" to expedite 3D rotations. It is specifically designed for one-handed interaction on tablets or touchscreens. A user study found that our new technique decreased the time to rotate objects in 3D by more than 60% in situations where objects align. We found similar results when users translated and rotated objects in a 3D scene. Also, angle errors were 35% less with mating. In essence, our new rotation technique improves both the speed and accuracy of common 3D rotation tasks.},
keywords = {3D manipulation, touch},
}
@inproceedings{das2013unified,
title = {Unified Modeling of Proactive Interference and Memorization Effort: A New Mathematical Perspective Within {ACT-R} Theory},
author = {Das*, Arindam and Stuerzlinger, Wolfgang},
booktitle = {Annual Meeting of the Cognitive Science Society},
series = {CogSci '13},
isbn = {978-097683189-1},
year = {2013},
month = {Jul},
pages = {358-363},
url = {https://escholarship.org/uc/item/1p05s7db},
pdf = {papers/proactivememorymodel.pdf},
teaser = {teasers/proactivememorymodel.png},
abstract = {We parsimoniously model the effect of proactive interference and memorization effort in learning stable graphical layouts. We model the visual search cost, i.e. the number of distractors visually encoded while looking for a target item, as a reasonable surrogate of onscreen proactive interference. Further, we show that a novel quantity that we term "effort factor" is an acceptable estimate for comparing the memorization effort across different access cost of onscreen information during the early stages of practice.},
keywords = {text entry, learning},
}
@inproceedings{zabramski2013activity,
title = {Activity or Product? - Drawing and {HCI}},
author = {Zabramski*, Stanislaw and Stuerzlinger, Wolfgang},
booktitle = {International Conference on Multimedia, Interaction, Design and Innovation},
series = {MIDI '13},
year = {2013},
month = {Jun},
pages = {29-38},
doi = {https://doi.org/10.1145/2500342.2500346},
pdf = {papers/drawingactivity.pdf},
teaser = {teasers/drawingactivity.png},
abstract = {Drawing tasks are rarely addressed experimentally by the HCI community, and even then pointing, steering, or gesturing is promoted as an approach towards drawing. We critically analyze the status quo, propose an improved framework for task analysis, and give suggestions on how to perceive drawing task at a meta-level.},
keywords = {drawing, steering},
}
@comment{c, c={leave the "_stuerzlinger" in the ID to enable umlaut-free search!}}
@inproceedings{bruder_stuerzlinger2013totouch,
title = {To Touch or not to Touch? Comparing {2D} Touch and {3D} Mid-Air Interaction on Stereoscopic Tabletop Surfaces},
author = {Bruder*, Gerd and Steinicke, Frank and Stürzlinger, Wolfgang},
booktitle = {Symposium on Spatial User Interaction},
publisher = {ACM},
series = {SUI '13},
year = {2013},
month = {Jul},
pages = {9-16},
doi = {https://doi.org/10.1145/2491367.2491369},
pdf = {papers/2D3Dtouch.pdf},
video = {videos/stereoTouch.mp4},
teaser = {teasers/2D3Dtouch.png},
abstract = {Recent developments in touch and display technologies have laid the groundwork to combine touch-sensitive display systems with stereoscopic three-dimensional (3D) display. Although this combination provides a compelling user experience, interaction with objects stereoscopically displayed in front of the screen poses some fundamental challenges: Traditionally, touch-sensitive surfaces capture only direct contacts such that the user has to penetrate the visually perceived object to touch the 2D surface behind the object. Conversely, recent technologies support capturing finger positions in front of the display, enabling users to interact with intangible objects in mid-air 3D space. In this paper we perform a comparison between such 2D touch and 3D mid-air interactions in a Fitts' Law experiment for objects with varying stereoscopical parallax. The results show that the 2D touch technique is more efficient close to the screen, whereas for targets further away from the screen, 3D selection outperforms 2D touch. Based on the results, we present implications for the design and development of future touch-sensitive interfaces for stereoscopic displays.},
keywords = {3D pointing, touch, mid-air},
}
@inproceedings{teather2013pointing,
title = {Pointing at {3D} Target Projections with One-Eyed and Stereo Cursors},
author = {Teather*, Robert J. and Stuerzlinger, Wolfgang},
booktitle = {{SIGCHI} Conference on Human Factors in Computing Systems},
publisher = {ACM},
series = {CHI '13},
year = {2013},
month = {Apr},
pages = {159-168},
doi = {https://doi.org/10.1145/2470654.2470677},
pdf = {papers/stereocursor.pdf},
video = {videos/3DoneEyedCursor.mp4},
teaser = {teasers/stereocursor.png},
abstract = {We present a study of cursors for selecting 2D-projected 3D targets. We compared a stereo- and mono-rendered (one-eyed) cursor using two mouse-based and two remote pointing techniques in a 3D Fitts' law pointing experiment. The first experiment used targets at fixed depths. Results indicate that one-eyed cursors only improve screen-plane pointing techniques, and that constant target depth does not influence pointing throughput. A second experiment included pointing between targets at varying depths and used only "screen-plane" pointing techniques. Our results suggest that in the absence of stereo cue conflicts, screen-space projections of Fitts' law parameters (target size and distance) yield constant throughput despite target depth differences and produce better models of performance.},
keywords = {3D pointing, stereo},
}
@inproceedings{bruder2013effects,
title = {Effects of Visual Conflicts on {3D} Selection Task Performance in Stereoscopic Display Environments},
author = {Bruder*, Gerd and Steinicke, Frank and Stuerzlinger, Wolfgang},
booktitle = {Symposium on {3D} User Interfaces},
publisher = {IEEE},
series = {3DUI '13},
year = {2013},
month = {Mar},
pages = {115-118},
doi = {https://doi.org/10.1109/3DUI.2013.6550207},
pdf = {papers/offsettouch.pdf},
teaser = {teasers/offsettouch.png},
abstract = {Mid-air direct-touch interaction in stereoscopic display environments poses challenges to the design of 3D user interfaces. Not only is passive haptic feedback usually absent when selecting a virtual object displayed with positive or negative parallax relative to a display surface, but such setups also suffer from inherent visual conflicts, such as vergence/accommodation mismatches and double vision. In particular, if the user tries to select a virtual object with a finger or input device, either the virtual object or the user's finger will appear blurred, resulting in an ambiguity for selections that may significantly impact the user's performance. In this paper we evaluate the effect of visual conflicts for mid-air 3D selection performance within arm's reach on a stereoscopic table with a Fitts' Law experiment. We compare three different techniques with different levels of visual conflicts for selecting a virtual object: real hand, virtual offset cursor, and virtual offset hand. Our results show that the error rate is highest for the real hand condition and less for the virtual offset-based techniques. However, our results indicate that selections with the real hand resulted in the highest effective throughput of all conditions. This suggests that virtual offset-based techniques do not improve overall performance.},
keywords = {3D pointing, stereo},
}
@inproceedings{zabramski2012effect,
title = {The Effect of Shape Properties on Ad-hoc Shape Replication with Mouse, Pen, and Touch Input},
author = {Zabramski*, Stanislaw and Stuerzlinger, Wolfgang},
booktitle = {Proceeding of the 16th International Academic {MindTrek} Conference},
series = {MindTrek '12},
year = {2012},
month = {Oct},
pages = {275-278},
doi = {https://doi.org/10.1145/2393132.2393192},
pdf = {papers/shapereplication.pdf},
teaser = {teasers/shapereplication.png},
abstract = {This paper summarizes observations from four empirical studies focusing on shape replication with three input methods. The aim was to identify and assess how the components of several semi-randomly generated shapes influence how accurately untrained users can replicate each of these components. We found that the pen is the least and touch the most error-prone method when used for drawing. Additionally, the distribution of errors was analyzed. The results may be used to predict which shape properties make shape replication more difficult. Additionally, the results may be used to design shapes that are easy to replicate.},
keywords = {steering, drawing},
}
@inproceedings{liang20123dmanipulation,
title = {User-defined Surface+Motion Gestures for {3D} Manipulation of Objects at a Distance Through a Mobile Device},
author = {Liang, Hai-Ning and Williams*, Cary and Semegen, Myron and Stuerzlinger, Wolfgang and Irani, Pourang},
booktitle = {10th Asia Pacific Conference on Computer Human Unteraction},
series = {APCHI '12},
year = {2012},
month = {Aug},
pages = {299-308},
doi = {https://doi.org/10.1145/2350046.2350098},
pdf = {papers/dualsurface.pdf},
teaser = {teasers/dualsurface.png},
abstract = {One form of input for interacting with large shared surfaces is through mobile devices. These personal devices provide interactive displays as well as numerous sensors to effectuate gestures for input. We examine the possibility of using surface and motion gestures on mobile devices for interacting with 3D objects on large surfaces. If effective use of such devices is possible over large displays, then users can collaborate and carry out complex 3D manipulation tasks, which are not trivial to do. In an attempt to generate design guidelines for this type of interaction, we conducted a guessability study with a dual-surface concept device, which provides users access to information through both its front and back. We elicited a set of end-user surface- and motion-based gestures. Based on our results, we demonstrate reasonably good agreement between gestures for choice of sensory (i.e. tilt), multi-touch and dual-surface input. In this paper we report the results of the guessability study and the design of the gesture-based interface for 3D manipulation.},
keywords = {3D manipulation, touch},
}
@inproceedings{arif2011extending,
title = {Extending Mobile User Ambient Awareness for Nomadic Text Entry},
author = {Arif*, Ahmed Sabbir and Iltisberger+, Benedikt and Stuerzlinger, Wolfgang},
booktitle = {Australian Computer-Human Interaction Conference},
series = {OzCHI '11},
year = {2011},
month = {Nov},
pages = {21-30},
doi = {https://doi.org/10.1145/2071536.2071539},
pdf = {papers/nomadictextentry.pdf},
teaser = {teasers/nomadictextentry.png},
abstract = {Nowadays, we input text not only on stationary devices, but also on handheld devices while walking, driving, or commuting. Text entry on the move, which we term as nomadic text entry, is generally slower. This is partially due to the need for users to move their visual focus from the device to their surroundings for navigational purposes and back. To investigate if better feedback about users' surroundings on the device can improve performance, we present a number of new and existing feedback systems: textual, visual, textual & visual, and textual & visual via translucent keyboard. Experimental comparisons between the conventional and these techniques established that increased ambient awareness for mobile users enhances nomadic text entry performance. Results showed that the textual and the textual & visual via translucent keyboard conditions increased text entry speed by 14% and 11%, respectively, and reduced the error rate by 13% compared to the regular technique. The two methods also significantly reduced the number of collisions with obstacles.},
keywords = {text entry, mobile device, awareness},
}
@inproceedings{patel2011simulation,
title = {Simulation of a Virtual Reality Tracking System},
author = {Patel+, Kapil and Stuerzlinger, Wolfgang},
booktitle = {International Conference on Virtual Environments, Human-Computer Interfaces and Measurement Systems Proceedings},
publisher = {IEEE},
series = {VECIMS '11},
year = {2011},
month = {Sep},
pages = {78-83},
doi = {https://doi.org/10.1109/VECIMS.2011.6053849},
pdf = {papers/hedgesim.pdf},
teaser = {teasers/hedgesim.png},
abstract = {Virtual reality tracking systems are used to detect the position and orientation of a user inside spatially immersive systems. In this paper, we simulate a laser-based tracking system that was originally developed for a six-sided spatially immersive system in environments with one and five walls to evaluate its performance for other installations. As expected, the results show that performance degrades with the number of walls, but they also show that tracking with even one wall is still very feasible.},
keywords = {3D tracking, simulation, virtual reality},
}
@inproceedings{zhao2011comparison,
title = {Comparison of Multiple {3D} Rotation Methods},
author = {Zhao*, Yao Jun and Shuralyov*, Dmitri and Stuerzlinger, Wolfgang},
booktitle = {International Conference on Virtual Environments, Human-Computer Interfaces and Measurement Systems Proceedings},
publisher = {IEEE},
series = {VECIMS '11},
year = {2011},
month = {Sep},
pages = {13-17},
doi = {https://doi.org/10.1109/VECIMS.2011.6053855},
pdf = {papers/comparerotation.pdf},
teaser = {teasers/comparerotation.png},
abstract = {In this paper, we present an experimental comparison of 3D rotation techniques. In all techniques, the third degree of freedom is controlled by the mouse-wheel. The investigated techniques are Bell's Trackball, Shoemake's Arcball and the Two-axis Valuator method. The result from a pilot showed no performance or accuracy difference among these three. However, we did observe minor differences in an experiment with more participants and trials, though these differences were not significant. Also, from questionnaires, we found that most of the users considered the use of mouse wheel helpful for completing the tasks.},
keywords = {3D manipulation},
}
@inproceedings{mcclymont2011comparison,
title = {Comparison of {3D} Navigation Interfaces},
author = {{McClymont}*, Joshua and Shuralyov*, Dmitri and Stuerzlinger, Wolfgang},
booktitle = {International Conference on Virtual Environments, Human-Computer Interfaces and Measurement Systems Proceedings},
publisher = {IEEE},
series = {VECIMS '11},
year = {2011},
month = {Sep},
pages = {7-12},
doi = {https://doi.org/10.1109/VECIMS.2011.6053842},
pdf = {papers/comparenavigation.pdf},
teaser = {teasers/comparenavigation.png},
abstract = {This paper evaluates two different interfaces for navigation in a 3D environment. The first is a `Click-to-Move' style interface that involves using a mouse. The second is a gaming style interface that uses both mouse and keyboard (i.e. the `WASD' keys) for view direction and movement respectively. In the user study, participants were asked to navigate a supermarket environment and collect a specific subset of items. Results revealed significant differences only for some of the sub-measures. Yet, some revealing observations were made regarding user behavior and interaction with the user interface.},
keywords = {3D navigation},
}
@inproceedings{dadgari2011merging,
title = {New Techniques for Merging Text Versions},
author = {Dadgari*, Darius and Stuerzlinger, Wolfgang},
booktitle = {Human-Computer Interaction, Interaction Techniques and Environments},
publisher = {Springer},
series = {HCI International '11},
year = {2011},
month = {Jul},
volume = {LNCS 6762},
pages = {331-340},
doi = {https://doi.org/10.1007/978-3-642-21605-3_37},
pdf = {papers/version4text.pdf},
teaser = {teasers/version4text.png},
abstract = {Versioning helps users to keep track of different sets of edits on a document. Version merging methods enable users to determine which parts of which version they wish to include in the next or final version. We explored several existing and two new methods (highlighting and overlay) in single and multiple window settings. We present the results of our quantitative user studies, which show that the new highlighting and overlay techniques are preferred for version merging tasks. The results suggest that the most useful methods are those which clearly and easily present information that is likely important to the user, while simultaneously hiding less important information. Also, multi window version merging is preferred over single window merging.},
keywords = {difference visualization, merging},
}
@inproceedings{zaman2011effect,
title = {The Effect of Animation Dual-View, Difference Layers and Relative Re-Layout in Hierarchical Diagram Differencing},
author = {Zaman*, Loutfouz and Kalra+, Ashish and Stuerzlinger, Wolfgang},
booktitle = {Graphics Interface},
series = {GI '11},
year = {2011},
month = {May},
pages = {183-190},
url = {https://graphicsinterface.org/proceedings/gi2011/gi2011-24},
pdf = {papers/versiondiff4diagrams.pdf},
teaser = {teasers/versiondiff4diagrams.png},
abstract = {We present a new system for visualizing and merging differences in diagrams that uses animation, dual views, a storyboard, relative re-layout, and layering. We ran two user studies investigating the benefits of the system. The first user study compared pairs of hierarchical diagrams with matching node positions. The results underscore that naïve dual-view visualization is undesirable. On the positive side, participants particularly liked the dual-view with difference layer technique. The second user study focused on diagrams with partially varying node positions and difference visualization and animation. We found evidence that both techniques are beneficial, and that the combination was preferred.},
keywords = {difference visualization, diagram},
}
@inproceedings{ashtiani20112d,
title = {{2D} Similarity Transformations on Multi-Touch Surfaces},
author = {Ashtiani*, Behrooz and Stuerzlinger, Wolfgang},
booktitle = {Graphics Interface},
series = {GI '11},
year = {2011},
month = {May},
pages = {57-64},
url = {https://graphicsinterface.org/proceedings/gi2011/gi2011-8},
pdf = {papers/xnt2d.pdf},
video = {videos/XNT.mp4},
teaser = {teasers/xnt2d.png},
abstract = {We present and comparatively evaluate two new object transformation techniques for multi-touch surfaces. Specifying complete two-dimensional similarity transformations requires a minimum of four degrees of freedom: two for position, one for rotation, and another for scaling. Many existing techniques for object transformation are designed to function with traditional input devices such as mice, single-touch surfaces, or stylus pens. The challenge is to map controls appropriately for each of these devices. A few multi-touch techniques have been proposed in the past, but no comprehensive evaluation has been presented.
XNT is a new three-finger object transformation technique, designed for multi-touch surfaces. It provides a natural interface for two-dimensional manipulation. XNT and several existing techniques were evaluated in a user study. The results show that XNT is superior for all tasks that involve scaling and competitive for tasks that involve only rotation and positioning.},
keywords = {touch, manipulation},
}
@inproceedings{pavlovych2011target,
title = {Target Following Performance in the Presence of Latency, Jitter, and Signal Dropouts},
author = {Pavlovych*, Andriy and Stuerzlinger, Wolfgang},
booktitle = {Graphics Interface},
series = {GI '11},
year = {2011},
month = {May},
pages = {33-40},
url = {https://graphicsinterface.org/proceedings/gi2011/gi2011-5},
pdf = {papers/trackingperformance.pdf},
teaser = {teasers/trackingperformance.png},
abstract = {In this paper we describe how human target following performance changes in the presence of latency, latency variations, and signal dropouts. Many modern games and game systems allow for networked, remote participation. In such networks latency, variations and dropouts are commonly encountered factors.
Our user study reveals that all of the investigated factors decrease tracking performance. The errors increase very quickly for latencies of over 110 ms, for latency jitters above 40 ms, and for dropout rates of more than 10 %. The effects of target velocity on errors are close to linear, and transverse errors are smaller than longitudinal ones. The results can be used to better quantify the effects of different factors on moving objects in interactive scenarios. They also aid the designers in selecting target sizes and velocities, as well as in adjusting smoothing, prediction and compensation algorithms.},
keywords = {target following, jitter},
}
@inproceedings{teather2011pointing,
title = {Pointing at {3D} Targets in a Stereo Head-Tracked Virtual Environment},
author = {Teather*, Robert J. and Stuerzlinger, Wolfgang},
booktitle = {Symposium on {3D} User Interfaces},
publisher = {IEEE},
series = {3DUI '11},
year = {2011},
month = {Mar},
pages = {87-94},
doi = {https://doi.org/10.1109/3DUI.2011.5759222},
pdf = {papers/fishtankfitts.pdf},
teaser = {teasers/fishtankfitts.png},
abstract = {We present three experiments that systematically examine pointing tasks in fish tank VR using the ISO 9241-9 standard. All experiments used a tracked stylus for a both direct touch and ray-based technique. Mouse-based techniques were also studied. Our goal was to investigate means of comparing 2D and 3D pointing techniques. The first experiment used a 2D task constrained to the display surface, allowing direct validation against other 2D studies. The second experiment used targets stereoscopically presented above and parallel to the display, i.e., the same task, but without tactile feedback afforded by the screen. The third experiment used targets varying in all three dimensions. Results of these studies suggest that the conventional 2D formulation of Fitts' law works well for planar pointing tasks even without tactile feedback, and with stereo display. Fully 3D motions using the ray and mouse based techniques are less well modeled.},
keywords = {3D pointing},
}
@inproceedings{dehmeshki2010designeval,
title = {Design and Evaluation of a Perceptual-based Object Group Selection Technique},
author = {Dehmeshki*, Hoda and Stuerzlinger, Wolfgang},
booktitle = {24th BCS Interaction Specialist Group Conference},
series = {BCS-HCI '10},
year = {2010},
month = {Sep},
pages = {365-372},
doi = {https://doi.org/10.14236/ewic/HCI2010.43},
pdf = {papers/persel.pdf},
video = {videos/PerSel.mp4},
teaser = {teasers/persel.png},
abstract = {Selecting groups of objects is a frequent task in graphical user interfaces since it precedes all manipulation operations. Current selection techniques such as lasso become time-consuming and error-prone in dense configurations or when the area covered by targets is large or hard to reach. Perceptual-based selection techniques can considerably improve the selection task when the targets have a perceptual structure, driven by Gestalt principles of proximity and good continuity. However, current techniques use ad hoc grouping algorithms that often lack evidence from perception science. Moreover, they do not allow selecting arbitrary groups (i.e. without a perceptual structure) or modifying a selection. This paper presents a domain-independent perceptual-based selection technique that addresses these issues. It is built upon an established group detection model from perception research and provides intuitive interaction techniques for selecting (whole or partial) groups with curvi-linear or random structures. Our user study shows that this technique not only outperforms rectangle selection and lasso techniques when targets have perceptual structure, but also it is competitive when targets have arbitrary arrangements.},
keywords = {group selection},
}
@inproceedings{dadgari2010novel,
title = {Novel User Interfaces for Diagram Versioning and Differencing},
author = {Dadgari*, Darius and Stuerzlinger, Wolfgang},
booktitle = {24th BCS Interaction Specialist Group Conference},
series = {BCS-HCI '10},
year = {2010},
month = {Sep},
pages = {62-71},
doi = {https://doi.org/10.14236/ewic/HCI2010.10},
pdf = {papers/version4diagram.pdf},
teaser = {teasers/version4diagram.png},
abstract = {Easily available software for diagram creation does not support the comparison of different versions and the merging of such versions. We present new methods and techniques for easy versioning of general two-dimensional diagrams. Multiple novel versioning methods for diagram versioning are compared to each other as well as to previous work in a user study. Participants in a user study preferred the Translucency View and Master Diagram Scenario to the other investigated methods and scenarios.},
keywords = {difference visualization, diagram},
}
@inproceedings{das2010proactive,
title = {Proactive Interference in Location Learning: A New Closed-Form Approximation},
author = {Das*, Arindam and Stuerzlinger, Wolfgang},
booktitle = {International Conference on Cognitive Modeling},
publisher = {Drexel University},
series = {ICCM '10},
year = {2010},
month = {Aug},
pages = {37-42},
url = {https://iccm-conference.neocities.org/2010/proceedings},
pdf = {papers/proactiveinter.pdf},
teaser = {teasers/proactiveinter.png},
abstract = {The ACT-R cognitive theory models forgetting in general with a constant "decay due to passage of time" parameter. However, this is not sufficient to predict learning for frequently executed tasks in dense arrangements of items. Prominent examples are two-dimensional location learning in finding keys on a keyboard or clicking on items on a web page or in a graphical user interface. Our work presents a new way to theoretically model the effect of Proactive Interference, i.e. the effect of the history of events on location learning, through an extension to ACT-R's mathematical model of declarative memory strength. It predicts that each time an item is searched for and found, the item gets "stronger", i.e. easier to remember. However, this strength diminishes not only through the passage of time, but also due to interference from other (non-target) items that have been encountered in the past. We tested the predictions of our new model against empirical measurements from two previous studies that involve simple visual search and selection. The predictions fit the experimental data very well.},
keywords = {learning, text entry},
}
@inproceedings{zaman2010cloning,
title = {A New Interface for Cloning Objects in Drawing Systems},
author = {Zaman*, Loutfouz and Stuerzlinger, Wolfgang},
booktitle = {Graphics Interface},
series = {GI '10},
year = {2010},
month = {May},
pages = {27-34},
url = {https://graphicsinterface.org/proceedings/gi2010/gi2010-5},
pdf = {papers/cloning.pdf},
teaser = {teasers/cloning.png},
abstract = {Cloning objects is a common operation in graphical user interfaces. One example is calendar systems, where users commonly create and modify recurring events, i.e. repeated clones of a single event. Inspired by the calendar paradigm, we introduce a new cloning technique for 2D drawing programs. This technique allows users to clone objects by first selecting them and then dragging them to create clones along the dragged path. Moreover, it allows editing the generated sequences of clones similar to the editing of calendar events. Novel approaches for the generation of clones of clones are also presented.
We compared our new clone creation technique with generic duplication via copy-and-paste, smart duplication, and a dialog driven technique on a standard desktop system. The results show that the new cloning method is always faster than dialogs and smart duplication for most conditions. We also compared our clone editing method against rectangular selection. The results show that our method is better in general. In situations where rectangle selection is effective, our method is still competitive. Participants preferred the new techniques overall, too.},
keywords = {drawing, cloning, copy, paste},
}
@inproceedings{arif2010predicting,
title = {Predicting the Cost of Error Correction in Character-Based Text Entry Technologies},
author = {Arif*, Ahmed Sabbir and Stuerzlinger, Wolfgang},
booktitle = {{SIGCHI} Conference on Human Factors in Computing Systems},
publisher = {ACM},
series = {CHI '10},
year = {2010},
month = {Apr},
pages = {5-14},
doi = {https://doi.org/10.1145/1753326.1753329},
pdf = {papers/errorcostmodel.pdf},
teaser = {teasers/errorcostmodel.png},
abstract = {Researchers have developed many models to predict and understand human performance in text entry. Most of the models are specific to a technology or fail to account for human factors and variations in system parameters, and the relationship between them. Moreover, the process of fixing errors and its effects on text entry performance has not been studied. Here, we first analyze real-life text entry error correction behaviors. We then use our findings to develop a new model to predict the cost of error correction for character-based text entry technologies. We validate our model against quantities derived from the literature, as well as with a user study. Our study shows that the predicted and observed cost of error correction correspond well. At the end, we discuss potential applications of our new model.},
keywords = {text entry, errors},
}
@inproceedings{phillips2009friction,
title = {Can Friction Improve Mouse-Based Text Selection?},
author = {Phillips*, Dustin and Stuerzlinger, Wolfgang},
booktitle = {International Conference Science and Technology for Humanity},
publisher = {IEEE},
series = {TIC-STH '09},
year = {2009},
month = {Sep},
pages = {89-94},
doi = {https://doi.org/10.1109/TIC-STH.2009.5444369},
pdf = {papers/frictionselect.pdf},
teaser = {teasers/frictionselect.png},
abstract = {Text selection via caret positioning is a common task in modern word processing interfaces. It is a difficult task as target size - the distance between characters - is very small. We adapt Baudisch's snap-and-go technique for target acquisition to insert additional motor space at such targets when the mouse is decelerating. This increases the size of the target in motor space, thus potentially reducing the difficulty of text selection tasks. We expand this idea by introducing the concept of context-sensitive friction to improve target acquisition for common targets. We performed two pilot studies and a controlled user study to evaluate the new techniques. Our results indicate that selectively introducing friction into the interface can reduce total task time in common text selection tasks.},
keywords = {selection, snapping, mouse},
}
@inproceedings{arif2009analysis,
title = {Analysis of Text Entry Performance Metrics},
author = {Arif*, Ahmed Sabbir and Stuerzlinger, Wolfgang},
booktitle = {International Conference Science and Technology for Humanity},
publisher = {IEEE},
series = {TIC-STH '09},
year = {2009},
month = {Sep},
pages = {100-105},
doi = {https://doi.org/10.1109/TIC-STH.2009.5444533},
pdf = {papers/textperfmetrics.pdf},
teaser = {teasers/textperfmetrics.png},
abstract = {Researchers have proposed many text entry systems to enable users to perform this frequent task as quickly and precise as possible. Unfortunately the reported data varies widely and it is difficult to extract meaningful average entry speeds and error rates from this body of work. In this article we collect data from well-designed and well-reported experiments for the most important text entry methods, including those for handheld devices. Our survey results show that thumb keyboard is the fastest text entry method after the standard QWERTY keyboard, and that Twiddler is fastest amongst non-QWERTY methods. Moreover, we survey how text entry errors were handled in these studies. Finally, we conducted a user study to detect which effect different error-handling methodologies have on text entry performance metrics. Our study results show that the way human errors are handled has indeed a significant effect on all frequently used error metrics.},
keywords = {text entry, errors},
}
@inproceedings{teather2009evaluating,
title = {Evaluating Visual/Motor Co-location in Fish-Tank Virtual Reality},
author = {Teather*, Robert J. and Allison, Robert and Stuerzlinger, Wolfgang},
booktitle = {International Conference Science and Technology for Humanity},
publisher = {IEEE},
series = {TIC-STH '09},
year = {2009},
month = {Sep},
pages = {624-629},
doi = {https://doi.org/10.1109/TIC-STH.2009.5444423},
pdf = {papers/colocateddisjoint.pdf},
teaser = {teasers/colocateddisjoint.png},
abstract = {Virtual reality systems often co-locate the display and input (motor) spaces. Many input devices, such as the mouse, use indirect input mappings, and are disjoint from the display space. A study of visual/motor co-location was conducted to determine if there is any benefit to working directly "in" a virtual environment. Using a fish-tank VR setup, participants performed a 3D object movement task. This required moving an object from the centre of the environment to target regions, using a tracked pen, in both co-located and disjoint display/input conditions. Results were analyzed in the context of Fitts' Law, which models rapid aimed movements. Ultimately, no significant differences were found between co-located and disjoint conditions. However, when analyzing object movement in specific directions, the co-located condition was somewhat better than the disjoint one. In particular, movement into the scene was faster when the display and input device were co-located rather than disjoint.},
keywords = {3D pointing},
}
@inproceedings{dehmeshki2009icelasso,
title = {ICE-Lasso: An Enhanced Form Of Lasso Selection},
author = {Dehmeshki*, Hoda and Stuerzlinger, Wolfgang},
booktitle = {International Conference Science and Technology for Humanity},
publisher = {IEEE},
series = {TIC-STH '09},
year = {2009},
month = {Sep},
pages = {630-635},
doi = {https://doi.org/10.1109/TIC-STH.2009.5444424},
pdf = {papers/icelasso.pdf},
teaser = {teasers/icelasso.png},
abstract = {Lasso selection tends to be inefficient in many circumstances such as selecting spatially large clusters. ICE-Lasso is a novel technique that infers likely target clusters during an ongoing lasso gesture. It provides efficient gesture-based interaction techniques as shortcuts to select partial, complete, and multiple clusters. Additionally, it is overloaded on the traditional lasso via automatic mode switching. A comparative user study show that ICE-Lasso is significantly more efficient than lasso and also well-liked by users.},
keywords = {group selection},
}
@inproceedings{scoditti2009new,
title = {A New Layout Method for Graphical User Interfaces},
author = {Scoditti*, Adriano and Stuerzlinger, Wolfgang},
booktitle = {International Conference Science and Technology for Humanity},
publisher = {IEEE},
series = {TIC-STH '09},
year = {2009},
month = {Sep},
pages = {642-647},
doi = {https://doi.org/10.1109/TIC-STH.2009.5444422},
pdf = {papers/intuilayout.pdf},
teaser = {teasers/intuilayout.png},
abstract = {The layout mechanisms for many GUI toolkits are hard to understand, the associated tools and API's often difficult to use. This work investigates new, easy-to-understand layout mechanisms and evaluates its implementation. We will analyze the requirements for the definition of layouts of a graphical user interface. Part of the issue is that several aspects need to be considered simultaneously while laying-out a component: the alignment with other components as well as its own behaviour while resizing its container. Moreover, the used tools should isolate the designer/drawer from the implementation details of the framework. We present the details of our new GUI layout system, discuss the choices we made for our new layout algorithm and detail implementation issues. Moreover, we present also the user interface for our new GUI builder system that contains several innovations, such as a preview window to show the effects of layout configuration choices in real-time. We present an evaluation of our new system by attacking the complex GUI layout problem mentioned above.},
keywords = {GUI, layout},
}
@inproceedings{pavlovych2009tradeoff,
title = {The Tradeoff Between Spatial Jitter and Latency in Pointing Tasks},
author = {Pavlovych*, Andriy and Stuerzlinger, Wolfgang},
booktitle = {Symposium on Engineering Interactive Computing Systems},
publisher = {ACM},
series = {EICS '09},
year = {2009},
month = {Jul},
pages = {187-196},
doi = {https://doi.org/10.1145/1570433.1570469},
pdf = {papers/latencyjitter.pdf},
teaser = {teasers/latencyjitter.png},
abstract = {Interactive computing systems frequently use pointing as an input modality, while also supporting other forms of input such as alphanumeric, voice, gesture, and force.We focus on pointing and investigate the effects of input device latency and spatial jitter on 2D pointing speed and accuracy. First, we characterize the latency and jitter of several common input devices. Then we present an experiment, based on ISO 9241-9, where we systematically explore combinations of latency and jitter on a desktop mouse to measure how these factors affect human performance. The results indicate that, while latency has a stronger effect on human performance compared to low amounts of spatial jitter, jitter dramatically increases the error rate, roughly inversely proportional to the target size.The findings can be used in the design of pointing devices for interactive systems, by providing a guideline for choosing parameters of spatial filtering to compensate for jitter, since stronger filtering typically also increases lag. We also describe target sizes at which error rates start to increase notably, as this is relevant for user interfaces where hand tremor or similar factors play a major role.},
keywords = {pointing, jitter},
}
@inproceedings{dehmeshki2009gpsel,
title = {GPSel: A Gestural Perceptual-based Path Selection Technique},
author = {Dehmeshki*, Hoda and Stuerzlinger, Wolfgang},
booktitle = {Smart Graphics},
publisher = {Springer},
series = {SG '09},
year = {2009},
month = {May},
volume = {LNCS 5531},
pages = {243-252},
doi = {https://doi.org/10.1007/978-3-642-02115-2_21},
pdf = {papers/gpsel.pdf},
teaser = {teasers/gpsel.png},
abstract = {This paper introduces a gestural perceptual-based approach to select objects, i.e., nodes and/or edges along paths. Based on known results from perception research, we propose a model to detect perceptually salient paths formed by the Gestalt principles of good continuity and closure. Then we introduce gestural interaction techniques that enable users to select single or multiple perceptual paths, as well as resolving ambiguities in selection. The result of a user study shows that our system outperforms current techniques for path selection.},
keywords = {group selection, gestures},
}
@inproceedings{teather2009effectstracking,
title = {Effects of Tracking Technology, Latency, and Spatial Jitter on Object Movement},
author = {Teather*, Robert J. and Pavlovych*, Andriy and Stuerzlinger, Wolfgang and {MacKenzie}, I. Scott},
booktitle = {Symposium on {3D} User Interfaces},
publisher = {IEEE},
series = {3DUI '09},
year = {2009},
month = {Mar},
pages = {43-50},
doi = {https://doi.org/10.1109/3DUI.2009.4811204},
pdf = {papers/deviceeffects3D.pdf},
teaser = {teasers/deviceeffects3D.png},
abstract = {We investigate the effects of input device latency and spatial jitter on 2D pointing tasks and 3D object movement tasks. First, we characterize jitter and latency in a 3D tracking device and an optical mouse used as a baseline comparison. We then present an experiment based on ISO 9241-9, which measures performance characteristics of pointing devices. We artificially introduce latency and jitter to the mouse and compared the results to the 3D tracker. Results indicate that latency has a much stronger effect on human performance than low amounts of spatial jitter. In a second study, we use a subset of conditions from the first to test latency and jitter on 3D object movement. The results indicate that large, uncharacterized jitter ldquospikesrdquo significantly impact 3D performance.},
keywords = {3D pointing, latency, jitter},
}
@inproceedings{das2008modeling,
title = {Modeling Learning Effects in Mobile Texting},
author = {Das*, Arindam and Stuerzlinger, Wolfgang},
booktitle = {International Conference on Mobile and Ubiquitous Multimedia},
publisher = {ACM},
series = {MUM '08},
year = {2008},
month = {Dec},
pages = {154-161},
doi = {https://doi.org/10.1145/1543137.1543169},
pdf = {papers/learneffectsmodel.pdf},
teaser = {teasers/learneffectsmodel.png},
abstract = {No work on mobile text messaging so far has taken into account the effect of learning on the change in visual exploration behavior as users progress from non-expert to expert level. We discuss within the domain of multi-tap texting on mobile phone and address the process of searching versus selecting a letter on the keypad interface. We develop a simulation model that forecasts the probability of letter location recall by non-expert users and thereby models learning, as the user acquires expertise in recalling, with practice, session after session. We then plugin this probability within a model of visual strategy that combines the effect of different ways visual exploration: non-expert users search for a letter while expert users select a letter. The observed non-expert non-motor time preceding a key press (for a letter) correlates extremely well with the simulation results.},
keywords = {text entry, learning},
}
@inproceedings{teather2008exaggerated,
title = {Exaggerated Head Motions for Game Viewpoint Control},
author = {Teather*, Robert J. and Stuerzlinger, Wolfgang},
booktitle = {Conference on Future Play: Research, Play, Share},
publisher = {ACM},
series = {FuturePlay '08},
year = {2008},
month = {Nov},
pages = {240-243},
doi = {https://doi.org/10.1145/1496984.1497034},
pdf = {papers/headmotion.pdf},
teaser = {teasers/headmotion.png},
abstract = {In this paper, we present an evaluation of exaggerated headcoupled camera motions in a game-like 3D object movement. Three exaggeration levels were compared to determine if the exaggeration was more beneficial than a realistic 1:1 mapping.The results suggest that there is some user preference for this type of exaggeration; however, no significant differences by the experimental conditions were found, other than a learning effect.},
keywords = {3D navigation, head motion},
}
@inproceedings{pavlovych2008screenconfiguration,
title = {Effect of Screen Configuration and Interaction Devices in Shared Display Groupware},
author = {Pavlovych*, Andriy and Stuerzlinger, Wolfgang},
booktitle = {3rd Workshop on Human-centered Computing},
publisher = {ACM},
series = {HCC '08},
year = {2008},
month = {Oct},
pages = {49-56},
doi = {https://doi.org/10.1145/1462027.1462035},
pdf = {papers/multi_effects.pdf},
teaser = {teasers/multi_effects.png},
abstract = {Interactive tabletop and wall surfaces support collaboration and interactivity in novel ways. Apart from keyboards and mice, such systems can also incorporate other input devices, namely laser pointers, marker pens with screen location sensors, or touch-sensitive surfaces. Similarly, instead of a vertically positioned desktop monitor, collaborative setups typically use much larger displays, which are oriented either vertically (wall) or horizontally (tabletop), or combine both kinds of surfaces.In this paper we describe an empirical study that investigates how technical system constraints can affect group performance in high pace collaborative tasks. For this, we compare various input and output modalities in a system that consists of several interactive tabletop and wall surface(s). We observed that the performance of a group of people scaled almost linearly with the number of participants on an almost perfectly parallel task. We also found that mice were significantly faster than laser pointers, but only by 21%. Also, interaction on walls was significantly faster than on the tabletop, by 51%.},
keywords = {groupware, large display interaction, large display system},
}
@inproceedings{dehmeshki2008groupselect,
title = {Intelligent Mouse-based Object Group Selection},
author = {Dehmeshki*, Hoda and Stuerzlinger, Wolfgang},
booktitle = {Smart Graphics 2008},
publisher = {Springer},
series = {SG '08},
year = {2008},
month = {Aug},
volume = {LNCS 5166},
pages = {33-44},
doi = {https://doi.org/10.1007/978-3-540-85412-8_4},
pdf = {papers/gestaltclick1.pdf},
video = {videos/Gestalt.mp4},
teaser = {teasers/gestaltclick1.png},
abstract = {Modern graphical user interfaces support direct manipulation of objects and object groups. Current object group selection techniques such as lasso and rectangle selection can be time-consuming and error-prone. This paper presents a new approach to group selection that exploits the way human perception naturally groups objects, also known as Gestalt grouping. Based on known results from perception research, we present a novel method to group objects via models of the Gestalt principles of proximity and (curvi-)linearity. Then, we introduce several new mouse-based selection techniques that exploit these Gestalt groups. The results of a user study show that our new technique outperforms lasso and rectangle selection for object groups with an implicit structure, such as (curvi-)linear arrangements or clusters.},
keywords = {group selection},
}
@inproceedings{kerr2008context,
title = {Context-Sensitive Cut, Copy, and Paste},
author = {Kerr+, Reid and Stuerzlinger, Wolfgang},
booktitle = {Conference on Computer Science and Software Engineering},
publisher = {ACM},
series = {C3S2E '08},
year = {2008},
month = {May},
pages = {159-166},
doi = {https://doi.org/10.1145/1370256.1370283},
pdf = {papers/csccap.pdf},
teaser = {teasers/csccap.png},
abstract = {Creating and editing source code are tedious and error-prone processes. One important source of errors in editing programs is the failure to correctly adapt a block of copied code to a new context. This occurs because several dependencies to the surrounding code usually need to be adapted for the new context and it is easy to forget one of them. Conversely, this also makes such errors hard to find.This paper presents a new method for identifying some common types of errors in cut, copy and paste operations. The method analyzes the context of the original block of code and tries to match it with the context in the new location. It utilizes a simple, pattern-based model of context, which we found to be well suited to the analysis of relocated blocks of text. Furthermore, we discuss the ability of our technique to detect semantic errors. While semantic errors are relatively difficult to recognize in a static document, our new technique can infer important information from the original context to detect some semantic mismatches. Finally, we present a proof-of-concept implementation and discuss our simple user interface for context-sensitive cut, copy and paste.},
keywords = {copy, paste, editing, context-sensitive},
}
@inproceedings{teather2008assessing,
title = {Assessing the Effects of Orientation and Device on (Constrained) {3D} Movement Techniques},
author = {Teather*, Robert J. and Stuerzlinger, Wolfgang},
booktitle = {Symposium on {3D} User Interfaces},
publisher = {IEEE},
series = {3DUI '08},
year = {2008},
month = {Mar},
pages = {43-50},
doi = {https://doi.org/10.1109/3DUI.2008.4476590},
pdf = {papers/move3deval.pdf},
teaser = {teasers/move3deval.png},
abstract = {We present two studies to assess which physical factors influence 3D object movement tasks with various input devices. Since past research has shown that a mouse with suitable mapping techniques can serve as a good input device for some 3D object movement tasks, we also evaluate which characteristics of the mouse sustain its success. Our first study evaluates the effect of a supporting surface across orientation of input device movement and display orientation. A 3D tracking device was used in all conditions for consistency. The results of this study are inconclusive; no significant differences were found between the factors examined. The results of a second study show that the mouse outperforms the tracker for speed in all instances. The presence of support also improved accuracy when tracker movement is limited to 2D operation. A 3DOF movement mode performed worst overall.},
keywords = {3D positioning, 3D pointing, orientation},
}
@inproceedings{teather2007guidelines,
title = {Guidelines for {3D} Positioning Techniques},
author = {Teather*, Robert J. and Stuerzlinger, Wolfgang},
booktitle = {Conference on Future Play},
publisher = {ACM},
series = {Futureplay '07},
year = {2007},
month = {Nov},
pages = {61-68},
doi = {https://doi.org/10.1145/1328202.1328214},
pdf = {papers/move3dguidelines.pdf},
teaser = {teasers/move3dguidelines.png},
abstract = {In this paper, we present a set of guidelines for designing 3D positioning techniques. These guidelines are intended for developers of object interaction schemes in 3D games, modeling packages, computer aided design systems, and virtual environments. The guidelines promote intuitive object movement techniques in these types of environments.We then present a study comparing 3D positioning techniques based on these guidelines with 2D and 3D/6D devices across VR display technologies. Display technologies such as stereoscopic graphics and head-coupled perspective provide additional depth cues and could affect how a user perceives and thus interacts with a 3D scene - regardless of the input device/technique used. Thus they are examined as well. The results suggest that 2D devices using "smart" movement algorithms can outperform 3D devices.},
keywords = {3D positioning, orientation},
}
@inproceedings{das2007cognitive,
title = {A Cognitive Simulation Model for Novice Text Entry on Cell Phone Keypads},
author = {Das*, Arindam and Stuerzlinger, Wolfgang},
booktitle = {14th European Conference on Cognitive Ergonomics: Invent! Explore!},
publisher = {ACM},
series = {ECCE '07},
year = {2007},
month = {Aug},
pages = {141-147},
doi = {https://doi.org/10.1145/1362550.1362579},
pdf = {papers/novicecogmodel.pdf},
teaser = {teasers/novicecogmodel.png},
abstract = {Motivation - To create a cognitive simulation model that predicts text entry performance and learning on cell phone keypads by novice users. Research approach - A programmable cognitive architecture, ACT-R, is used to execute the simulation model. Part of the simulation result is compared with the result of a previous user study. Findings/Design - The proposed model is an a priori model (not tuned to any real user data) that predicts the amount of time spent in finding a key on the keypad and pressing it repeatedly. The predicted amount of time in finding a key differs by 6% and the time between two repeated key-presses of the same key by 27% compared to the results of a previous user study. The model also captures the learning of keypad layout by novice users. Memorization of keypad layout is simulated using task repetition. Research limitations/Implications - This research has several limitations described towards the end of this paper. An important one among them is that the work does not model the impact of visual distracters in the field of view (frontal surface of the handset) on user performance. Originality/Value - This is the first cognitive simulation model of novice user's text entry performance and learning on cell phone keypads. Take away message - This work introduces an a priori congnitive model of text entry by novice users. This forms a basis for systematic exploration of keypad designs for cell phones in shorter time and lower cost.},
keywords = {text entry, learning},
}
@inproceedings{tumanov2007variabilityaware,
title = {Variability-Aware Latency Amelioration in Distributed Environments},
author = {Tumanov*, Alexey and Allison, Robert and Stuerzlinger, Wolfgang},
booktitle = {Virtual Reality Conference},
publisher = {IEEE},
series = {VR '07},
year = {2007},
month = {Mar},
pages = {123-130},
doi = {https://doi.org/10.1109/VR.2007.352472},
pdf = {papers/latencypredict.pdf},
teaser = {teasers/latencypredict.png},
abstract = {Application designers of collaborative distributed virtual environments must account for the influence of the network connection and its detrimental effects on user performance. Based upon analysis and classification of existing latency compensation techniques, this paper introduces a novel approach to latency amelioration in the form of a two-tier predictor-estimator framework. The technique is variability-aware due to its proactive sender-side prediction of a pose a variable time into the future. The prediction interval required is estimated based on current and past network delay characteristics. This latency estimate is subsequently used by a Kalman filter-based predictor to replace the measurement event with a predicted pose that matches the event's arrival time at the receiving workstation. The compensation technique was evaluated in a simulation through an offline playback of real head motion data and network delay traces collected under a variety of real network conditions. The experimental results indicate that the variability-aware approach significantly outperforms a state-of-the-art one, which assumes a constant system delay},
keywords = {latency, jitter, virtual reality},
}
@inproceedings{stuerzlinger2006uifacades,
title = {User Interface Façades: Towards Fully Adaptable User Interfaces},
author = {Stuerzlinger, Wolfgang and Chapuis, Olivier and Phillips*, Dustin and Roussel, Nicolas},
booktitle = {19th Symposium on User Interface Software and Technology},
publisher = {ACM},
series = {UIST '06},
year = {2006},
month = {Oct},
pages = {309-318},
doi = {https://doi.org/10.1145/1166253.1166301},
url = {https://ws.iat.sfu.ca/facades},
pdf = {papers/uifacades.pdf},
video = {videos/uifacades.mp4},
teaser = {teasers/uifacades.png},
abstract = {User interfaces are becoming more and more complex. Adaptable and adaptive interfaces have been proposed to address this issue and previous studies have shown that users prefer interfaces that they can adapt to self-adjusting ones. However, most existing systems provide users with little support for adapting their interfaces. Interface customization techniques are still very primitive and usually constricted to particular applications. In this paper, we present User Interface Façades, a system that provides users with simple ways to adapt, reconfigure, and re-combine existing graphical interfaces, through the use of direct manipulation techniques. The paper describes the user's view of the system, provides some technical details, and presents several examples to illustrate its potential.},
keywords = {facades, GUI, layout, copy, paste},
}
@inproceedings{oh2006sesame,
title = {{SESAME}: Towards Better {3D} Conceptual Design Systems},
author = {Oh*, Ji-Young and Stuerzlinger, Wolfgang and Danahy, John},
booktitle = {6th Conference on Designing Interactive Systems},
publisher = {ACM},
series = {DIS '06},
year = {2006},
month = {Jun},
pages = {80-89},
doi = {https://doi.org/10.1145/1142405.1142419},
pdf = {papers/sesameui.pdf},
video = {videos/sesame.m4v},
teaser = {teasers/sesameui.png},
abstract = {Conceptual design dominates the early stages of most creative design processes. During these stages, the designer makes important decisions about the parameters of a model that are aimed at satisfying a set of design criteria. To do this, the designer produces many sketches of various possible solutions. Meanwhile, computer-aided design (CAD) systems are becoming the dominant visual medium used in design practice. However, these tools evolved as documentation production tools and do not support conceptual thinking. This paper presents a list of guidelines for computer support for conceptual design activities on 3D scenes and presents SESAME (Sketch, Extrude, Sculpt, and Manipulate Easily), a system based on these guidelines. Finally, we present a user study comparing SESAME with a conventional CAD package to demonstrate the effectiveness of SESAME.},
keywords = {design, snapping, 3D positioning, 3D manipulation, 3D modeling},
}
@inproceedings{baradaran2006comparison,
title = {A Comparison of Real and Virtual {3D} Construction Tools with Novice Users},
author = {Baradaran+, Hooman and Stuerzlinger, Wolfgang},
booktitle = {International Conference on Computer Graphics & Virtual Reality},
series = {CGVR '06},
isbn = {978-1-93241585-8},
year = {2006},
month = {Jun},
pages = {10-14},
url = {https://dblp.org/db/conf/cgvr/cgvr2006},
pdf = {papers/hapticslego.pdf},
teaser = {teasers/hapticslego.png},
abstract = {In this paper, we present the results of a comparative evaluation of a "virtual Lego" system against real Lego bricks with novice users. The virtual Lego system was designed to emulate the behavior of real Lego bricks as close as possible, while still allowing for efficient operation. We implemented two different user interfaces for the virtual Lego system, namely controlling it with a 2D mouse, based on an efficient mapping from 2D to 3D, as well as with a 3D haptics device, which provides haptic feedback to the user. The results of our study show that real Lego is still significantly faster for first-time users (i.e. users with minimal training). A more surprising result is that the 2D mouse condition and the 3D haptics condition did not differ significantly - even though the 3D haptics condition provides much richer feedback. We discuss the results and speculate about the underlying reasons.},
keywords = {haptics, 3D positioning, 3D manipulation, design, lego},
}
@inproceedings{parilov2006multiview,
title = {Multi-view Visibility Orderings for Real-Time Point-Sampled Rendering},
author = {Parilov*, Sergey and Stuerzlinger, Wolfgang},
booktitle = {International Conference on Computer Graphics & Virtual Reality},
series = {CGVR '06},
isbn = {978-1-93241585-8},
year = {2006},
month = {Jun},
pages = {125-131},
url = {https://dblp.org/db/conf/cgvr/cgvr2006},
pdf = {papers/fastibr.pdf},
video = {videos/ibr_pointsampled.mp4},
teaser = {teasers/fastibr.png},
abstract = {Occlusion-compatible traversals and z-buffering are often regarded as the only choices for resolving visibility in the image- and point-based rendering community. These algorithms do either per-frame or per-pixel computations. This paper first discusses visibility orderings for point samples in general and then discusses orderings that are valid for multiple views. Then we present a novel, highly efficient, visibility algorithm for point-sampled models that has much smaller per-frame cost than previous approaches. We also discuss a high-performance, cache friendly implementation of this visibility method and present results. Finally, we speculate on possible hardware implementations.},
keywords = {rendering, real-time, visibility},
}
@inproceedings{boehl2006areashadow,
title = {Real-time Computation Of Area Shadows - A Geometrical Algorithm},
author = {Boehl*, Michael and Stuerzlinger, Wolfgang},
booktitle = {International Conference on Computer Graphics & Virtual Reality},
series = {CGVR '06},
isbn = {978-1-93241585-8},
year = {2006},
month = {Jun},
pages = {118-124},
url = {https://dblp.org/db/conf/cgvr/cgvr2006},
pdf = {papers/penumbras.pdf},
teaser = {teasers/penumbras.png},
abstract = {The computation of soft shadows created by area light sources is a well-known problem in computer graphics. Due to the complexity of the problem, soft shadows commonly are generated only for images that are rendered in an off-line process. In interactive virtual environments, where images have to be computed in real time, soft shadows are mostly replaced by hard shadows as this takes much less time to compute.
This paper presents an algorithm that uses a geometrical method to generate a triangulated approximation of the soft shadow cast by a polygonal object very quickly. The algorithm can simulate effects such as the varying width of penumbras depending on distance to the light and can be extended to support non-convex light sources as well. We mention the artifacts arising from triangulation and give discuss how to alleviate such problems.},
keywords = {rendering, real-time},
}
@inproceedings{oh2006groupselect,
title = {Group Selection Techniques for Efficient {3D} Modeling},
author = {Oh*, Ji-Young and Stuerzlinger, Wolfgang and Dadgari*, Darius},
booktitle = {Symposium on {3D} User Interfaces},
publisher = {IEEE},
series = {3DUI '06},
year = {2006},
month = {Mar},
pages = {95-102},
doi = {https://doi.org/10.1109/VR.2006.66},
pdf = {papers/sesamegrouping.pdf},
video = {videos/sesame_multiclick.m4v},
teaser = {teasers/sesamegrouping.png},
abstract = {Object selection and manipulation (e.g. moving, rotating) are the most basic tasks in 3D scene construction. While most research on selection and manipulation techniques targets single objects, we examine the concept of group selection in this paper. Group selection is often given lesser importance than single object selection, yet is vital in providing users with a way to modify larger scenes with objects which are repetitive, sequential, or otherwise inherently understood as 'belonging together' by a user. We observed users manipulating objects in 3D scenes, and while doing so, they clearly expected that objects would be grouped based on their gravitational relationship. That is, all objects that are supported by some selected object will follow the motion of the selected object when manipulated. In this paper, we present a system that efficiently supports the manipulation of groups of objects via a gravitational hierarchy. As this hierarchy is derived with a collision detector, the new grouping techniques do not require semantic or user specified information to work. The results of the evaluation show that using the gravitational hierarchy improves scene rearrangement significantly compared to conventional non-hierarchical methods. Finally, we discuss lessons learned from this study and make some suggestions on how the results can be incorporated into other systems.},
keywords = {group selection, 3D positioning, 3D modeling, 3D manipulation},
}
@inproceedings{pavlovych2005hdrproject,
title = {A High-Dynamic Range Projection System},
author = {Pavlovych*, Andriy and Stuerzlinger, Wolfgang},
booktitle = {Photonic Applications in Biosensing and Imaging},
publisher = {SPIE},
series = {Photonics North '05},
year = {2005},
month = {Sep},
volume = {SPIE 5969},
numpages = {8},
doi = {https://doi.org/10.1117/12.629117},
url = {https://ws.iat.sfu.ca/hdrproj.html},
pdf = {papers/hdrproject.pdf},
teaser = {teasers/hdrproject.png},
abstract = {The dynamic range in many real-world environments surpasses the capabilities of traditional display technologies by several orders of magnitude. Recently, a novel display capable of displaying images with a dynamic range much closer to real world situations has been demonstrated. This was achieved through a spatially modulated backlight behind an LCD panel. Combined with the modulating power of the LCD panel itself, this enabled the display of much higher contrast compared to an LCD panel with a spatially uniform backlight.
In this paper, we describe a further development of the technology, namely a high dynamic range projection system. This makes such display systems more widely applicable as any surface can be used for the display of high dynamic range images.
Our new system is designed as an external attachment to a regular DLP-based projector, which allows the use of unmodified projectors. It works by adapting the projected image via a set of lenses to form a small image. This small image is then modulated via an LCD panel and the result is projected via another lens system onto a larger screen, as in traditional projection scenarios. The double modulation, by the projector and the LCD panel together, creates a high dynamic range image and an ANSI contrast of over 700:1.
Finally, we discuss the advantages and disadvantages of our design relative to other high and low dynamic range display technologies and its potential applications.},
keywords = {high dynamic range, projector},
}
@inproceedings{oh2005comparing,
title = {Comparing {SESAME} and Sketching on Paper for Conceptual {3D} Design},
author = {Oh*, Ji-Young and Stuerzlinger, Wolfgang and Danahy, John},
booktitle = {Sketch-Based Interfaces and Modeling},
publisher = {Eurographics},
series = {SBM '05},
year = {2005},
month = {Aug},
pages = {81-88},
doi = {https://doi.org/10.2312/SBM/SBM05/081-087},
pdf = {papers/sesamecompare.pdf},
teaser = {teasers/sesamecompare.png},
abstract = {In the early stages of design, several concepts are usually generated to explore the possibilities. This paper investigates how well a computer-based system can support design thinking. SESAME is a novel 3D design system that aims to support creativity during the explorative phase of the design process. We report an evaluation comparing SESAME to paper sketching for early design exploration in an urban design scenario. Through the user evaluation, we illustrate how important it is to support essential properties of traditional sketching, such as rapid creation/modification, emergent shapes, and tolerance to ambiguity. Additionally, we show that a 3D system can indeed facilitate form exploration at the early stages of design thinking.},
keywords = {3D modeling, 3D manipulation, 3D sketching, drawing},
footnote = {SESAME was a co-evolution with SketchUp, https://www.sketchup.com},
}
@inproceedings{pavlovych2005analysis,
title = {An Analysis of Novice Text Entry Performance on Large Interactive Wall Surfaces},
author = {Pavlovych*, Andriy and Stuerzlinger, Wolfgang},
booktitle = {Human Computer International, CD},
publisher = {Lawrence Erlbaum},
series = {HCI International '05},
isbn = {978-080585807-5},
year = {2005},
month = {Jul},
numpages = {10},
url = {http://www.hci.international/index.php?module=conference&CF_op=view&CF_id=4},
pdf = {papers/whiteboardtext.pdf},
teaser = {teasers/whiteboardtext.png},
abstract = {This paper presents a comparative study of several soft keyboard layouts for text entry on interactive whiteboards. We compare the traditional QWERTY with several other layouts, including theoretically optimal ones, such as FITALY. In contrast to previous work, we concentrate on novice performance, as few people ever gain expert status on whiteboards.
The results show that for a population of regular keyboard users, QWERTY is the best alternative and even the slightest deviations from that arrangement degrade the performance significantly. Based on the experiments, we present an in-depth analysis of the behaviour of users for several layouts from a cognitive viewpoint.},
keywords = {text entry, large display interaction, novice},
}
@inproceedings{stachniak2005terrain,
title = {An Algorithm for Automated Fractal Terrain Deformation},
author = {Stachniak*, Szymon and Stuerzlinger, Wolfgang},
booktitle = {Computer Graphics and Artificial Intelligence},
series = {3IA '05},
commented-isbn = {978-291425607-0},
year = {2005},
month = {May},
pages = {64-76},
url = {http://www.msi.unilim.fr/3IA},
pdf = {papers/fractaldeform.pdf},
video = {videos/fractal_deform.mp4},
teaser = {teasers/fractaldeform.png},
abstract = {Fractal terrains provide an easy way to generate realistic landscapes. There are several methods to generate fractal terrains, but none of those algorithms allow the user much flexibility in controlling the shape or properties of the final outcome. A few methods to modify fractal terrains have been previously proposed, both algorithm-based as well as by hand editing, but none of these provide a general solution.
In this work, we present a new algorithm for fractal terrain deformation. We present a general solution that can be applied to a wide variety of deformations. Our approach employs stochastic local search to identify a sequence of local modifications, which deform the fractal terrain to conform to a set of specified constraints. The presented results show that the new method can incorporate multiple constraints simultaneously, while still preserving the natural look of the fractal terrain.},
keywords = {fractal, terrain, rendering, ray tracing},
}
@inproceedings{oh2005moving,
title = {Moving Objects with {2D} Input Devices in CAD Systems and Desktop Virtual Environments},
author = {Oh*, Ji-Young and Stuerzlinger, Wolfgang},
booktitle = {Graphics Interface},
series = {GI '05},
year = {2005},
month = {May},
pages = {195-202},
url = {https://graphicsinterface.org/proceedings/gi2005/gi2005-24},
pdf = {papers/move3d.pdf},
video = {videos/sesameMove3D2005.mp4},
teaser = {teasers/move3d.png},
abstract = {Part assembly and scene layout are basic tasks in 3D design in Desktop Virtual Environment (DVE) systems as well as Computer Aided Design (CAD) systems. 2D input devices such as a mouse or a stylus are still the most common input devices for such systems. With such devices, a notably difficult problem is to provide an efficient and predictable object motion in 3D based on their 2D motion. This paper presents a new technique to move objects in CAD/DVE using 2D input devices.
The technique presented in this paper utilizes the fact that people easily recognize the depth-order of shapes based on occlusions. In the presented technique, the object position follows the mouse cursor position, while the object slides on various surfaces in the scene. In contrast to existing techniques, the movement surface and the relative object position is determined using the whole area of overlap of the moving object with the static scene. The resulting object movement is visually smooth and predictable, while avoiding undesirable collisions. The proposed technique makes use of the framebuffer for efficiency and runs in real-time. Finally, the evaluation of the new technique with a user study shows that it compares very favorably to conventional techniques.},
keywords = {3D positioning, 3D modeling, 3D manipulation, sliding},
}
@inproceedings{vorozcovs2005hedgehog,
title = {The Hedgehog: A Novel Optical Tracking Method for Spatially Immersive Displays},
author = {Vorozcovs*, Andrew and Hogue*, Andrew and Stuerzlinger, Wolfgang},
booktitle = {Virtual Reality},
publisher = {IEEE},
series = {VR '05},
year = {2005},
month = {Mar},
pages = {83-89},
doi = {https://doi.org/10.1109/VR.2005.1492757},
pdf = {papers/hedgehog.pdf},
teaser = {teasers/hedgehog.png},
abstract = {Existing commercial technologies do not adequately meet the requirements for tracking in fully-enclosed VR displays. We present the Hedgehog, which overcomes several limitations imposed by existing sensors and tracking technology. The tracking system robustly and reliably estimates the 6DOF pose of the device with high accuracy and a reasonable update rate. The system is composed of several cameras viewing the display walls and an arrangement of laser diodes secured to the user. The light emitted from the lasers projects onto the display walls and the 2D centroids of the projections are tracked to estimate the 6DOF pose of the device. The system is able to handle ambiguous laser projection configurations, static and dynamic occlusions of the lasers, and incorporates an intelligent laser activation control mechanism that determines which lasers are most likely to improve the pose estimate. The Hedgehog is also capable of performing auto-calibration of the necessary camera parameters through the use of the SCAAT algorithm. A preliminary evaluation reveals that the system has an angular resolution of 0.01 degrees RMS and a position resolution of 0.2 mm RMS.},
keywords = {3D tracking},
}
@inproceedings{pavlovych2004laser,
title = {Laser Pointers as Interaction Devices for Collaborative Pervasive Computing},
author = {Pavlovych*, Andriy and Stuerzlinger, Wolfgang},
booktitle = {Advances in Pervasive Computing},
publisher = {OCG},
series = {Pervasive '04},
isbn = {978-385403176-5},
year = {2004},
month = {Apr},
pages = {315-320},
url = {http://www.pervasive2004.org},
pdf = {papers/lasers_improved.pdf},
teaser = {teasers/lasers_improved.png},
abstract = {We present a system that supports collaborative interactions for arbitrary environments. The system uses laser pointers as interaction devices and employs a video camera to detect where each laser pointer is pointing. Time-division multiplexing together with a wireless link affords discrimination between laser pointer dots belonging to different pointers. Safety issues with laser pointers are addressed with a new technique. We also discuss how new users can be dynamically added and removed from the system.},
keywords = {pointing, collaboration, laser},
}
@inproceedings{pavlovych2004model,
title = {Model for non-Expert Text Entry Speed on 12-Button Phone Keypads},
author = {Pavlovych*, Andriy and Stuerzlinger, Wolfgang},
booktitle = {{SIGCHI} Conference on Human Factors in Computing Systems},
publisher = {ACM},
series = {CHI '04},
year = {2004},
month = {Apr},
pages = {351-358},
doi = {https://doi.org/10.1145/985692.985737},
pdf = {papers/novicemodel.pdf},
teaser = {teasers/novicemodel.png},
abstract = {In this paper we present a new model for predicting text entry speed on a 12-button mobile phone keypad. The proposed model can predict the performance of novice users. Like other models for text entry, the proposed model includes a movement component based on Fitts' law and a linguistic component based on letter digraph probabilities. It also adds cognitive delay times before key presses and takes into account the fact that Fitts' law cannot model multiple presses of the same key accurately. Finally, we compare the prediction of our model to previously published experimental results, demonstrate that it fits observed results for novices very well, and list some observations about learning.},
keywords = {text entry, mode, novice},
}
@inproceedings{oh2003intelligent,
title = {Intelligent Manipulation Techniques for Conceptual {3D} Design},
author = {Oh*, Ji-Young and Stuerzlinger, Wolfgang},
booktitle = {Human-Computer Interaction},
publisher = {IFIP},
series = {INTERACT '03},
isbn = {978-158603363-7},
year = {2003},
month = {Sep},
pages = {319-326},
url = {https://www.interaction-design.org/literature/conference/proceedings-of-ifip-interact03-human-computer-interaction},
pdf = {papers/legomanip.pdf},
video = {videos/lego.m4v},
teaser = {teasers/legomanip.png},
abstract = {One of the main operations in conceptual 3D design is the rearrangement of single and composite objects. This paper presents a new conceptual 3D design system that affords easy manipulation of composite objects. We discuss several alternative manipulation techniques to separate complex parts off an existing model. Then, we present a new way to move such parts in a 3D scene, as well as an algorithm to place parts at arbitrary locations. Finally, we present and discuss the results of a user study of these manipulation techniques.},
keywords = {3D modeling, 3D positioning, 3D manipulation, lego},
}
@inproceedings{pavlovych2003lesstap,
title = {Less-Tap: A Fast and Easy-to-learn Text Input Technique for Phones},
author = {Pavlovych*, Andriy and Stuerzlinger, Wolfgang},
booktitle = {Graphics Interface},
series = {GI '03},
year = {2003},
month = {Jun},
pages = {97-104},
doi = {https://doi.org/10.20380/GI2003.12},
pdf = {papers/lesstap.pdf},
teaser = {teasers/lesstap.png},
abstract = {A new technique to enter text using a mobile phone keypad, Less-Tap, is described. The traditional touch-tone phone keypad is ambiguous for text input because each button encodes 3 or 4 letters. As in Multitap, our method requires the user to press buttons repeatedly to get a required letter. However, in Less-Tap, letters are rearranged within each button according to their frequency. This way, the most common letters require only one key press.
Unlike dictionary based methods, Less-Tap facilitates the entry of arbitrary words. Unlike LetterWise and T9, Less-Tap allows entering text without having to visually verify the result, after some initial training. For English, Less-Tap requires an average of 1.5266 keystrokes per character (vs. 2.0342 in Multitap).
We conducted a user study to compare Less-Tap against Multitap. Each participant had three 20-minute sessions with each technique. The mean entry speed was 9.5% higher with the new technique.},
keywords = {text entry, mobile device},
}
@inproceedings{oh2002laser,
title = {Laser Pointers as Collaborative Pointing Devices},
author = {Oh*, Ji-Young and Stuerzlinger, Wolfgang},
booktitle = {Graphics Interface},
series = {GI '02},
year = {2002},
month = {May},
pages = {141-149},
doi = {https://doi.org/10.20380/GI2002.17},
pdf = {papers/multi_laser.pdf},
video = {videos/laser_multi.mp4},
teaser = {teasers/multi_laser.png},
abstract = {Single Display Groupware (SDG) is a research area that focuses on providing collaborative computing environments. Traditionally, most hardware platforms for SDG support only one person interacting at any given time, which limits collaboration. In this paper, we present laser pointers as input devices that can provide concurrent input streams ideally required to the SDG environment.
First, we discuss several issues related to utilization of laser pointers and present the new concept of computer controlled laser pointers. Then we briefly present a performance evaluation of laser pointers as input devices and a baseline comparison with the mouse according to the ISO 9241-9 standard.
Finally, we describe a new system that uses multiple computer controlled laser pointers as interaction devices for one or more displays. Several alternatives for distinguishing between different laser pointers are presented, and an implementation of one of them is demonstrated with SDG applications.},
keywords = {laser, pointing, collaboration},
}
@inproceedings{stuerzlinger2002efficient,
title = {Efficient Manipulation of Object Groups in Virtual Environments},
author = {Stuerzlinger, Wolfgang and Smith*, Graham},
booktitle = {Virtual Reality},
publisher = {IEEE},
series = {VR '02},
year = {2002},
month = {Mar},
pages = {251-258},
doi = {https://doi.org/10.1109/VR.2002.996529},
pdf = {papers/mive_vr2002.pdf},
video = {videos/mive_duals.mp4},
teaser = {teasers/mive_vr2002.png},
abstract = {We describe simple techniques for object group manipulation, an important operation in user interaction with a virtual environment. All presented manipulation techniques exploit constraints to simplify user interaction. The techniques are based on how humans perceive groups and afford direct manipulation of such groups. Furthermore, we introduce two new intuitive ways to create a whole group of objects: drag-add and random drag-add. Finally, we present an evaluation of the presented techniques.},
keywords = {group selection, 3D positioning, 3D manipulation},
}
@inproceedings{robinson2002ivy,
title = {IVY: The Immersive Visual Environment at York},
author = {Robinson, Matt and Laurence, Jeff R. and Zacher, James and Hogue*, Andrew and Allison, Robert and Harris, Laurence and Jenkin, Michael and Stuerzlinger, Wolfgang},
booktitle = {International Immersive Projection Technology Symposium},
series = {IPT '02},
year = {2002},
month = {Mar},
numpages = {6},
url = {http://vr.iao.fhg.de/ipt-egve},
pdf = {papers/ivy_ipt2002.pdf},
teaser = {teasers/ivy_ipt2002.png},
abstract = {Given the limitations of head mounted display systems, there has been significant interest in the development of large-scale virtual environments such as video walls, immersive project displays, and similar devices. Although these devices do provide a wide-field visual display, very few of these devices are completely immersive as the user may view the visual world or they may be tethered to the real world via tracking systems. In this paper we present the motivation and design of IVY: The Immersive Visual environment currently under construction at Y ork University (IVY).},
keywords = {cave, immersive display system, 3D tracking},
}
@inproceedings{robinson2001growing,
title = {Growing IVY: Building the Immersive Visual Environment at York},
author = {Robinson, Matt and Laurence, Jeff R. and Zacher, James and Hogue*, Andrew and Allison, Robert and Harris, Laurence and Jenkin, Michael and Stuerzlinger, Wolfgang},
booktitle = {11th International Conference on Artificial Reality and Tele-existence},
series = {ICAT '01},
year = {2001},
month = {Dec},
pages = {85-89},
url = {http://icat.vrsj.org/ICAT2001},
pdf = {papers/ivy_icat2001.pdf},
teaser = {teasers/ivy_icat2001.png},
abstract = {When we move about within our environment, we are presented with a range of cues to our motion. Virtual reality systems attempt to simulate these various sensory cues. IVY – the Immersive Visual environment at York – is a virtual environment being constructed at York University to investigate aspects of human perception and to examine the relative importance of various visual and non-visual cues to the generation of an effective virtual environment. This paper describes the movation behind the design of IVY, and describes the design of the essential hardware and software components.},
keywords = {cave, immersive display system, 3D tracking},
}
@inproceedings{smith2001integration,
title = {Integration of Constraints into a VR Environment},
author = {Smith*, Graham and Stuerzlinger, Wolfgang},
booktitle = {Virtual Reality International Conference, Laval Virtual},
series = {VRIC '01},
isbn = {978-295157300-0},
year = {2001},
month = {Jun},
pages = {103-110},
pdf = {papers/mive_vric2001.pdf},
video = {videos/mive_creation.mp4},
teaser = {teasers/mive_vric2001.png},
abstract = {Interactive Virtual Reality applications are in general complex and non-intuitive. One fundamental problem is that manipulation of 3D objects is very difficult for non-experienced users. We describe a constraint based 3D scene construction system that exploits human intuitions to restrict object placement and interactions. In particular, we focus on the constraints themselves by describing how they are defined, and how they are used within a scene. Several different types of constraints are discussed, including virtual constraints, which decouple the constraint areas from the geometry of an object, and negative constraints, which restrict object placements within certain volumes of space. Furthermore, we discuss techniques that can be used to automatically generate constraints for most geometric objects, which makes incorporating new objects into the system much easier. Finally, we argue that the presented constraint techniques can be incorporated into existing Virtual Reality systems to make interactions easier.},
keywords = {3D manipulation, 3D positioning, constraints},
}
@inproceedings{smith2001scenedevices,
title = {{3D} Scene Manipulation with {2D} Devices and Constraints},
author = {Smith*, Graham and Salzman*, Tim and Stuerzlinger, Wolfgang},
booktitle = {Graphics Interface},
series = {GI '01},
year = {2001},
month = {Jun},
pages = {135-142},
doi = {https://doi.org/10.20380/GI2001.16},
pdf = {papers/mive_gi2001.pdf},
video = {videos/mive_resize.mp4},
teaser = {teasers/mive_gi2001.png},
abstract = {Content creation for computer graphics applications is a laborious process that requires skilled personnel. One fundamental problem is that manipulation of 3D objects with 2D user interfaces is very difficult for non-experienced users.
In this paper, we introduce a new system that uses constraints to restrict object motion in a 3D scene, making interaction much simpler and more intuitive. We compare three different 3D scene manipulation techniques based on a 2D user interface. We show that the presented techniques are significantly more efficient than commonly used solutions. To our knowledge, this is the first evaluation of 3D manipulation techniques with 2D devices and constraints.},
keywords = {3D manipulation, 3D positioning, constraints},
}
@inproceedings{smith2001sceneconstraints,
title = {{3D} Scene Manipulation with Constraints},
author = {Smith*, Graham and Salzman*, Tim and Stuerzlinger, Wolfgang},
booktitle = {Virtual and Augmented Architecture},
series = {VAA '01},
year = {2001},
month = {Jun},
pages = {35-46},
doi = {https://doi.org/10.1007/978-1-4471-0337-0_4},
pdf = {papers/mive_vaa2001.pdf},
teaser = {teasers/mive_vaa2001.png},
abstract = {Content creation for computer graphics applications is a laborious process that requires skilled personnel. One fundamental problem is that manipulation of 3D objects with 2D user interfaces is very difficult for non-experienced users.
In this paper, we introduce a new system that uses constraints to restrict object motion in a 3D scene, making interaction much simpler and more intuitive. We compare three different 3D scene manipulation techniques based on a 2D user interface. We show that the presented techniques are significantly more efficient than commonly used solutions. To our knowledge, this is the first evaluation of 3D manipulation techniques with 2D devices and constraints.},
keywords = {3D manipulation, 3D positioning, constraints},
}
@inproceedings{smith2001utility,
title = {On the Utility of Semantic Constraints},
author = {Smith*, Graham and Stuerzlinger, Wolfgang},
booktitle = {Virtual Environments},
publisher = {Eurorgraphics},
series = {EGVE '01},
year = {2001},
month = {May},
pages = {41-50},
doi = {https://doi.org/10.2312/EGVE/EGVE01/041-050},
pdf = {papers/mive_egve2001.pdf},
video = {videos/mive_pipes.mp4},
teaser = {teasers/mive_egve2001.png},
abstract = {Content creation for computer graphics applications is a laborious process that requires skilled personnel. One fundamental problem is that manipulation of 3D objects with 2D user interfaces is very difficult for non-experienced users. In this paper, we describe a system that uses semantic constraints to restrict object motion in a 3D scene, making interaction much simpler and more intuitive. We compare three different levels of semantic constraints in a 3D scene manipulation program with a 2D user interface. We show that the pr esented techniques are significantly more efficient than alternate techniques, which do not use semantics in their constraints. To our knowledge, this is the first evaluation of 3D manipulation techniques with 2D devices and constraints.},
keywords = {3D manipulation, 3D positioning, constraints},
}
@inproceedings{salzman2001unconstrained,
title = {Unconstrained vs. Constrained {3D} Scene Manipulation},
author = {Salzman*, Tim and Stachniak*, Szymon and Stuerzlinger, Wolfgang},
booktitle = {Engineering for Human-Computer Interaction},
publisher = {Springer},
series = {EHCI '01},
year = {2001},
month = {May},
volume = {LNCS 2254},
pages = {207-219},
doi = {https://doi.org/10.1007/3-540-45348-2_19},
pdf = {papers/mive_ehci2001.pdf},
video = {videos/mive_playing.mp4},
teaser = {teasers/mive_ehci2001.png},
abstract = {Content creation for computer graphics applications is a very time-consuming process that requires skilled personnel. Many people find the manipulation of 3D object with 2D input devices non-intuitive and difficult. We present a system, which restricts the motion of objects in a 3D scene with constraints. In this publication we discuss an experiment that compares two different 3D manipulation interfaces via 2D input devices. The results show clearly that the new constraint-based interface performs significantly better than previous work.},
keywords = {3D manipulation, 3D positioning, constraints},
}
@inproceedings{stuerzlinger1999imaging,
title = {Imaging all Visible Surfaces},
author = {Stuerzlinger, Wolfgang},
booktitle = {Graphics Interface},
series = {GI '99},
year = {1999},
month = {Jun},
pages = {115-122},
doi = {https://doi.org/10.20380/GI1999.16},
pdf = {papers/imgvissurf.pdf},
teaser = {teasers/imgvissurf.png},
abstract = {Today many systems exist to generate geometric models of existing scenes and objects. However, very few systems store accurate data about surface appearance such as colors and textures. One way to capture surface texture data is to record a series of images that, collectively, captures all visible surfaces of the object. Finding good viewpoints for this task is not easy.
This paper presents a new heuristic method to find a good set of viewpoints for a given geometric model. Taking images from the computed viewpoints will show every visible part of every surface at least once. The approach uses a hierarchical visibility algorithm to preprocess the scene. A good set of viewing regions is identified with simulated annealing and then good viewpoints are derived. Results and visualizations of the computed solutions are presented.},
keywords = {3D scanning, next-best view, visibility},
}
@inproceedings{goesele1999semantic,
title = {Semantic Constraints for Scene Manipulation},
author = {Goesele*, Michael and Stuerzlinger, Wolfgang},
booktitle = {SCCG: Spring Conference in Computer Graphics},
series = {SCCG '99},
commented-isbn = {978-802231357-5},
year = {1999},
month = {Apr},
pages = {140-146},
url = {http://sccg.sk/1999_min},
pdf = {papers/semconstr.pdf},
teaser = {teasers/semconstr.png},
abstract = {The creation of object models for computer graphics applications, such as interior design or the generation of animations is a labour-intensive process. Today's computer aided design (CAD) programs address the problem of creating geometric object models quite well. But almost all users find common tasks, such as quickly furnishing a room, hard to accomplish. One of the basic reasons is that manipulation of objects often does not yield the expected results.
This paper presents a new system that exploits knowledge about natural behavior of objects to provide simple and intuitive interaction techniques for object manipulation. Semantic constraints are introduced, which encapsulate such `common knowledge' about objects. Furthermore, we present a new way to automatically infer a scene hierarchy by dynamically grouping objects according to their constraint relationships.},
keywords = {3D manipulation, 3D positioning, constraints},
}
@inproceedings{aliaga1999mmr,
title = {MMR: An Interactive Massive Model Rendering System Using Geometric and Image-Based Acceleration},
author = {Aliaga*, Daniel and Cohen*, Jon and Wilson*, Andrew and Baker*, Eric and Zhang*, Hansong and Erikson*, Carl and Hoff*, Kenny and Hudson*, Tom and Stuerzlinger, Wolfgang and Bastos*, Rui and Whitton, Mary and Brooks, Fred and Manocha, Dinesh},
booktitle = {Symposium on Interactive {3D} Graphics},
publisher = {ACM},
series = {I3D '99},
year = {1999},
month = {Apr},
pages = {199-206},
doi = {https://doi.org/10.1145/300523.300554},
pdf = {papers/mmr.pdf},
teaser = {teasers/mmr.png},
abstract = {We present a system for rendering very complex 3D models at interactive rates. We select a subset of the model as preferred viewpoints and partition the space into virtual cells. Each cell contains near geometry, rendered using levels of detailand visibility culling, and far geometry, rendered as a textured depth mesh. Our system automatically balances the screen-space errors resulting from geometric simplification with those from textured-depth-mesh distortion. We describe our prefetching and data management schemes, both crucial for models significantly larger than available system memory. We have successfully used our system to accelerate walkthroughs of a 13 million triangle model of a large coal-fired power plant and of a 1.7 million triangle architectural model. We demonstrate the walkthrough of a 1.3 GB power plant model with a 140 MB cache footprint.},
keywords = {rendering, real-time},
}
@comment{c, c={leave the "_stuerzlinger" in the ID to enable umlaut-free search!}}
@inproceedings{raskar_stuerzlinger1998efficient,
title = {Efficient Image Generation for Multiprojector and Multisurface Displays},
author = {Raskar*, Ramesh and Cutts*, Matt and Welch, Greg and Stürzlinger, Wolfgang},
booktitle = {Rendering Techniques},
publisher = {Springer},
series = {EGSR '98},
year = {1998},
month = {Jun},
pages = {139-144},
doi = {https://doi.org/10.1007/978-3-7091-6453-2_13},
pdf = {papers/multisurf.pdf},
teaser = {teasers/multisurf.png},
abstract = {We describe an efficient approach to rendering a perspectively correct image on a potentially irregular display surface that may be illuminated with one or more distinct devices. The first pass of the technique generates an image of the desired graphics model using conventional rendering. The second pass projects that image as a texture onto a model of the display surface, then re-renders the textured display surface model from the viewpoint of each display device. The algorithm scales with the complexity of the display surface, and is constant with respect to the complexity of the graphics model.},
keywords = {rendering, real-time, projector},
}
@inproceedings{stuerzlinger1997interactive,
title = {Interactive Rendering of Globally Illuminated Glossy Scenes},
author = {Stürzlinger, Wolfgang and Bastos*, Rui},
booktitle = {Rendering Techniques},
publisher = {Springer},
series = {EGSR '97},
year = {1997},
month = {Jun},
pages = {93-102},
doi = {https://doi.org/10.1007/978-3-7091-6858-5_9},
pdf = {papers/fastglos.pdf},
teaser = {teasers/fastglos.png},
abstract = {Global illumination simulates all transfers of light in a scene. The results of the simulation are then used to generate photo-realistic images. Scenes with diffuse surfaces only can be displayed in real-time using the results of radiosity methods. Images of scenes with more general surfaces are created with methods based on ray tracing but do not achieve interactive frame rates.This paper presents a new algorithm for the display of globally illuminated scenes at interactive speeds. A photon tracing phase computes an approximation to the global illumination. The rendering phase splats the contribution of each photon hit onto the corresponding surface taking reflectance properties and viewing direction into account. Results demonstrate that this method allows to render images of globally illuminated scenes with glossy surfaces at interactive frame rates.},
keywords = {rendering, real-time, global illumination},
}
@inproceedings{stuerzlinger1996generic,
title = {A Generic Interface to Colors, Materials, and Textures},
author = {Stürzlinger, Wolfgang},
booktitle = {Compugraphics},
publisher = {GRASP},
series = {Compugraphics '96},
isbn = {978-972834201-2},
year = {1996},
month = {Dec},
pages = {192-200},
pdf = {papers/genmat.pdf},
teaser = {teasers/genmat.png},
abstract = {Material models predict the reflection of light by surfaces in a scene. Many models have been proposed, all with different scope of effects and different parameters. The same holds for color models and texture definitions. Most computer graphics systems implement only one model with a minimal interface. If a different model is to be integrated this interface needs to be restructured which results in many code changes in the whole system.
This work presents a new approach to a generic interface to colors and materials. By enumerating all possible operations on these graphics objects an interface for reusable and portable code is defined. A seamless integration of textured surfaces into a computer graphics system is made possible by generic texture trees which implement the generic material interface. This portable definition of textures is realized via a tree of texture nodes and texture generators.},
keywords = {rendering, ray tracing},
}
@inproceedings{stuerzlinger1996bounding,
title = {Bounding Volume Construction Using Point Clouds},
author = {Stürzlinger, Wolfgang},
booktitle = {Spring Conference on Computer Graphics},
series = {SCCG '96},
isbn = {978-802231032-1},
year = {1996},
month = {Jun},
pages = {239-246},
url = {http://sccg.sk/1996_min},
pdf = {papers/pcloud.pdf},
teaser = {teasers/pcloud.png},
abstract = {Bounding volumes are used to optimize many graphic algorithms. They permit to decide quickly if a more exact test is likely to succeed or not. The exact test is only applied if the bounding volume test succeeds, which saves time in most cases. Two of the most prominent applications are ray tracing and collision detection.
This paper presents a new method to calculate tight bounding volumes for primitives under arbitrary transformations and hierarchical scene descriptions. An optimized form of storing a convex hull is presented which allows efficient calculation of the bounding volume type used for later processing. Results are shown for the ray tracing of cyclic CSG-graphs used to render plants and other natural phenomena.},
keywords = {rendering, ray tracing, bounding volumes},
}
@comment{c, c={leave the "_stuerzlinger" in the ID to enable umlaut-free search!}}
@inproceedings{burger_stuerzlinger1995immersive,
title = {Immersive Simulation for Computer Vision},
author = {Burger, Wilhelm and Barth, Matthew J. and Stürzlinger, Wolfgang},
booktitle = {Visual Modules},
publisher = {Oldenbourg Press},
isbn = {978-348623476-3},
year = {1995},
month = {May},
pages = {160-168},
pdf = {papers/vision.pdf},
teaser = {teasers/vision.png},
abstract = {Synthetic imagery has often been considered unsuitable for demonstrating the performance of vision algorithms and systems. We argue that (despite many remaining difficulties) simulation and computer graphics are at a point today that make them extremely useful for evaluation and training, even for complex outdoor applications. This is particularly valuable for autonomous and robotics applications, where the lack of suitable training data and ground truth information is a severe bottleneck. Extensive testing in a synthetic environment should become an integral part of the systems development and evaluation process to reduce the possibility of failure in the real word. We describe ongoing efforts towards the development of an "Immersive Perception Simulator" and discuss some of the specific problems involved.},
keywords = {rendering, computer vision, ray tracing, real-time},
}
@comment{c, c={leave the "_stuerzlinger" in the ID to enable umlaut-free search!}}
@inproceedings{schaufler_stuerzlinger1995exact,
title = {Exact and Error Bounded Approximations of Local Illumination},
author = {Schaufler*, Gernot and Stürzlinger, Wolfgang},
booktitle = {Compugraphics},
publisher = {GRASP},
series = {Compugraphics '95},
isbn = {978-972834200-5},
year = {1995},
month = {Dec},
pages = {327-333},
commented-url = {http://www.gup.uni-linz.ac.at:8001/staff/schaufler/papers/local},
pdf = {papers/localillum.pdf},
teaser = {teasers/localillum.png},
abstract = {Recent approaches to realistic image synthesis split the rendering process into two passes. The first pass calculates an approximate global illumination solution, the second produces an image of high quality (from a user selected view point) using the solution obtained in the first pass by applying the local illumination model to each surface point visible through each pixel. This paper presents a new method how to compute the visible surfaces as seen from a surface point - the hemisphere projection. This method allows the exact evaluation of the local illumination model and facilitates the fast and accurate computation of form factors taking occlusion into account. Using the hemisphere projection an exact local pass solution can be obtained. In addition the hemisphere projection can be used to compute an approximation of a point's local illumination to within given error bounds in significantly less time.},
keywords = {rendering, global illumination},
}
@comment{c, c={unfortunate-dup, quasi-parallel, but independent submission by different authors}}
@inproceedings{stuerzlinger1995load,
title = {Load Balancing for a Parallel Radiosity Algorithm},
author = {Stürzlinger, Wolfgang and Schaufler*, Gernot and Volkert, Jens},
booktitle = {Symposium on Parallel Rendering},
publisher = {ACM & IEEE},
series = {PRS '95},
year = {1995},
month = {Oct},
pages = {39-45},
doi = {https://doi.org/10.1145/218327.218335},
pdf = {papers/loadbalancing.pdf},
teaser = {teasers/loadbalancing.png},
abstract = {The radiosity method models the interaction of light between diffuse surfaces, thereby accurately predicting global illumination effects. Due to the high computational effort to calculate the transfer of light between surfaces and the memory requirements for the scene description, a distributed, parallelized version of the algorithm is needed for scenes consisting of thousands of surfaces.
We present several load distribution schemes for such a parallel algorithm which includes progressive refinement and adaptive subdivision for fast solutions of high quality. The load is distributed before the calculations in a static way. During the computation the load is redistributed dynamically to make up for individual differences in processor loads. The dynamic load balancing scheme never generates more data packets than the original algorithm and avoids overloading processors through actions taken by the scheme.},
keywords = {rendering, parallel, global illumination},
}
@comment{c, c={unfortunate-dup, quasi-parallel, but independent submission by different authors}}
@inproceedings{stuerzlinger1995strategies,
title = {Load Balancing Strategies for a Radiosity Algorithm},
author = {Stürzlinger, Wolfgang and Schaufler*, Gernot and Volkert, Jens},
booktitle = {High Performance Computing Symposium},
series = {HPCS '95},
isbn = {978-292131612-5},
year = {1995},
month = {Jul},
pages = {217-228},
url = {http://hpcs.ca},
pdf = {papers/loadbalancing1.pdf},
teaser = {teasers/loadbalancing1.png},
abstract = {The radiosity method models the interaction of light between diffuse surfaces, thereby accurately predicting global illumination effects. Due to the high computational effort to calculate the transfer of light between surfaces and the memory requirements for the scene description, a distributed, parallelized version of the algorithm is needed for scenes consisting of thousands of surfaces.
We present several load distribution schemes for such a parallel algorithm which includes progressive refinement and adaptive subdivision for fast solutions of high quality. The load is distributed before the calculations in a static way. During the computation the load is redistributed dynamically to make up for individual differences in processor loads. The dynamic load balancing scheme never generates more data packets than the original algorithm and avoids overloading processors through actions taken by the scheme.},
keywords = {rendering, parallel, global illumination},
}
@inproceedings{stuerzlinger1995exact,
title = {Exact Projections onto the Hemisphere},
author = {Stürzlinger, Wolfgang},
booktitle = {Spring Conference on Computer Graphics},
series = {SCCG '95},
isbn = {978-802330344-5},
year = {1995},
month = {May},
pages = {31-38},
pdf = {papers/hemisphere.pdf},
teaser = {teasers/hemisphere.png},
abstract = {Recent approaches to realistic image synthesis have split the rendering process into two passes. The first pass calculates an approximate global illumination solution, the second generates an image of high quality from a given view point using the illumination solution obtained in the first pass.
This paper discusses a new method for projecting polygons onto the hemisphere which is the central operation performed for each pixel during the local pass. The method calculates an exact hemispherical projection of all polygons considering occlusion. The chosen representation of the projected polygons facilitates the fast and accurate computation of formfactors with regard to the projection center.
The new hemispherical projection method is used to obtain an exact local pass solution.},
keywords = {rendering, global illumination},
footnote = {Newer work such as "Visibility Silhouettes for Semi-Analytic Spherical Integration", http://dx.doi.org/10.1111/cgf.12257 and "Vectorization for Fast, Analytic, and Differentiable Visibility", https://doi.org/10.1145/3452097 uses the same idea of decomposing projections into convex polygons.},
}
@comment{c, c={leave the "_stuerzlinger" in the ID to enable umlaut-free search!}}
@inproceedings{schaufler_stuerzlinger1995generating,
title = {Generating Multiple Levels of Detail for Polygonal Geometry Models},
author = {Schaufler*, Gernot and Stürzlinger, Wolfgang},
booktitle = {Virtual Environments},
publisher = {Springer},
series = {EGVE '95},
year = {1995},
month = {Jan},
pages = {33-41},
doi = {https://doi.org/10.1007/978-3-7091-9433-1_4},
commented-url = {http://www.gup.uni-linz.ac.at:8001/staff/schaufler/papers/lods},
pdf = {papers/lod.pdf},
teaser = {teasers/lod.png},
abstract = {This paper presents a new method for solving the following problem: Given a polygonal model of some geometric object generate several more and more approximative representations of this object containing less and less polygons. The idea behind the method is that small detail in the model is represented by many spatially close points. A hierarchical clustering algorithm is used to generate a hierarchy of clusters from the vertices of the object's polygons. The coarser the approximation the more points are found to lie within one cluster of points. Each cluster is replaced by one representative point and polygons are reconstructed from these points. A static detail elision algorithm was implemented to prove the practicability of the method. This paper shows examples of approximations generated from different geometry models, pictures of scenes rendered by a detail elision algorithm and timings of the method at work.},
keywords = {rendering, real-time},
}
@inproceedings{stuerzlinger1994parallel2,
title = {Parallel Visibility Calculations for Parallel Radiosity},
author = {Stürzlinger, Wolfgang and Wild*, Christoph},
booktitle = {Parallel Processing: CONPAR — VAPP VI},
publisher = {Springer},
series = {CONPAR '94},
year = {1994},
month = {Sep},
volume = {LNCS 854},
pages = {405-413},
doi = {https://doi.org/10.1007/3-540-58430-7_36},
pdf = {papers/parvis.pdf},
teaser = {teasers/parvis.png},
abstract = {The radiosity method models the interaction of light between diffuse reflecting surfaces, thereby accurately predicting global illumination effects. Due to the high computational effort to calculate the transfer of light between surfaces and the memory requirements for the scene description, a distributed, parallelized verison of the algorithm is needed for scenes consisting of thousands of surfaces. We present a distributed, parallel progressive radiosity algorithm. Then we parallelize the visibility calculations and analyze the results.},
keywords = {rendering, parallel, visibility, global illumination},
}
@inproceedings{stuerzlinger1994adaptive,
title = {Adaptive Mesh Refinement with Discontinuities for the Radiosity Method},
author = {Stürzlinger, Wolfgang},
booktitle = {Photorealistic Rendering Techniques},
publisher = {Springer},
series = {EGSR '94},
year = {1995},
commented-year = {1994},
month = {Aug},
commented-month = {Jun},
pages = {244-253},
doi = {https://doi.org/10.1007/978-3-642-87825-1_18},
pdf = {papers/disco.pdf},
teaser = {teasers/disco.png},
abstract = {The radiosity method simulates the interaction of light between diffuse reflecting surfaces, thereby accurately predicting global illumination effects. One of the main problems of the original algorithm is the inability to represent correctly the shadows cast onto surfaces. Adaptive subdivision techniques were tried but the results are not good enough for general purposes. The conceptually different discontinuity meshing algorithm produces exact pictures of shadow boundaries but is computationally expensive. The newly presented adaptive discontinuity meshing method combines the speed of adaptive subdivision with the quality of the discontinuity meshing method.},
keywords = {rendering, global illumination},
}
@inproceedings{stuerzlinger1994optimization,
title = {Two Optimization Methods for Ray Tracing},
author = {Stürzlinger, Wolfgang and Tobler*, Robert},
booktitle = {Spring School on Computer Graphics},
series = {SCCG '94},
isbn = {978-802230801-4},
year = {1994},
month = {Jun},
pages = {104-107},
pdf = {papers/rtopt.pdf},
teaser = {teasers/rtopt.png},
abstract = {Raytracing is a method to produce photo-realistic pictures. For each pixel of an image one ray is shot to find the object, which determines the color of the pixel. Rays are also used to simulate shadows and reflections. Previously bounding volume hierarchies have been used to speed raytracing. A new method to speed the traversal of a bounding volume hierarchy is presented. Optimisation methods to find the intersection point between the ray and the scene have been introduced previously. A new algorithm based on cylinders is presented also.},
keywords = {rendering, ray tracing},
}
@inproceedings{stuerzlinger1992radiosity,
title = {Radiosity with Voronoi Diagrams},
author = {Stürzlinger, Wolfgang},
booktitle = {Third Eurographics Workshop on Rendering},
publisher = {Consolidation Express},
series = {EGSR '92},
isbn = {978-189785100-5},
year = {1992},
month = {May},
pages = {169-177},
pdf = {papers/radvor.pdf},
teaser = {teasers/radvor.png},
abstract = {Current radiosity methods rely on the calculation of geometric factors, known as form-factors which describe energy exchange between the surfaces of an environment. The most widely used method for storing the illumination across a surface is a mesh of quadrilaterals and/or triangles. For more exact computations these meshes need to be subdivided adaptively. The subdivision methods create artifacts which have visible results. A new technique for storing the surface is presented, based on Voronoi diagrams, which are well suited for the task, and can be subdivided without introducing artifacts.},
keywords = {rendering, global illumination},
}
@comment{************************other_publications************************}
@misc{bashar2026vacgazecontroller,
title = {Effects of Visual Depth on Vergence–Accommodation Conflict in Gaze- and Controller-Based Selection in Virtual Reality},
author = {Bashar*, Mohammad Raihanul and Amini*, Mohammadreza and Mutasim, Aunnoy K. and Barrera Machuca, Mayra D. and Stuerzlinger, Wolfgang and Batmaz, Anil Ufuk},
booktitle = {Extended Abstracts of the CHI Conference on Human Factors in Computing Systems},
publisher = {ACM},
series = {CHI EA '26},
howpublished = {Extended Abstract},
year = {2026},
month = {Apr},
articleno = {250},
numpages = {6},
doi = {https://doi.org/10.1145/3772363.3798344},
pdf = {papers/vacgazecontroller.pdf},
abstract = {The vergence–accommodation conflict (VAC) in stereoscopic head-mounted displays is known to affect depth perception and interaction performance. Prior studies have examined its impact on a controller, but it remains unclear how the VAC affects gaze pointing in Virtual Reality. Here, we investigate gaze- and controller-based 3D target selection under varying depth conditions. Results show that gaze is more sensitive to depth variation, exhibiting longer movement times, higher variability along the task axis, and lower throughput compared to controller-based interaction. "Variation in Diopter" Fitts' law modeling further indicates greater depth-dependent variability for gaze input. Despite these differences, perceived usability and workload were comparable. These findings suggest that the VAC affects pointing modalities differently, which should be considered when designing gaze-enabled 3D interfaces.},
keywords = {eye gaze, 3D pointing},
}
@misc{motoe2026steeringpreview,
title = {Deriving Steering Time Models for Paths with Corners of Varying Curvature Based on Preview-Based Velocity Control},
author = {Motoe*, Koyo and Kasahara*, Nobuhito and Yamanaka, Shota and Stuerzlinger, Wolfgang and Miyashita, Homei},
booktitle = {Extended Abstracts of the CHI Conference on Human Factors in Computing Systems},
publisher = {ACM},
series = {CHI EA '26},
howpublished = {Extended Abstract},
year = {2026},
month = {Apr},
articleno = {204},
numpages = {6},
doi = {https://doi.org/10.1145/3772363.3798500},
pdf = {papers/steeringpreview.pdf},
abstract = {Steering operations, such as menu navigation and drawing, constitute a fundamental GUI interaction. The conventional Steering Law estimates movement times by accumulating the local width of the path, but it suffers from limited predictive accuracy for paths with varying curvature. In contrast, humans tend to adjust their speed by anticipating the path ahead (e.g., when driving). This study proposes a new Preview-based Model, which integrates geometric properties with visual constraints further along the path. Our experimental results show that our model achieved a higher adjusted R^2 (0.983) on curve-included paths than existing models. Furthermore, a simplified formulation without parameter tuning also exhibited comparable accuracy (adjusted R^2 = 0.972), confirming its effectiveness as a practical difficulty metric.},
keywords = {steering, lasso},
}
@misc{hu2025exploringgazesteering,
title = {Exploring and Modeling Gaze-Based Steering Behavior in Virtual Reality},
author = {Hu*, Xuning and Zhang*, Yichuan and Wei*, Yushi and Li, Yue and Stuerzlinger, Wolfgang and Liang, Hai-Ning},
booktitle = {Extended Abstracts of the CHI Conference on Human Factors in Computing Systems},
publisher = {ACM},
series = {CHI EA '25},
howpublished = {Extended Abstract},
year = {2025},
month = {Apr},
articleno = {260},
pages = {1-8},
doi = {https://doi.org/10.1145/3706599.3720273},
pdf = {papers/exploringgazesteering.pdf},
abstract = {Gaze-based interaction is a common input method in virtual reality (VR). Eye movements, such as fixations and saccades, result in different behaviors compared to other input methods. Previous studies on selection tasks showed that, unlike the mouse, the human gaze is insensitive to target distance and does not fully utilize target width due to the characteristics of saccades and micro-saccades of the eyes. However, its application in steering tasks remains unexplored. Since steering tasks are widely used in VR for menu adjustments and object manipulation, this study examines whether the findings from selection tasks apply to steering tasks. We also model and compare the Steering Law based on eye movement characteristics. To do this, we use data on movement time, average speed, and re-entry count. Our analysis investigates the impact of path width and length on performance. This work proposes three candidate models that incorporate gaze characteristics, which achieve a superior fit (R² > 0.964) compared to the original Steering Law, improving the accuracy of time prediction, AIC, and BIC by 7%, 26%, and 10%, respectively. These models offer valuable insights for game and interface designers who implement gaze-based controls in VR environments.},
keywords = {eye gaze, steering},
}
@misc{bashar2025depth3dsketch,
title = {Depth3DSketch: Freehand Sketching Out of Arm's Reach in Virtual Reality},
author = {Bashar*, Mohammad Raihanul and Amini*, Mohammadreza and Stuerzlinger, Wolfgang and Sarac, Mine and Pfeuffer, Ken and Barrera Machuca, Mayra D. and Batmaz, Anil Ufuk},
booktitle = {Extended Abstracts of the CHI Conference on Human Factors in Computing Systems},
publisher = {ACM},
series = {CHI EA '25},
howpublished = {Extended Abstract},
year = {2025},
month = {Apr},
articleno = {175},
pages = {1-8},
doi = {https://doi.org/10.1145/3706599.3719717},
pdf = {papers/depth3dsketch.pdf},
abstract = {Due to the increasing availability and popularity of virtual reality (VR) systems, 3D sketching applications have also boomed. Most of these applications focus on peripersonal sketching, e.g., within arm's reach. Yet, sketching in larger scenes requires users to walk around the virtual environment while sketching or to change the sketch scale repeatedly. This paper presents Depth3DSketch, a 3D sketching technique that allows users to sketch objects up to 2.5 m away with a freehand sketching technique. Users can select the sketching depth with three interaction methods: using the joystick on a single controller, the intersection from two controllers, or the intersection from the controller ray and the user's gaze. We compared these interaction methods in a user study. Results show that users preferred the joystick to select visual depth, but there was no difference in user accuracy or sketching time between the three methods.},
keywords = {eye gaze, 3D modeling, depth selection},
}
@misc{lu2025designinguiwithaiworkshop,
title = {Designing and Developing User Interfaces with AI: Advancing Tools, Workflows, and Practices},
author = {Lu*, Yuwen and Jiang*, Yue and Knearem, Tiffany and Kliman-Silver, Clara and Lutteroth, Christof and Nichols, Jeffery and Stuerzlinger, Wolfgang},
booktitle = {Extended Abstracts of the CHI Conference on Human Factors in Computing Systems},
publisher = {ACM},
series = {CHI EA '25},
howpublished = {Extended Abstract},
year = {2025},
month = {Apr},
articleno = {774},
pages = {1-7},
doi = {https://doi.org/10.1145/3706599.3706736},
pdf = {papers/designinguiwithaiworkshop25.pdf},
abstract = {Designing and developing user-friendly interfaces has long been a cornerstone of HCI research. However, we are now at a turning point for how user interfaces can be designed and evaluated with new AI-based models and tools. The latest AI models have shown capabilities to model user behaviors, automate end-user tasks, and even generate user interfaces. We are at a pivotal moment to reflect on current UI design and development practices and discuss the opportunities, challenges, and risks brought by AI. Both incremental improvements and transformative opportunities exist for designers, developers, and the hand-off process in between. In this proposed workshop, we encourage participants to envision AI-enabled UI prototyping tools, workflows, and practices. By bringing together academic researchers and industry practitioners, we aim to identify opportunities to enhance prototyping tools and reshape UI creation workflows for the future as well as discuss potential negative consequences of these tools.},
keywords = {GUI, layout, constraints},
}
@misc{lee2025personalizednav,
title = {Towards Personalized Navigation in XR: A User-Centered Approach to Accessibility},
author = {Lee, Jong-In and Stuerzlinger, Wolfgang},
booktitle = {Workshop on Locomotion and Wayfinding in XR, VR Adjunct Proceedings},
publisher = {IEEE},
series = {LocXR '25},
year = {2025},
month = {Mar},
pages = {241-245},
doi = {https://doi.org/10.1109/VRW66409.2025.00059},
pdf = {papers/personalizednav.pdf},
abstract = {Navigation interfaces in Extended Reality (XR) have traditionally targeted universal solutions that perform well for all users. However, research has shown that users exhibit distinct preferences and performance patterns when using different navigation techniques. This position paper argues for the necessity of and strategies for designing personalized navigation interfaces that accommodate individual differences in spatial abilities, navigation strategies, and accessibility needs. Drawing from empirical findings across multiple user studies investigating locomotion and wayfinding techniques and research in spatial cognition and navigation, we demonstrate how different user groups respond uniquely to navigation interface components. Based on these insights, we propose a framework for developing adaptive navigation interfaces that cater to individual user characteristics while maintaining usability. Furthermore, we discuss opportunities for standardization in user assessment, interface adaptation, and accessibility support. This approach could lead to more inclusive and effective navigation solutions for XR environments.},
keywords = {3D navigation, accessibility, virtual reality, augmented reality},
}
@misc{zhao2024barehandposter,
title = {A Novel Bare-Handed and Widget-based Manipulation Technique for Distant Objects in Virtual Reality},
author = {Zhao*, Di Bill and Stuerzlinger, Wolfgang},
booktitle = {ISMAR Adjunct Proceedings},
series = {ISMAR '24},
howpublished = {Poster},
year = {2024},
month = {Oct},
pages = {525-528},
doi = {https://doi.org/10.1109/ISMAR-Adjunct64951.2024.00152},
commented-pdf = {papers/barehandposter.pdf},
commented-teaser = {teasers/barehandposter.png},
abstract = {Recent advancements in bare-hand tracking technology in VR headsets enable intuitive hand interaction for proximate 3D object manipulation. This paper explores two-handed bare-hand interaction for distant 3D objects, by using the non-dominant hand as an interaction surface to enable adept manipulation of a distant 3D object's position and rotation. A user study demonstrated markedly higher precision in complex manipulation tasks compared to traditional methods while maintaining comparable efficiency and accuracy for simpler tasks. Our method also received a good usability rating, illustrating its user-centric and intuitive nature. We discuss insights on error prevention, constraint integration, and consistent interaction for future VR interaction methods.},
keywords = {3D interaction, 3D manipulation, hand tracking},
}
@misc{jiang2024computationaluiworkshop24,
title = {Computational Methodologies for Understanding, Automating, and Evaluating User Interfaces},
author = {Jiang*, Yue and Lu*, Yuwen and Knearem, Tiffany and Kliman-Silver, Clara and Lutteroth, Christof and Li, Toby Jia-Jun and Nichols, Jeffery and Stuerzlinger, Wolfgang},
booktitle = {Extended Abstracts of the CHI Conference on Human Factors in Computing Systems},
publisher = {ACM},
series = {CHI EA '24},
howpublished = {Extended Abstract},
year = {2024},
month = {May},
articleno = {462},
pages = {1-7},
doi = {https://doi.org/10.1145/3613905.3636316},
pdf = {papers/computationaluiworkshop24.pdf},
abstract = {Building on the success of the first two workshops on user interfaces (UIs) at CHI 2022 and CHI 2023, this workshop aims to advance the research field by further exploring current research trends, such as applying large language models and visual language models.
Previous work has explored computational approaches to understand and adapt UIs using constraint-based optimization models and machine learning-based data-driven approaches. In addition to further delving into these established UI research areas, we aim to trigger the exploration into the application of the latest advancements in general-purpose large language and vision-language models within the UI domain.
We will encourage participants to explore novel methods for understanding, automating, and evaluating UIs.
The proposed workshop seeks to bring together academic researchers and industry practitioners interested in computational approaches for UIs to discuss the needs and opportunities for future user interface algorithms, models, and applications.},
keywords = {GUI, layout, constraints},
}
@misc{kasahara2023crossingthroughput,
title = {Throughput and Effective Parameters in Crossing},
author = {Kasahara*, Nobuhito and Oba*, Yosuke and Yamanaka, Shota and Stuerzlinger, Wolfgang and Miyashita, Homei},
booktitle = {Extended Abstracts of the CHI Conference on Human Factors in Computing Systems},
publisher = {ACM},
series = {CHI EA '23},
howpublished = {Extended Abstract},
year = {2023},
month = {Apr},
articleno = {282},
numpages = {9},
doi = {https://doi.org/10.1145/3544549.3585817},
pdf = {papers/crossingthroughput.pdf},
abstract = {In pointing, throughput TP is used as a performance metric for the input device and operator. Based on the calculation of effective parameters (width We and amplitude Ae), TP should be independent of the speed-accuracy tradeoff. To examine the validity of TP and effective parameters for crossing actions, we conducted two experiments using two established crossing tasks. Our results demonstrate that applying effective parameters to Fitts’ law model improves the fit to the data for mixed biases in both tasks. Besides, we observed that effective parameters smoothed TPs across biases. However, unlike pointing, TP was observed to be unstable across IDs in one task, while was stable across IDs in the other task. Analyzing speed profiles showed that this was likely due to the fact that one of the tasks could be completed with a ballistic movement at low IDs, whereas this was impossible for the other task.},
keywords = {throughput, crossing},
}
@misc{mutasim2023repeatedtyping,
title = {Does Repeatedly Typing the Same Phrase Provide a Good Estimate of Expert Text Entry Performance?},
author = {Mutasim*, Aunnoy K and Hudhud Mughrabi+, Moaaz and Batmaz, Anil Ufuk and Stuerzlinger, Wolfgang},
booktitle = {Extended Abstracts of the CHI Conference on Human Factors in Computing Systems},
publisher = {ACM},
series = {CHI EA '23},
howpublished = {Extended Abstract},
year = {2023},
month = {Apr},
articleno = {90},
numpages = {8},
doi = {https://doi.org/10.1145/3544549.3585647},
pdf = {papers/repeatedtyping.pdf},
abstract = {To identify if novel/unfamiliar keyboard layouts like OPTI can outperform QWERTY, lengthy training through longitudinal studies is typically required. To reduce this logistical bottleneck, a popular approach in the literature requires participants to type the same phrase repeatedly. However, it is still unknown whether this approach provides a good estimate of expert performance. To validate this method, we set up a study where participants were tasked with typing the same phrase 96 times for both OPTI and QWERTY. Results showed that this approach has the potential to estimate expert performance for novel/unfamiliar keyboards faster than the traditional approach with different phrases. Yet, we also found that accurate estimates still require training over several days and, therefore, do not eliminate the need for a longitudinal study. Our findings thus show the need for research on faster, easier, and more reliable empirical approaches to evaluate text entry systems.},
keywords = {text entry, touch typing},
}
@misc{hayatpur2023personalspaces,
title = {Designing Collaborative Parsons Problems with Personal-Spaces},
author = {Hayatpur*, Devamardeep and Helfenbaum*, Tehilla and Xia, Haijun and Stuerzlinger, Wolfgang and Gries, Paul},
booktitle = {Extended Abstracts of the CHI Conference on Human Factors in Computing Systems},
publisher = {ACM},
series = {CHI EA '23},
howpublished = {Extended Abstract},
year = {2023},
month = {Apr},
articleno = {263},
numpages = {7},
doi = {https://doi.org/10.1145/3544549.3585630},
pdf = {papers/personalspaces.pdf},
video = {videos/personalspaces.mp4},
teaser = {teasers/personalspaces.png},
abstract = {Pair programming has proven to be a successful pedagogical technique. However, its effectiveness depends on the frequency and quality of communication of the driver. In this work, we explore an alternative collaboration paradigm that tackles the imbalance in pair programming through Parsons problems: students are given fragments of code out of order and tasked with re-organizing them into the correct order. We then create an interdependence between students by assigning each learner to a different sub-problem in their space, termed Personal-spaces. Students must engage in dialog to negotiate, exchange, and use fragments from the same pool. In an exploratory study with nine pairs of undergraduate students, we find evidence pointing to affordances of different coordination conditions: Personal-spaces promoted ownership and engagement, while Turn taking (akin to pair programming) helped maintain a consistent train of thought. We provide guidelines for design of appropriate problem sets and collaboration tools to structure conversations.},
keywords = {pair programming, parsons problems, programming education},
}
@misc{jiang2023futureuiworkshop,
title = {The Future of Computational Approaches for Understanding and Adapting User Interfaces},
author = {Jiang*, Yue and Lu*, Yuwen and Lutteroth, Christof and Li, Toby Jia-Jun and Nichols, Jeffery and Stuerzlinger, Wolfgang},
booktitle = {Extended Abstracts of the CHI Conference on Human Factors in Computing Systems},
publisher = {ACM},
series = {CHI EA '23},
howpublished = {Extended Abstract},
year = {2023},
month = {Apr},
articleno = {367},
numpages = {5},
doi = {https://doi.org/10.1145/3544549.3573805},
pdf = {papers/futureuiworkshop.pdf},
abstract = {Building on the success of the first workshop on understanding, generating, and adapting user interfaces at CHI2022, this workshop will advance this research area further by looking at existing results and exploring new research directions. Computational approaches for user interfaces have been used in adapting interfaces for different devices, modalities, and user preferences. Recent work has made significant progress in understanding and adapting user interfaces with traditional constraint/rule-based optimization and machine learning-based data-driven approaches; however, these two approaches remain separate. Combining the two approaches has great potential to advance the area but remains under-explored and challenging. Other contributions, such as datasets for potential applications, novel representations of user interfaces, the analysis of human traces, and models with multi-modalities, will also open up future research options. The proposed workshop seeks to bring together researchers interested in computational approaches for user interfaces to discuss the needs and opportunities for future user interface algorithms, models, and applications.},
keywords = {GUI, layout, constraints},
}
@misc{hudhud23effectiveehct,
title = {On the Effectiveness of Virtual Eye-Hand Coordination Training with Head Mounted Displays},
author = {Hudhud Mughrabi+, Moaaz and Kaya+, Furkan and Batmaz, Anil Ufuk and Aliza*, Aliza and Stuerzlinger, Wolfgang and Borazan+, Baris and Tonyali+, Emir and Sarac, Mine},
booktitle = {Workshop on 3D Content Creation for Simulated Training in eXtended Reality, VR Adjunct Proceedings},
publisher = {IEEE},
series = {TrainingXR '23},
year = {2023},
month = {Mar},
numpages = {8},
doi = {https://doi.org/10.1109/VRW58643.2023.00014},
pdf = {papers/effectiveehct.pdf},
abstract = {Eye-hand coordination training systems are used to train participants' motor skills and visual perception. Such systems have already been tested in Virtual Reality, and the results revealed that Head Mounted Displays have the potential to improve the motor training. However, this was only investigated in an hour-long study. In the longitudinal study reported here, we analyzed the motor performance of three participants in ten sessions with three different assessment criteria, where participants were instructed to focus on speed, error rate, or complete the training freely (with no instructions). We also assessed the effective throughput performance of the participants. Our results indicate that participants focusing on speed might need less number of learning sessions. We hope that our results will help practitioners and developers design efficient Virtual Reality training systems.},
keywords = {3D pointing, gaze tracking, eye-hand coordination},
}
@misc{taylor2022litports,
title = {LitPorts: On-demand Illuminated Ports to Facilitate Inter-device Connections in Low-light Conditions},
author = {Taylor*, Tiffany E. and Stuerzlinger, Wolfgang},
booktitle = {Australian Conference on Human-Computer Interaction},
series = {OzCHI '22},
howpublished = {Late-Breaking Work},
year = {2022},
month = {Nov},
pages = {51-57},
doi = {https://doi.org/10.1145/3572921.3572932},
commented-url = {http://www.ozchi.org/2022/poster_lbw1027.html},
pdf = {papers/litports.pdf},
video = {videos/litports.mp4},
teaser = {teasers/litports.png},
abstract = {Plugging a cable or peripheral into a device is an integral aspect of daily use of computing devices for most users. Yet, in low-light or constrained-visibility conditions the simple act of finding the receptacle to connect the cable to can be challenging and lead to user frustration. To alleviate this frustration we present LitPorts, a technology that illuminates receptacles in low-light conditions when a compatible plug is in proximity, making plugging a cable in substantially easier leading to a better all-around user experience. We also present user feedback from our prototype testing demonstrating the broad appeal and applicability of LitPorts.},
keywords = {device connectivity, ports, receptacles, illumination},
}
@misc{rajabiseraji2022xvcollab,
title = {XVCollab: An Immersive Analytics Tool for Asymmetric Collaboration across the Virtuality Spectrum},
author = {Rajabi Seraji*, Mohammad and Stuerzlinger, Wolfgang},
booktitle = {Workshop on Visual Analytics in Immersive Environments, ISMAR Adjunct Proceedings},
series = {VAinIE '22},
year = {2022},
month = {Oct},
pages = {146-154},
doi = {https://doi.org/10.1109/ISMAR-Adjunct57072.2022.00035},
pdf = {papers/xvcollab.pdf},
teaser = {teasers/xvcollab.png},
abstract = {Research has shown that when a group of people collaborate in decision-making scenarios, they can be more effective than when they work alone. Studies also show that in a data analytics context, using immersive technologies could make users perform better in data understanding, pattern recognition, and finding connections. In this work, we are leveraging previous knowledge in Collaborative Immersive Analytics (CIA) and Cross-virtuality Analytics (XVA) to develop an asymmetric system that enables two groups from different places on the Virtuality-Reality spectrum to simultaneously work on analyzing data. We divide users into two groups: the non-immersive desktop group and the immersive AR group. These two groups can both author and modify visualizations in their virtuality and share it with the other group when they see fit. For this, we designed a non-interruptive interface for both groups to transform a visualization from non-immersive 2D to immersive AR and vice-versa. We also provide multiple awareness cues in the system that keep either group aware of the other and their actions. We designed these features to boost user performance and ease of use in a collaborative setting and incentivize them to rely on the other group for visualization tasks that are difficult to perform on their end of the virtuality spectrum. Our limited pilot study shows that users find the system engaging, easy to use, and helpful in their data-understanding journey within the collaborative context. Going forward, we plan to conduct more rigorous studies to verify our claims and explore other research questions on this topic.},
keywords = {immersive analytics, cross-reality, augmented reality, collaboration},
}
@misc{rajabiseraji2022hybridaxes,
title = {HybridAxes: An Immersive Analytics Tool With Interoperability Between 2D and Immersive Reality Modes},
author = {Rajabi Seraji*, Mohammad and Stuerzlinger, Wolfgang},
booktitle = {Workshop on Prototyping Cross-Reality Systems, ISMAR Adjunct Proceedings},
series = {PCRS '22},
year = {2022},
month = {Oct},
pages = {155-160},
doi = {https://doi.org/10.1109/ISMAR-Adjunct57072.2022.00036},
pdf = {papers/hybridaxes.pdf},
teaser = {teasers/hybridaxes.png},
abstract = {Throughout the visual analytics process, users create visualizations with different dimensionalities. Research shows that in this process users benefit from being able to simultaneously see 2D and 3D modes of their data visualizations. Towards supporting this potential need, we introduce HybridAxes, an immersive visual analytics tool that allows the users to conduct their analysis at either end of the reality spectrum - either in 2D on desktop monitors or 3D in an immersive AR/VR environment - while enabling them to seamlessly switch between the two modes. We believe that by using our system, users will find it easier and faster to understand and analyze multi-dimensional data. An initial pilot test indicates positive trends in terms of users' performance time and usability metrics compared to the standalone desktop or XR counterparts. Our preliminary results also suggest that users experience a lower cognitive load while task-switching between these reality modes. This reduction in mental effort causes them to perceive the system to be unobtrusive and pleasant to work with. Going forward, we plan to conduct more rigorous studies to verify our claims and to explore other research questions on this topic.},
keywords = {immersive analytics, cross-reality, augmented reality},
}
@misc{bao2022errorsspeechtranscription,
title = {The Effects of Errors in Speech Transcription: A User Study},
author = {Bao*, Tianyi Vera and Ahmed+, Afshan and Stuerzlinger, Wolfgang},
booktitle = {TEXT2030: Shaping Text Entry Research in 2030, Workshop at MobileHCI '22},
commented-publisher = {ACM},
series = {TEXT '22},
year = {2022},
month = {Oct},
numpages = {6},
pdf = {papers/respeak.pdf},
url = {http://text2030.textentry.org.uk/papers/6.pdf},
abstract = {This paper investigates how errors that occur during speech recognition affect users’ text entry performance. To study this, we implemented a speech recognition system that injects believable errors in a controlled manner. In our user study, participants were asked to transcribe a set of phrases using our speech recognition system, either with or without the insertion of errors. The results show that inducing 33% errors in a speech-based transcription task does not seem to affect users’ performance and experience in a significant manner. Yet, according to participants’ interview responses, our result might have been caused by the phrase set we used in the study. Our work thus motivates future research to develop a phrase set more suitable for speech-based transcription tasks.},
keywords = {text entry, speech recognition, errors},
}
@misc{kneifel2022autocorrectpersonality,
title = {Effects of Personality Type on Trust in Autocorrect and Preferences},
author = {Kneifel*, Johanna and Spaeth, Dominic and Stuerzlinger, Wolfgang},
booktitle = {TEXT2030: Shaping Text Entry Research in 2030, Workshop at MobileHCI '22},
commented-publisher = {ACM},
series = {TEXT '22},
year = {2022},
month = {Oct},
numpages = {6},
pdf = {papers/autocorrectpersonality.pdf},
url = {http://text2030.textentry.org.uk/papers/3.pdf},
abstract = {User acceptance of a given feature depends upon its perceived trustworthiness. Despite imperfections, trust seems to be evenly split for autocorrect. In this study, we use the Big Five personality test and text entry tasks to investigate the effect of users’ personality type on their trust in autocorrect when encountering autocorrect errors. Results indicate that individuals ranking higher in neuroticism distrust autocorrect more. Our qualitative observations showed frustrated behaviors for autocorrect errors during the text entry tasks. Half of our participants reporting distrust in autocorrect still had the feature on. The results lend insights into connections between personality type and preferred text-based communication methods, which needs to be investigated further in future work.},
keywords = {text entry, autocorrect, trust, personality, errors},
}
@misc{kneifel2022speechvstyping,
title = {Speech Recognition Versus Typing: A Mixed-Methods Evaluation},
author = {Kneifel*, Johanna and Alharbi, Ohoud and Stuerzlinger, Wolfgang},
booktitle = {TEXT2030: Shaping Text Entry Research in 2030, Workshop at MobileHCI '22},
commented-publisher = {ACM},
series = {TEXT '22},
year = {2022},
month = {Oct},
numpages = {7},
pdf = {papers/speechvstyping.pdf},
url = {http://text2030.textentry.org.uk/papers/4.pdf},
abstract = {Mobile text entry has become a main mode of communication. To make text entry as efficient as possible, helpful features, such as autocorrect and speech recognition have been developed. In our study, we confirmed previous work in that speech recognition was faster, while the error rate for typing was lower. To analyze this in more depth, we performed semi-structured interviews about participants’ text-entry preferences, specific pain points that occur, and potential suggestions for improving the editing experience.},
keywords = {text entry, speech recognition, errors},
}
@misc{lee2022multiscalenavposter,
title = {A Comparison of Zoom-In Transition Methods for Multiscale VR},
author = {Lee*, Jong-In and Asente, Paul and Stuerzlinger, Wolfgang},
booktitle = {SIGGRAPH 2022 Posters},
publisher = {ACM},
series = {SIGGRAPH '22},
howpublished = {Poster},
year = {2022},
month = {Aug},
articleno = {22},
numpages = {2},
doi = {https://doi.org/10.1145/3532719.3543237},
pdf = {papers/zoomintransition.pdf},
abstract = {When navigating within an unfamiliar virtual environment in virtual reality, transitions between pre-defined viewpoints are known to facilitate spatial awareness of a user. In the past, different viewpoint transition techniques had been investigated in VR 3D UI research, but mainly for single-scale environments. We present a comparative study of zoom-in transition techniques, where the viewpoint of a user is being smoothly transitioned from a large level of scale (LoS) to a smaller LoS in a multiscale virtual environment (MVE) with a nested structure. We identify that orbiting first before zooming in is preferred over other alternatives when transitioning to a viewpoint at a small LoS.},
keywords = {3D navigation, multiscale virtual environment, viewpoint transition},
}
@misc{kaya2022depthrole,
title = {The Role of the Depth Dimension in 3D Visualizations for Dense Data Understanding},
author = {Kaya+, Furkan and Batmaz, Anil Ufuk and Mutasim*, Aunnoy K and Stuerzlinger, Wolfgang},
booktitle = {European Conference on Visual Perception},
commented-publisher = {Sage},
series = {ECVP '22},
howpublished = {Abstract},
year = {2022},
month = {Aug},
pages = {183-184},
doi = {https://doi.org/10.1177/03010066221141167},
abstract = {Visual attributes, such as size, shape, or colour, play a crucial role in the interpretation of data visualizations and can be used to represent the data at different scales. On 2D displays, human viewers then perceive the differences between scales based on such visual attributes. While it can be challenging for human to interpret data in dense visualizations in 2D, the additional depth dimension offered by 3D could make some aspects of data more visible.
To analyze the potential impact of depth perception on dense data visualization, we developed a novel visualization method and visualized dense COVID-19 time-series data of four European countries (France, Germany, United Kingdom, and Turkey). In our novel visualization, we aimed to increase the visibility of individual data points to ease visual perception and visualized daily total cases in the depth dimension.
We conducted a user study with 20 participants where we compared a conventional 2D visualization with the proposed novel 3D visualization method for COVID-19 data.
The results show that the novel 3D visualization method facilitated understanding of the complexity of COVID-19 case data and decreased misinterpretations by 40%. Overall, 13 out of 20 participants preferred to see the COVID-19 data with the proposed method. Participants’ comments on the novel visualization method revealed that the increased visibility of individual data points decreases the cognitive load of the participants, which might explain the outcome.
The results of our work identify that the depth dimension offered by 3D visualizations can assist users in understanding dense data.},
keywords = {3D visualization, perception},
}
@misc{dunlop2022textworkshop,
title = {TEXT2030 - Shaping Text Entry Research in 2030},
author = {Dunlop, Mark and Stuerzlinger, Wolfgang and Arif, Ahmed Sabbir and Alharbi, Ohoud and Komninos, Andreas},
booktitle = {International Conference on Human-Computer Interaction with Mobile Devices and Services},
publisher = {ACM},
series = {MobileHCI '22},
howpublished = {Workshop Abstract},
year = {2022},
month = {Sep},
articleno = {3},
numpages = {4},
doi = {https://doi.org/10.1145/3528575.3551429},
pdf = {papers/text2030ws.pdf},
url = {http://text2030.textentry.org.uk},
abstract = {We propose a workshop on the theme of ubiquitous text entry research. Our aim is to address the methodological challenges arising from several decades of experience in this research community. We hope to solicit views, experiences and ideas from researchers across a range of backgrounds, with a view to formulate concrete action plans to move community practices into a strengthened position by 2030.},
keywords = {text entry, methodological challenges},
}
@misc{jiang2022computationaluiworkshop,
title = {Computational Approaches for Understanding, Generating, and Adapting User Interfaces},
author = {Jiang*, Yue and Lu*, Yuwen and Nichols, Jeffery and Stuerzlinger, Wolfgang and Yu, Chun and Lutteroth, Christof and Li, Yang and Kumar, Ranjitha and Li, Toby Jia-Jun},
booktitle = {Extended Abstracts of the CHI Conference on Human Factors in Computing Systems},
publisher = {ACM},
series = {CHI EA '22},
howpublished = {Extended Abstract},
year = {2022},
month = {May},
articleno = {74},
numpages = {6},
doi = {https://doi.org/10.1145/3491101.3504030},
pdf = {papers/computationaluiworkshop.pdf},
abstract = {Computational approaches for user interfaces have been used in adapting interfaces for different modalities, usage scenarios and device form factors, understanding screen semantics for accessibility, task-automation, information extraction, and in assisting interface design. Recent advances in machine learning (ML) have drawn considerable attention across HCI and related fields such as computer vision and natural language processing, leading to new ML-based user interface approaches. Similarly, significant progress has been made with more traditional optimization- and planning-based approaches to accommodate the need for adapting UIs for screens with different sizes, orientations and aspect ratios, and in emerging domains such as VR/AR and 3D interfaces. The proposed workshop seeks to bring together researchers interested in all kinds of computational approaches for user interfaces across different sectors as a community, including those who develop algorithms and models and those who build applications, to discuss common issues including the need for resources, opportunities for new applications, design implications for human-AI interaction in this domain, and practical challenges such as user privacy.},
keywords = {GUI, layout, constraints},
}
@misc{batmaz2021year1covid,
title = {Researchers’ and Participants’ Experiences on Distributed User Studies Conducted in the First Year of COVID-19 Pandemic},
author = {Batmaz, Anil Ufuk and Mifsud*, Domenick and Steed, Anthony and Stuerzlinger, Wolfgang and Ortega, Francisco},
booktitle = {First XR Remote Research Workshop at CHI '21},
year = {2021},
month = {May},
numpages = {3},
pdf = {papers/covidyear1ws.pdf},
url = {http://www.mat.qmul.ac.uk/xr-chi-2021},
abstract = {COVID-19 has raised significant challenges to the conduct of Virtual Reality (VR) and Augmented Reality (AR) studies. Previously, most VR and AR academic research happened in research labs at universities, where the experiments were conducted in controlled environments with specific installations and instrumentation. With the ongoing pandemic, many VR/AR researchers switched by necessity to distributed studies, where the participants participate in the studies from their own living or working spaces. This change created novel challenges for participants and experimenters. In this paper, we report some experiences with VR/AR studies conducted in the first year of COVID-19 and present recommendations for future, distributed VR/AR studies.},
keywords = {3D user interfaces, COVID-19, extended reality, virtual reality, augmented reality},
}
@misc{malekmakan2020analyzing,
title = {Analyzing the Trade-off between Selection and Navigation in VR},
author = {Malekmakan*, Morteza and Stuerzlinger, Wolfgang and Riecke, Bernhard},
booktitle = {26th Symposium on Virtual Reality Software and Technology},
publisher = {ACM},
series = {VRST '20},
howpublished = {Poster},
year = {2020},
month = {Nov},
articleno = {42},
numpages = {3},
doi = {https://doi.org/10.1145/3385956.3422123},
pdf = {papers/navseltradeoffposter.pdf},
video = {https://www.youtube.com/watch?v=8w53gKhPjWs},
abstract = {Navigation and selection are critical in very large virtual environments, such as a model of a whole city. In practice, many VR applications require both of these modalities to work together. We compare different combinations of two navigation and two selection methods in VR on selection tasks involving distant targets in a user study. The aim of our work is to discover the trade-off between navigation and selection techniques and to identify which combination leads to better interaction performance in large virtual environments. The results showed that users could complete the task faster with the fly/drive method and traveled less, compared to the teleportation method. Additionally, raycasting exhibited a better performance in terms of time and (less) distance traveled, however, it significantly increased the error rate for the selection of targets.},
keywords = {3D pointing, 3D navigation},
}
@misc{wagner2020designing,
title = {Designing Efficient Immersive Analytics Environments for Spatio-Temporal Data},
author = {Wagner Filho*, Jorge and Stuerzlinger, Wolfgang and Nedel, Luciana},
booktitle = {SIBGRAPI Workshop on Visual Analytics, Information Visualization and Scientific Visualization},
series = {WVIS '20},
howpublished = {Abstract},
year = {2020},
month = {Oct},
numpages = {1},
abstract = {The ever-growing amount of human movement data challenges us to develop new visualization techniques and to revisit existing ones with different perspectives. Traditional 2D movement visualizations focus either on the spatial or temporal aspects of the data, potentially hindering the observation of relevant features. Emerging Immersive Analytics approaches offer the opportunity to revisit a three-dimensional visualization that allows the integrated analysis of both. With the aid of stereoscopic virtual reality and 3D user interfaces, an immersive Space-Time Cube might overcome challenges that limited its adoption in the past. In this talk, we will present an overview of our ongoing research on this immersive representation, preliminary insights obtained with different navigation and interaction approaches, and our next planned steps.},
keywords = {visual analytics, immersive analytics, space-time cube, 3D visualization},
}
@misc{wagner2020visualizing,
title = {Visualizing Movement Trajectories in an Immersive Space Time-Cube},
author = {Wagner Filho*, Jorge and Stuerzlinger, Wolfgang and Nedel, Luciana},
booktitle = {VIS 2020 Workshop on Information Visualization of Geospatial Networks, Flows and Movement},
publisher = {IEEE},
series = {MoVis '20},
howpublished = {Extended Abstract},
year = {2020},
month = {Oct},
numpages = {3},
abstract = {The ever-growing amount of human movement data challenges us to develop new visualization techniques and to revisit existing ones with different perspectives. Traditional 2D movement visualizations focus either on the spatial or temporal aspects of the data, potentially hindering the observation of relevant features. Emerging Immersive Analytics approaches offer the opportunity to revisit a three-dimensional visualization that allows the integrated analysis of both. With the aid of stereoscopic virtual reality and 3D user interfaces, an immersive Space-Time Cube might overcome challenges that limited its adoption in the past. In this paper, we provide an overview of the results obtained in our ongoing research on this immersive representation. We also discuss insights obtained with different navigation and interaction approaches, and our next planned steps.},
keywords = {visual analytics, immersive analytics, space-time cube, 3D visualization},
}
@comment{c, c={currently commented out. If the corresponding journal article goes converts to misc, I might put this back in}}
@comment{steed2020covidblog,
author = {Steed, Anthony and Ortega, Francisco and Williams, Adam and Kruijff, Ernst and Stuerzlinger, Wolfgang and Batmaz, Anil Ufuk and Won, Andrea and Suma Rosenberg, Evan and Simeone, Adalberto and Hayes, Aleshia},
title = {Evaluating Immersive Experiences During COVID-19 and Beyond},
booktitle = {Interactions Blog},
month = {May},
year = {2020},
url = {http://interactions.acm.org/blog/view/enlightenment-by-lesson-},
howpublished = {Blog entry},
keywords = {3D user interfaces},
}
@misc{batmaz2020effect,
title = {Effect of Fixed and Infinite Ray Length on Distal {3D} Pointing in Virtual Reality},
author = {Batmaz, Anil Ufuk and Stuerzlinger, Wolfgang},
booktitle = {Extended Abstracts of the CHI Conference on Human Factors in Computing Systems},
publisher = {ACM},
series = {CHI EA '20},
howpublished = {Extended Abstract},
year = {2020},
month = {Apr},
numpages = {10},
doi = {https://doi.org/10.1145/3334480.3382796},
pdf = {papers/raylength.pdf},
abstract = {Ray casting is frequently used to point and select distant targets in Virtual Reality (VR) systems. In this work, we evaluate user performance in 3D pointing with two different ray casting versions: infinite ray casting, where the cursor is positioned on the surface of the first object along the ray that said ray points at, and finite ray-casting, where the cursor is attached to the ray at a fixed distance from the controller. Twelve subjects performed a Fitts' law experiment where the targets were placed 1, 2, or 3 meters away from the user. According to the results, subjects were faster and made fewer errors with the infinite ray length. Interestingly, their (effective) pointing throughput was higher when the ray length was constrained. We illustrate the advantages of both methods in immersive VR applications and provide information for practitioners and developers to choose the most appropriate ray-casting-based selection method for VR.},
keywords = {3D pointing, mid-air},
}
@misc{mutazim2020gaze,
title = {Gaze Tracking for Eye-Hand Coordination Training Systems in Virtual Reality},
author = {Mutasim*, Aunnoy K. and Stuerzlinger, Wolfgang and Batmaz, Anil Ufuk},
booktitle = {Extended Abstracts of the CHI Conference on Human Factors in Computing Systems},
publisher = {ACM},
series = {CHI EA '20},
howpublished = {Extended Abstract},
year = {2020},
month = {Apr},
numpages = {9},
doi = {https://doi.org/10.1145/3334480.3382924},
pdf = {papers/gazesportstrain.pdf},
abstract = {Eye-hand coordination training systems are used to improve user performance during fast movements in sports training. In this work, we explored gaze tracking in a Virtual Reality (VR) sports training system with a VR headset. Twelve subjects performed a pointing study with or without passive haptic feedback. Results showed that subjects spent an average of 0.55 s to visually find and another 0.25 s before their finger selected a target. We also identified that, passive haptic feedback did not increase the performance of the user. Moreover, gaze tracker accuracy significantly deteriorated when subjects looked below their eye level. Our results also point out that practitioners/trainers should focus on reducing the time spent on searching for the next target to improve their performance through VR eye-hand coordination training systems. We believe that current VR eye-hand coordination training systems are ready to be evaluated with athletes.},
keywords = {3D pointing, gaze tracking, eye-hand coordination},
}
@misc{murad2019,
title = {Effects of WER on ASR Correction Interfaces for Mobile Text Entry},
author = {Murad*, Christine and Munteanu, Cosmin and Stuerzlinger, Wolfgang},
booktitle = {International Conference on Human-Computer Interaction with Mobile Devices and Services},
publisher = {ACM},
series = {MobileHCI '19},
howpublished = {Poster},
year = {2019},
month = {Oct},
articleno = {56},
numpages = {6},
doi = {https://doi.org/10.1145/3338286.3344404},
pdf = {papers/speecheffect.pdf},
abstract = {Speech is increasingly being used as a method for text entry, especially on commercial mobile devices such as smartphones. While automatic speech recognition has seen great advances, factors like acoustic noise, differences in language or accents can affect the accuracy of speech dictation for mobile text entry. There has been some research on interfaces that enable users to intervene in the process, by correcting speech recognition errors. However, there is currently little research that investigates the effect of Automatic Speech Recognition (ASR) metrics, such as word error rate, on human performance and usability of speech recognition correction interfaces for mobile devices. This research explores how word error rates affect the usability and usefulness of touch-based speech recognition correction interfaces in the context of mobile device text entry.},
keywords = {speech recognition, text entry, errors},
}
@misc{batmaz2019effect,
title = {The Effect of Rotational Jitter on {3D} Pointing Tasks},
author = {Batmaz, Anil Ufuk and Stuerzlinger, Wolfgang},
booktitle = {Extended Abstracts of the CHI Conference on Human Factors in Computing Systems},
publisher = {ACM},
series = {CHI EA '19},
howpublished = {Extended Abstract},
year = {2019},
month = {May},
articleno = {LBW2112},
numpages = {6},
doi = {https://doi.org/10.1145/3290607.3312752},
pdf = {papers/rotjitterpointing.pdf},
abstract = {Even when in a static position, data acquired from 6 Degrees of Freedom (DoF) trackers is affected by noise, which is typically called jitter. In this study, we analyzed the effects of 3D rotational jitter on Virtual Reality (VR) controllers in a 3D Fitts' law experiment, which explored how such jitter affects user performance. Eight subjects performed a Fitts' law experiment with or without additional jitter on the cursor. Results show that while error rate significantly increased above ±0.5° jitter and subjects' effective throughput started to decrease significantly above ±1° jitter, there was no significant effect on users' movement time. Further, the Fitts's law movement time model was affected when ±2° jitter was applied to the tracker. According to these results, ±0.5° jitter on the controller does not significantly affect user performance for the tasks explored here. The results of our study can guide the design of 3D controller and tracking systems for 3D user interfaces.},
keywords = {3D pointing, jitter},
}
@misc{mutasim2019detection,
title = {Detection of Error Potentials using the Muse Headband},
author = {Mutasim*, Aunnoy K. and Stuerzlinger, Wolfgang},
booktitle = {EMBS Conference On Neural Engineering},
publisher = {IEEE},
series = {NER '19},
howpublished = {Poster},
year = {2019},
month = {Mar},
articleno = {FrPO.120},
numpages = {1},
abstract = {The detection of Error Potentials (ErrPs) has found promising applications in both neurophysiological and brain-computer interface (BCI) domains. However, the EEG acquisition devices used in such studies are mostly medical-grade and therefore expensive. Here, we propose to detect ErrPs using the cost-effective Muse headband.},
keywords = {EEG, errors},
}
@misc{nguyenvo2018actual,
title = {Do We Need Actual Walking in VR? Leaning with Actual Rotation Might Suffice for Efficient Locomotion},
author = {Nguyen-Vo*, Thinh and Pham*, Duc-Minh and Riecke, Bernhard E. and Stuerzlinger, Wolfgang and Kruijff, Ernst},
booktitle = {Spatial Cognition},
series = {SC '18},
howpublished = {Poster},
year = {2018},
month = {Sep},
abstract = {Walking has always been the most common locomotion mode for humans in the real world. For this reason, walking has also been considered as the ideal condition in a large body of VR research involving navigation. Physical walking provides body-based sensory information about both the translational and rotational components of locomotion. Though the rotational body-based information has been shown to be important for several spatial tasks, the benefit of the translational component is still unclear with mixed results from previous studies. In this study, we aim to investigate how much translational body-based sensory information is required for people to efficiently navigate the virtual world, given full rotational information. Depending on the locomotion interface used, more or less translational body-based information might be provided at different levels of accuracy. The current mixed method study investigated how different levels of translational body-based information might influence the performance of participants in a navigational search task in a HMD-based virtual environment. Participants were asked to find eight balls hidden in 16 target boxes randomly positioned in a two-meter radius circular area. To check whether there is a ball inside a target box, participants must stand right in front of the box within 0.80 meter and look at it. If there is a ball, they can collect it by touching the ball with a wand controller. The environment has been designed not to provide any additional orientation cue other than the optic flow from the fireflies. Participants could not see targets farther than two meter from them. In other words, they were not able to see all targets at a time, hence, they had to build up their spatial awareness gradually along with their locomotion. In this within-subject experiment, there were four levels of translational body-based information: none (participants used the trackpad of an HTC Vive wand controller to visually translate), upper-body leaning (participants sitting on a Swopper chair, used their upper-body leaning to control their visual translation), whole-body leaning (participants standing on a platform called NaviBoard, used their whole body leaning or stepping to navigate the virtual environment), and actual walking (participants physically walk with a wireless HMD on). Every participant performed a navigational search task once in every condition in a counter-balance order. All 24 participants finished all four trials (even with more or less fatigue). Results showed that locomotion mode had significant effects on various measures including task performance, task load, and simulator sickness. While participants performed significantly worse when they used joystick-based interface with no body-based information, compared to the other conditions, there was no significant difference between leaning-based interfaces and actual walking. More data in other measures are still in need for a more concrete conclusion. However, current results also suggested that body-based information from a leaning-based interface might suffice for a cost-effective alternative to actual walking in spatial cognition research and applications in VR.},
keywords = {3D navigation},
}
@misc{zaman2018gemniplus,
title = {{GEM-NI}+: Leveraging Difference Visualization and Multiple Displays for Supporting Multiple Complex Generative Design Alternatives},
author = {Zaman, Loutfouz and Neugebauer+, Christian and Stuerzlinger, Wolfgang and Woodbury, Robert},
booktitle = {Extended Abstracts of the CHI Conference on Human Factors in Computing Systems},
publisher = {ACM},
series = {CHI EA '18},
howpublished = {Extended Abstract},
year = {2018},
month = {Apr},
articleno = {LBW106},
numpages = {6},
doi = {https://doi.org/10.1145/3170427.3188593},
pdf = {papers/gem-ni+.pdf},
abstract = {In the conceptual design phase, designers routinely generate dozens of alternatives based on a single idea. This is especially relevant in generative design where an algorithm can generate a large number of viable design options. While solutions for creating and managing a small number of simple alternatives have been proposed, practical applications of these solutions are liMassachusetts Institute of Technologyed. As a result, we present GEM-NI+, an extension to the original GEM-NI system for creating and managing alternatives in generative design. GEM-NI+ is designed to enable editing, managing and comparing up to 24 alternatives simultaneously using a multi-monitor setup. GEM-NI+ also features a new "jamming spaces" technique for assigning individual monitors into different visualization states, which makes organization of a large workspace easier. Finally, GEM-NI+ enables comparison of complex alternatives using recursive group node difference visualization.},
keywords = {alternatives, design},
}
@misc{machuca2018stereo,
title = {Do Stereo Display Deficiencies Affect {3D} Pointing?},
author = {Barrera Machuca*, Mayra D. and Stuerzlinger, Wolfgang},
booktitle = {Extended Abstracts of the CHI Conference on Human Factors in Computing Systems},
publisher = {ACM},
series = {CHI EA '18},
howpublished = {Extended Abstract},
year = {2018},
month = {Apr},
articleno = {LBW126},
numpages = {6},
doi = {https://doi.org/10.1145/3170427.3188540},
abstract = {Previous work has documented that limitations of current stereo display systems affect depth perception. We performed an experiment to understand if such stereo display deficiencies affect 3D pointing for targets in front of a screen and close to the user, i.e., in peri-personal space. Our experiment compares isolated movements with and without a change in visual depth for virtual targets. Results indicate that selecting targets along the depth axis is slower and has less throughput than laterally positioned targets.},
keywords = {3D pointing, mid-air, stereo},
}
@misc{hashemian2018investigating,
title = {Investigating a Sparse Peripheral Display in a Head-Mounted Display for VR Locomotion},
author = {Hashemian*, Abraham and Kitson*, Alexandra and Nguyen-Vo*, Thinh and Benko, Hrvoje and Stuerzlinger, Wolfgang and Riecke, Bernhard E.},
booktitle = {Conference on Virtual Reality and {3D} User Interfaces},
publisher = {IEEE},
series = {VR '18},
howpublished = {Poster},
year = {2018},
month = {Mar},
pages = {571-572},
doi = {https://doi.org/10.1109/VR.2018.8446345},
abstract = {Head-Mounted Displays (HMDs) provide immersive experiences for virtual reality. However, their field of view (FOV) is still relatively small compared to the human eye, which adding sparse peripheral displays (SPDs) could address. We designed a new SPD, SparseLightVR2, which increases the HMD's FOV to 180° horizontally. We evaluated SparseLightVR2 with a study (N=29) by comparing three conditions: 1) no SPD, where the peripheral display (PD) was inactive; 2) extended SPD, where the PD provided visual cues consistent with and extending the HMD's main screen; and 3) counter-vection SPD, where the PD's visuals were flipped horizontally during VR travel to provide optic flow in the opposite direction of the travel. The participants experienced passive motion on a linear path and reported introspective measures such as sensation of self-motion. Results showed, compared to no SPD, both extended and counter-vection SPDs provided a more natural experience of motion, while extended SPD also enhanced vection intensity and believability of movement. Yet, visually induced motion sickness (VIMS) was not affected by display condition. To investigate the reason behind these non-significant results, we conducted a follow-up study and had users increase peripheral counter-vection visuals on the central HMD screen until they nulled out vection. Our results suggest extending HMDs through SPDs enhanced vection, naturalness, and believability of movement without enhancing VIMS, but reversed SPD motion cues might not be strong enough to reduce vection and VIMS.},
keywords = {3D navigation},
}
@misc{sun2018selecting,
title = {Selecting Invisible Objects},
author = {Sun*, Junwei and Stuerzlinger, Wolfgang},
booktitle = {Conference on Virtual Reality and {3D} User Interfaces},
publisher = {IEEE},
series = {VR '18},
howpublished = {Poster},
year = {2018},
month = {Mar},
pages = {697-698},
doi = {https://doi.org/10.1109/VR.2018.8446199},
abstract = {We augment 3D user interfaces with a new technique that enables users to select objects that are invisible from the current viewpoint. We present a layer-based method for selecting invisible objects, which works for arbitrary objects and scenes. The user study shows that with our new techniques users can easily select hidden objects.},
keywords = {3D positioning, transparency},
}
@misc{machuca2017multiplanes,
title = {Multiplanes: Assisted Freehand VR Drawing},
author = {Barrera Machuca*, Mayra D. and Asente, Paul and Lu*, Jingwan and Kim, Byungmoon and Stuerzlinger, Wolfgang},
booktitle = {Adjunct Publication of the 30th Annual ACM Symposium on User Interface Software and Technology},
publisher = {ACM},
series = {UIST '17},
howpublished = {Demonstration},
year = {2017},
month = {Oct},
pages = {1-3},
doi = {https://doi.org/10.1145/3131785.3131794},
abstract = {Multiplanes is a virtual reality (VR) drawing system that provides users with the flexibility of freehand drawing and the ability to draw perfect shapes. Through the combination of both beautified and 2D drawing, Multiplanes addresses challenges in creating 3D VR drawings. To achieve this, the system beautifies user's strokes based on the most probable, intended shapes while the user is drawing them. It also automatically generates snapping planes and beautification trigger points based on previous and current strokes and the current controller pose. Based on geometrical relationships to previous strokes, beautification trigger points act as guides inside the virtual environment. Users can hit these points to (explicitly) trigger a stroke beautification. In contrast to other systems, when using Multiplanes, users do not need to manually set or do any kind of special gesture to activate, such guides allowing the user to focus on the creative process.},
keywords = {3D sketching, 3D drawing, 3D modeling, 3D user interfaces},
}
@misc{machuca2018fluidvr,
title = {Fluid VR: Extended Object Associations for Automatic Mode Switching in Virtual Reality},
author = {Barrera Machuca*, Mayra D. and Sun*, Junwei and Pham*, Duc-Minh and Stuerzlinger, Wolfgang},
booktitle = {Conference on Virtual Reality and {3D} User Interfaces},
publisher = {IEEE},
series = {3DUI '18},
howpublished = {3DUI contest entry},
year = {2018},
month = {Mar},
pages = {846-847},
doi = {https://doi.org/10.1109/VR.2018.8446437},
abstract = {Constrained interaction and navigation methods for virtual reality reduce the complexity of the interaction. Yet, with previously presented solutions, users need to learn new interaction tools or remember different actions for changing between different interaction methods. In this paper, we propose Fluid VR, a new 3D user interface for interactive virtual environments that lets users seamlessly transition between navigation and selection. Based on the selected object's properties, Fluid VR applies specific constraints to the interaction or navigation associated with the object. This way users have a better control of their actions, without having to change tools or activate different modes of interaction.},
keywords = {3D manipulation},
}
@misc{nguyenvo2017investigating,
title = {Investigating the Effect of Simulated Reference Frames on Spatial Orientation in Virtual Reality},
author = {Nguyen-Vo*, Thinh and Riecke, Bernhard E. and Stuerzlinger, Wolfgang},
booktitle = {Second Workshop on Models and Representations in Spatial Cognition},
series = {SC '17},
howpublished = {Poster},
year = {2017},
month = {Apr},
url = {https://osf.io/bs5ug},
abstract = {Despite recent advances in virtual reality, locomotion in a virtual environment is still restricted because of spatial disorientation. Previous research has shown the benefits of reference frames in maintaining spatial orientation. Here, we propose using a visually simulated reference frame in virtual reality to provide users with a better sense of direction in landmark-free virtual environments. Visually overlaid rectangular frames simulate different variations of frames of reference. We investigated how two different types of visually simulated reference frames might benefit in a navigational search task through a mixed-method study. Results showed that the presence of a reference frame significantly affects participants' performance in a navigational search task. Though the egocentric frame of reference (simulated CAVE) that translates with the observer did not significantly help, an allocentric frame of reference (a simulated stationary room) significantly improved user performance both in navigational search time and overall travel distance. Our study suggests that adding a variation of the reference frame to virtual reality applications might be a cost-effective solution to enable more effective locomotion in virtual reality.},
keywords = {cave, 3D navigation},
}
@misc{nguyenvo2017moving,
title = {Moving in a Box: Improving Spatial Orientation in Virtual Reality using Simulated Reference Frames},
author = {Nguyen-Vo*, Thinh and Riecke, Bernhard E. and Stuerzlinger, Wolfgang},
booktitle = {Symposium on {3D} User Interfaces},
publisher = {IEEE},
series = {3DUI '17},
howpublished = {Poster},
year = {2017},
month = {Mar},
pages = {846-847},
doi = {https://doi.org/10.1109/3DUI.2017.7893344},
abstract = {Despite recent advances in virtual reality, locomotion in a virtual environment is still restricted because of spatial disorientation. Previous research has shown the benefits of reference frames in maintaining spatial orientation. Here, we propose using a visually simulated reference frame in virtual reality to provide users with a better sense of direction in landmark-free virtual environments. Visually overlaid rectangular frames simulate different variations of frames of reference. We investigated how two different types of visually simulated reference frames might benefit in a navigational search task through a mixed-method study. Results showed that the presence of a reference frame significantly affects participants' performance in a navigational search task. Though the egocentric frame of reference (simulated CAVE) that translates with the observer did not significantly help, an allocentric frame of reference (a simulated stationary room) significantly improved user performance both in navigational search time and overall travel distance. Our study suggests that adding a variation of the reference frame to virtual reality applications might be a cost-effective solution to enable more effective locomotion in virtual reality.},
keywords = {cave, 3D navigation},
}
@misc{teather2016tutorial,
title = {SIVARG: Spatial Interaction in Virtual/Augmented Reality and Games},
author = {Teather, Robert and Stuerzlinger, Wolfgang},
booktitle = {International Conference on Interactive Surfaces and Spaces},
publisher = {ACM},
series = {ISS '16},
howpublished = {Tutorial},
year = {2016},
month = {Nov},
pages = {525–528},
doi = {https://doi.org/10.1145/2992154.2996364},
abstract = {We propose a workshop soliciting submissions on the topics of spatial and 3D interaction in highly fidelity graphical interactive systems, especially video games and virtual reality systems. Topics will cover all aspects of interaction in these systems, including input-related issues such as efficient control mappings, spatial input device features (e.g., low latency, input noise, etc.), as well as output-related issues such as display hardware features (e.g., stereoscopic rendering, head-tracking), and information visualization (e.g., game HUDs for status information). We propose to include both position papers, as well as papers including at least preliminary studies on issues in these areas.},
keywords = {3D user interface},
}
@misc{sun2016shiftsliding,
title = {{Shift-Sliding} and {Depth-Pop} for {3D} Positioning},
author = {Sun*, Junwei and Stuerzlinger, Wolfgang and Shuralyov*, Dmitri},
booktitle = {Symposium on Spatial User Interaction},
publisher = {ACM},
series = {SUI '16},
howpublished = {Demonstration},
year = {2016},
month = {Oct},
pages = {165-165},
doi = {https://doi.org/10.1145/2983310.2991067},
abstract = {We introduce two new 3D positioning methods. The techniques enable rapid, yet easy-to-use positioning of objects in 3D scenes. With SHIFT-Sliding, the user can override the default assumption of contact and non-collision for sliding, and lift objects into the air or make them collide with other objects. DEPTH-POP maps mouse wheel actions to all object positions along the mouse ray, where the object meets the default assumptions for sliding. We will demonstrate the two methods in a desktop environment with the mouse and keyboard as interaction devices. Both methods use frame buffer techniques for efficiency.},
keywords = {3D manipulation, 3D positioning},
}
@misc{machuca2016history,
title = {{3D} Camera Pose History Visualization},
author = {Barrera Machuca*, Mayra D. and Stuerzlinger, Wolfgang},
booktitle = {Symposium on Spatial User Interaction},
publisher = {ACM},
series = {SUI '16},
howpublished = {Poster},
year = {2016},
month = {Oct},
pages = {183-183},
doi = {https://doi.org/10.1145/2983310.2989185},
abstract = {We present a 3D camera pose history visualization that can assist users of CAD software's, virtual worlds and scientific visualizations to revisit their navigation history. The contribution of this system is to enable users to move more efficiently through the virtual environment so they can focus on their main activity.},
keywords = {3D navigation},
}
@misc{sun2016floatsliding,
title = {{FLOAT}-Sliding for {3D} Positioning},
author = {Sun*, Junwei and Stuerzlinger, Wolfgang},
booktitle = {Graphics Interface},
series = {GI '16},
howpublished = {Poster},
year = {2016},
month = {Jun},
numpages = {2},
abstract = {We describe a new technique for 3D positioning, based on the typical sliding technique. We assume that by default object stay in contact with the scene's front surfaces and do not interpenetrate other objects. To ensure precision, we permit manipulation only for at least partially visible objects. With our new FLOAT-Sliding method the user can override the default contact assumption and lift objects into the air or make them collide with other objects. For efficiency, FLOAT-Sliding uses frame buffer techniques.},
keywords = {3D manipulation, 3D positioning},
}
@misc{seim2016passive,
title = {Can Passive Haptic Learning Help Users Become More Skilled Keyboard Typists?},
author = {Seim*, Caitlyn and Doering+, Nick and Stuerzlinger, Wolfgang and Starner, Thad},
booktitle = {CHI 2016 Workshop on Inviscid Text Entry and Beyond},
series = {Textentry '16},
howpublished = {Extended Abstract},
year = {2016},
month = {May},
numpages = {4},
url = {http://www.textentry.org/chi2016},
abstract = {Passive Haptic Learning (PHL) can be used to teach text entry systems such as Braille and Morse code where each finger controls at most one key. However, most keyboards have a spatial layout where each finger controls multiple keys, and each key is labeled. Can PHL help users improve their skill at these text entry systems? We are investigating these questions by using passive stimuli to help users learn a randomized layout of the number pad. This research is aimed at laying the groundwork for creating a system to help individuals improve their QWERTY keyboard typing.},
keywords = {haptics, learning},
}
@misc{bjerre2015transition,
title = {Transition Times for Manipulation Tasks in Hybrid Interfaces},
author = {Bjerre+, Per and Christensen+, Allan and Pedersen+, Simon André and Pedersen+, Andreas Køllund and Stuerzlinger, Wolfgang},
booktitle = {3rd Symposium on Spatial User Interaction},
publisher = {ACM},
series = {SUI '15},
howpublished = {Poster},
year = {2015},
month = {Aug},
pages = {137-137},
doi = {https://doi.org/10.1145/2788940.2794358},
pdf = {papers/transitionsposter.pdf},
abstract = {Previous work has shown that uninstrumented in-air interaction is slower and not as precise for pointing tasks compared to the mouse. Yet, there are interaction scenarios where it is preferable or advantageous to use in-air input. Therefore, we examine a three-device hybrid setup involving the mouse, keyboard, and a Leap Motion. We performed a user study to quantify the costs associated with transitioning between these interaction devices and also for performing simple 2D manipulation tasks using the mouse and Leap Motion. We discovered that transitioning to and from the Leap Motion takes on average 0.87 seconds longer than transitions between the mouse and keyboard.},
keywords = {3D manipulation, 3D positioning},
}
@misc{arif2015smart,
title = {A Smart-Restorable Backspace to Facilitate Text Entry Error Correction},
author = {Arif, Ahmed Sabbir and Stuerzlinger, Wolfgang and Mazalek, Ali and Kim, Sunjun and Lee, Geehyuk},
booktitle = {CHI 2015 Workshop on Text Entry on the Edge},
series = {Textentry '15},
howpublished = {Extended Abstract},
year = {2015},
month = {Apr},
numpages = {4},
url = {http://www.textentry.org/chi2015},
abstract = {Selection is one of the most basic interaction methods in 3D user interfaces. Previous work has shown that visual feedback improves such actions. However, haptic feedback can increase the realism or also help for occluded targets. Here we investigate if 3D virtual hand selection benefits from electrical muscle stimulation (EMS) and vibration. In our experiment we used a 3D version of a Fitts' task to compare visual, EMS, vibration, and no feedback. The results demonstrate that both EMS and vibration are reasonable alternatives to visual feedback. We also found good user acceptance for both technologies.},
keywords = {text entry, errors, backspace},
}
@misc{pfeiffer2015ems,
title = {{3D} Virtual Hand Selection with {EMS} and Vibration Feedback},
author = {Pfeiffer*, Max and Stuerzlinger, Wolfgang},
booktitle = {33rd Annual Conference Extended Abstracts on Human Factors in Computing Systems},
publisher = {ACM},
series = {CHI EA '15},
howpublished = {Extended Abstract},
year = {2015},
month = {Apr},
pages = {1361-1366},
doi = {https://doi.org/10.1145/2702613.2732763},
abstract = {Selection is one of the most basic interaction methods in 3D user interfaces. Previous work has shown that visual feedback improves such actions. However, haptic feedback can increase the realism or also help for occluded targets. Here we investigate if 3D virtual hand selection benefits from electrical muscle stimulation (EMS) and vibration. In our experiment we used a 3D version of a Fitts' task to compare visual, EMS, vibration, and no feedback. The results demonstrate that both EMS and vibration are reasonable alternatives to visual feedback. We also found good user acceptance for both technologies.},
keywords = {3D positioning, haptics},
}
@misc{stuerzlinger2015tivs,
title = {TIVS: Temporary Immersive Virtual Environment at Simon Fraser University: A Non-permanent CAVE},
author = {Stuerzlinger, Wolfgang and Pavlovych*, Andriy and Nywton+, Dayson},
booktitle = {1st Workshop on Everyday Virtual Reality},
publisher = {IEEE},
series = {WEVR '15},
year = {2015},
month = {Mar},
pages = {23-28},
doi = {https://doi.org/10.1109/WEVR.2015.7151691},
pdf = {papers/tivs.pdf},
video = {videos/TIVS.mp4},
abstract = {CAVE systems are an immersive environment that surrounds one or more viewers with multiple large screens, which portray a virtual 3D environment. CAVEs use generally between three and six sides and are thus effectively permanent installations, due to the required floor and room space. We describe TIVS, the Temporary Immersive Virtual environment at Simon Fraser University, a system whose defining feature is that it does not consume any permanent floor space. Yet, TIVS can be in operation in less than a minute. Viewers sit on swivel chairs in the center of an 8' × 6' space, where TIVS's frame is mounted onto the ceiling. The bottom of said frame is 7' above the ground, making it easy for people to walk below it. The screens mounted on the frame are rolled down whenever the system is being used and are otherwise stowed away. That frees the floor space for other uses when the system is not in use. The projection geometry ensures that people sitting in the center area of the space do not cast shadows onto the screens. A tracking system attached to the frame provides for head tracking. Overall, the non-permanent nature of the system makes it surprisingly easy to integrate Virtual Reality into everyday environments.},
keywords = {immersive display system, large display system, cave},
}
@misc{codddowney2014leaplook,
title = {{LeapLook}: A Free-hand Gestural Travel Technique using the Leap Motion Finger Tracker},
author = {Codd-Downey*, Robert and Stuerzlinger, Wolfgang},
booktitle = {2nd Symposium on Spatial User Interaction},
publisher = {ACM},
series = {SUI '14},
howpublished = {Poster},
year = {2014},
month = {Oct},
pages = {153-153},
doi = {https://doi.org/10.1145/2659766.2661218},
abstract = {Contactless motion sensing devices enable a new form of input that does not encumber the user with wearable tracking equipment. We present a novel travel technique using the Leap Motion finger tracker which adopts a 2DOF steering metaphor used in traditional mouse and keyboard navigation in many 3D computer games.},
keywords = {3D navigation},
}
@misc{teather2014depthcues,
title = {Depth Cues and Mouse-Based {3D} Target Selection},
author = {Teather*, Robert J. and Stuerzlinger, Wolfgang},
booktitle = {2nd Symposium on Spatial User Interaction},
publisher = {ACM},
series = {SUI '14},
howpublished = {Poster},
year = {2014},
month = {Oct},
pages = {156-156},
doi = {https://doi.org/10.1145/2659766.2661221},
abstract = {We investigated mouse-based 3D selection using one-eyed cursors, evaluating stereo and head-tracking. Stereo cursors significantly reduced performance for targets at different depths, but the one-eyed cursor yielded some discomfort.},
keywords = {3D pointing},
}
@misc{pavlovych2014tivx,
title = {TIVX: Temporary Immersive Virtual Environment: A Non-Permanent CAVE},
author = {Pavlovych*, Andriy and Nywton+, Dayson and Stuerzlinger, Wolfgang},
booktitle = {GRAND NCE Conference},
series = {GRAND '14},
howpublished = {Demonstration},
year = {2014},
month = {May},
url = {http://grand-nce.ca/archives/annual-conference/grand-2014/program/poster-demo-experiences.html},
keywords = {immersive display system, cave},
}
@misc{arif2014howdo,
title = {How Do Users Interact with an Error Prone In-air Gesture Recognizer?},
author = {Arif*, Ahmed Sabbir and Stuerzlinger, Wolfgang and de Mendonça Filho+, Euclides José and Gordynski, Alec},
booktitle = {CHI Workshop on Gesture-based Interaction Design: Communication and Cognition},
howpublished = {Extended Abstract},
year = {2014},
month = {May},
numpages = {4},
pdf = {papers/errorpronegestures.pdf},
abstract = {We present results of two pilot studies that investigated human error behaviours with an error prone in-air gesture recognizer. During the studies, users performed a small set of simple in-air gestures. In the first study, these gestures were abstract. The second study associated concrete tasks with each gesture. Interestingly, the error patterns observed in the two studies were substantially different.},
keywords = {gestures, errors, mid-air},
}
@misc{arif2014error,
title = {Error Behaviours in an Unreliable In-Air Gesture Recognizer},
author = {Arif*, Ahmed Sabbir and Stuerzlinger, Wolfgang and de Mendonça Filho+, Euclides José and Gordynski, Alec},
booktitle = {Extended Abstracts on Human Factors in Computing Systems},
publisher = {ACM},
series = {CHI EA '14},
howpublished = {Extended Abstract},
year = {2014},
month = {May},
pages = {1603–1608},
doi = {https://doi.org/10.1145/2559206.2581188},
pdf = {papers/unreliableairgestures.pdf},
abstract = {This article presents results of two pilot studies that investigated error behaviours with an unreliable in-air gesture recognizer. During the studies, users performed a small set of simple in-air gestures. In the first study, these gestures were abstract. The second study associated concrete tasks with each gesture. The error patterns in the two studies were substantially different.},
keywords = {mid-air, gestures, errors},
}
@misc{teather2014fishtank,
title = {Fishtank Fitts: A Desktop VR Testbed for Evaluating {3D} Pointing Techniques},
author = {Teather*, Robert J. and Stuerzlinger, Wolfgang and Pavlovych*, Andriy},
booktitle = {Extended Abstracts on Human Factors in Computing Systems},
publisher = {ACM},
series = {CHI EA '14},
howpublished = {Extended Abstract},
year = {2014},
month = {May},
pages = {519–522},
doi = {https://doi.org/10.1145/2559206.2574810},
pdf = {papers/fishtankfittsdemo.pdf},
video = {videos/3DfishTankFitts.mp4},
abstract = {We present a desktop or "fish tank" virtual reality system for evaluating 3D selection techniques. Motivated by the successful application of Fitts' law to 2D pointing evaluation, the system provides a testbed for consistent evaluation of 3D point-selection techniques. The primary design consideration of the system was to enable direct and fair comparison between 2D and 3D pointing techniques. To this end, the system presents a 3D version of the ISO 9241-9 pointing task. Targets can be displayed stereoscopically, with head-coupled viewing, and at varying depths. The system also supports various input devices, including the mouse as well as 3D trackers in direct touch and remote pointing modes.},
keywords = {3D pointing},
}
@misc{stuerzlinger2013considerations,
title = {Considerations for Targets in {3D} Pointing Experiments},
author = {Stuerzlinger, Wolfgang},
booktitle = {Interactive Surfaces for Interaction with Stereoscopic {3D}},
series = {ISIS3D '13},
howpublished = {Extended Abstract},
year = {2013},
month = {Oct},
numpages = {4},
pdf = {papers/3Dtargets.pdf},
abstract = {We identify various tradeoffs around 3D pointing experiments based on Fitts' law and the ISO9241-9 methodology. The advantages and disadvantages of each approach are analyzed and compared against each other. We present some recommendations for 3D pointing experiments and avenues of future work.},
keywords = {3D pointing},
}
@misc{laldin2013up,
title = {Up- and Downwards Motions in {3D} Pointing},
author = {Laldin*, Sidrah and Teather*, Robert J. and Stuerzlinger, Wolfgang},
booktitle = {Symposium on Spatial User Interaction},
series = {SUI '13},
howpublished = {Poster},
year = {2013},
month = {Jul},
pages = {89-89},
doi = {https://doi.org/10.1145/2491367.2491393},
pdf = {papers/updownpointing.pdf},
abstract = {We present an experiment that examines 3D pointing in fish tank VR using the ISO 9241-9 standard. The experiment used three pointing techniques: mouse, ray, and touch using a stylus. It evaluated user pointing performance with stereoscopically displayed varying height targets above an upward-facing display. Results show differences in upwards and downwards motions for the 3D touch technique.},
keywords = {3D pointing},
}
@misc{bajer2013effects,
title = {Effects of Stereo and Head Tracking in {3D} Selection Tasks},
author = {Bajer*, Bartosz and Teather*, Robert J. and Stuerzlinger, Wolfgang},
booktitle = {Symposium on Spatial User Interaction},
series = {SUI '13},
howpublished = {Poster},
year = {2013},
month = {Jul},
pages = {77-77},
doi = {https://doi.org/10.1145/2491367.2491392},
pdf = {papers/headstereopointing.pdf},
abstract = {We report a 3D selection study comparing stereo and head-tracking with both mouse and pen pointing. Results indicate stereo was primarily beneficial to the pen mode, but slightly hindered mouse speed. Head tracking had fewer noticeable effects.},
keywords = {3D pointing},
}
@misc{stuerzlinger2013keynote,
title = {Modern Spatial and {3D} User Interfaces},
author = {Stuerzlinger, Wolfgang},
booktitle = {International Conference on Information Society},
publisher = {IEEE},
series = {iSociety '13},
howpublished = {Keynote abstract},
year = {2013},
month = {Jun},
pages = {9-9},
url = {https://ieeexplore.ieee.org/abstract/document/6636326},
abstract = {Three-dimensional (3D) user interfaces are popular in movies. Many current technologies enable people to interact with 3D content, also in computer games. I review the main ideas behind 3D user interfaces and present innovative solutions based on the capabilities and limitations of both humans and technologies.},
keywords = {3D user interfaces},
}
@comment{c, c={this has to be before the GRAND poster entry, as it attracted more citations than the poster}}
@misc{scheurich2013onehandedmating,
title = {A One-Handed Multi-Touch Mating Method for {3D} Rotations},
author = {Scheurich*, Doug and Stuerzlinger, Wolfgang},
booktitle = {Extended Abstracts on Human Factors in Computing Systems},
publisher = {ACM},
series = {CHI EA '13},
howpublished = {Extended Abstract},
year = {2013},
month = {Apr},
pages = {1623-1628},
doi = {https://doi.org/10.1145/2468356.2468646},
pdf = {papers/touchrotwip.pdf},
abstract = {Rotating 3D objects is a difficult task. We present a new rotation technique based on collision-free "mating" to expedite 3D rotations. It is specifically designed for one-handed interaction on tablets or touchscreens. A user study found that our new technique decreased the time to rotate objects in 3D by more than 60% in situations where objects align. We found similar results when users translated and rotated objects in a 3D scene. Also, angle errors were 35% less with mating. In essence, our new rotation technique improves both the speed and accuracy of common 3D rotation tasks.},
keywords = {3D manipulation},
}
@misc{scheurich2013mating,
title = {A One-Handed Multi-Touch Mating Method for {3D} Rotations},
author = {Scheurich*, Doug and Stuerzlinger, Wolfgang},
booktitle = {GRAND NCE Conference},
series = {GRAND '13},
howpublished = {Poster},
year = {2013},
month = {May},
abstract = {Rotating 3D objects is a difficult task. We present a new rotation technique based on collision-free "mating" to expedite 3D rotations. It is specifically designed for one-handed interaction on tablets or touchscreens. A user study found that our new technique decreased the time to rotate objects in 3D by more than 60% in situations where objects align. We found similar results when users translated and rotated objects in a 3D scene. Also, angle errors were 35% less with mating. In essence, our new rotation technique improves both the speed and accuracy of common 3D rotation tasks.},
keywords = {3D manipulation},
}
@misc{teather2013pointingtargets,
title = {Pointing at {3D} Target Projections with One-Eyed and Stereo Cursors},
author = {Teather*, Robert J. and Stuerzlinger, Wolfgang},
booktitle = {GRAND NCE Conference},
series = {GRAND '13},
howpublished = {Poster},
year = {2013},
month = {May},
abstract = {We present a study of cursors for selecting 2D-projected 3D targets. We compared a stereo- and mono-rendered (one-eyed) cursor using two mouse-based and two remote pointing techniques in a 3D Fitts' law pointing experiment. The first experiment used targets at fixed depths. Results indicate that one-eyed cursors only improve screen-plane pointing techniques, and that constant target depth does not influence pointing throughput. A second experiment included pointing between targets at varying depths and used only "screen-plane" pointing techniques. Our results suggest that in the absence of stereo cue conflicts, screen-space projections of Fitts' law parameters (target size and distance) yield constant throughput despite target depth differences and produce better models of performance.},
keywords = {3D pointing},
}
@misc{zaman2013alternatives,
title = {Alternatives in Generative Design},
author = {Zaman*, Loutfouz and Stuerzlinger, Wolfgang},
booktitle = {GRAND NCE Conference},
series = {GRAND '13},
howpublished = {Poster},
year = {2013},
month = {May},
keywords = {alternatives, design},
}
@misc{teather2012system,
title = {A System for Evaluating {3D} Pointing Techniques},
author = {Teather*, Robert J. and Stuerzlinger, Wolfgang},
booktitle = {18th Symposium on Virtual Reality Software and Technology},
publisher = {ACM},
series = {VRST '12},
howpublished = {Demonstration},
year = {2012},
month = {Dec},
pages = {209-210},
doi = {https://doi.org/10.1145/2407336.2407383},
pdf = {papers/3dpointingsystem.pdf},
abstract = {This demo presents a desktop VR system for evaluating human performance in 3D pointing tasks. The system supports different input devices (e.g., mouse and 6DOF remote pointer), pointing techniques (e.g., screen-plane and depth cursors), and cursor visualization styles (e.g., one-eyed and stereo 3D cursors). The objective is to comprehensively compare all combinations of these conditions. We especially focus in on fair and direct comparisons between 2D and 3D pointing tasks. Finally, our system includes a new pointing technique that outperforms standard ray pointing.},
keywords = {3D pointing},
}
@comment{c, c={leave the "_stuerzlinger" in the ID to enable umlaut-free search!}}
@misc{zeidler_stuerzlinger2012chinz,
title = {The Auckland Layout Editor: An Improved GUI Layout Specification Process},
author = {Zeidler*, Clemens and Lutteroth, Christof and Weber, Gerald and Stürzlinger, Wolfgang},
booktitle = {13th International Conference of the NZ Chapter of the ACM's Special Interest Group on Human-Computer Interaction},
series = {CHINZ '12},
howpublished = {Demonstration},
year = {2012},
month = {Jul},
pages = {103-103},
doi = {https://doi.org/10.1145/2379256.2379287},
abstract = {Constraint-based layout managers are more powerful than the common grid, grid-bag, and group layout managers. However, they are also more complex and come with potential problems such as over-constrained specifications and overlap in a GUI. Current GUI builders have little support for layout constraints, and it is not clear how such constraints can be made easily accessible to GUI designers. We will demonstrate a GUI builder - the Auckland Layout Editor (ALE) - that addresses these challenges, by allowing GUI designers to specify constraint-based layouts using only simple mouse operations. ALE guarantees that all operations lead to sound specifications, making sure that the layout is solvable and non-overlapping. To achieve the latter, we propose an algorithm that automatically generates the missing constraints that are necessary to keep a layout non-overlapping. Today's applications need to run on multiple devices with different screen sizes. For this a layout must have a good appearance at different sizes. To aid the designer in creating a layout with good resizing behavior, we propose a novel automatic layout preview, which displays the layout at its minimal and at an enlarged size chosen to visualize layout problems directly.},
keywords = {GUI, layout},
}
@misc{das2012comparing,
title = {Comparing Cognitive Effort in Spatial Learning of Text Entry Keyboards and {ShapeWriters}},
author = {Das*, Arindam and Stuerzlinger, Wolfgang},
booktitle = {Working Conference on Advanced Visual Interfaces},
series = {AVI '12},
howpublished = {Extended Abstract},
year = {2012},
month = {May},
pages = {649-652},
doi = {https://doi.org/10.1145/2254556.2254676},
pdf = {papers/effort2learn.pdf},
abstract = {Stable structured layouts of buttons are a primary means of control for input in current graphical user interfaces. Such layouts are ubiquitous - from tiny iPhone screens to large kiosk screens in the malls - they are found everywhere. Yet, there has been relatively little theoretical account that compares the impact of cognitive effort on learning such stable layouts. In this paper, we demonstrate that prior empirical results on cognitive effort in learning stable layouts are theoretically predictable through the memory activation model of a cognitive architecture, ACT-R. We go beyond previous work by quantitatively comparing the level of cognitive effort in terms of a newly introduced parameter in the declarative memory model of ACT-R. We theoretically compare the cognitive effort of two different layouts of graphical buttons with respect to their label representativeness in the domains of traditional keyboard and ShapeWriter.},
keywords = {text entry, learning},
}
@misc{teather2012cursors,
title = {Cursors for {3D} Pointing},
author = {Teather*, Robert J. and Stuerzlinger, Wolfgang},
booktitle = {The 3rd Dimension of CHI ({3DCHI}): Touching and Designing {3D} User Interfaces},
series = {3DCHI '12},
howpublished = {Extended Abstract},
year = {2012},
month = {May},
numpages = {8},
pdf = {papers/cursor3Dpointingshort.pdf},
abstract = {We present a study of cursors for 3D pointing/selection interfaces. We compared a stereo- and mono-rendered (one-eyed) cursor used with two mouse-based and two remote pointing techniques. This comparison was performed in a 3D Fitts' law pointing experiment with varying target depths. Results indicate that the one-eyed cursor is beneficial only for some pointing techniques. While the mouse-based techniques performed best, our new ray-screen technique outperforms traditional ray pointing. This is likely because it is less affected by target depth.},
keywords = {3D pointing},
}
@misc{arif2012how,
title = {How Do Users Adapt to a Faulty System?},
author = {Arif*, Ahmed Sabbir and Stuerzlinger, Wolfgang},
booktitle = {CHI Workshop on Designing and Evaluating Text Entry Methods},
series = {Textentry '12},
howpublished = {Extended Abstract},
year = {2012},
month = {May},
numpages = {4},
url = {http://www.textentry.org/chi2012},
pdf = {papers/faultysystemshort.pdf},
abstract = {We investigate how users gradually adapt to a faulty system and how the system error rate influences this adaptation process. We present results of a study that verifies that a user's learning rate to compensate for system errors depends on how erroneous that system is – they learn to avoid erroneous actions faster if errors occur more frequently.},
keywords = {gestures, errors},
}
@misc{stuerzlinger2012stereo,
title = {Stereo vs. One-Eyed Cursors for {3D} Pointing and Implications for Touch Interfaces},
author = {Stuerzlinger, Wolfgang and Teather*, Robert J.},
booktitle = {Touching the 3rd Dimension},
series = {Dagstuhl Seminar 12151},
howpublished = {Abstract},
year = {2012},
month = {Apr},
doi = {https://doi.org/10.4230/DagRep.2.4.1},
abstract = {We compare remote pointing and mouse pointing techniques using both a stereo- and mono-rendered cursor in a Fitts' law pointing experiment with varying target depths in a 3D scene. Results indicate that mouse-based techniques perform best and that the one-eyed cursor is beneficial only for some pointing techniques. We discuss the implications for 3D touch interfaces.},
keywords = {3D pointing},
}
@misc{zaman2012evaluation,
title = {Evaluation of a {3D} {UI} with Different Input Technologies},
author = {Zaman*, Loutfouz and Shuralyov*, Dmitri and Teather*, Robert J. and Stuerzlinger, Wolfgang},
booktitle = {Symposium on {3D} User Interfaces},
publisher = {IEEE},
series = {3DUI '12},
howpublished = {Extended Abstract},
year = {2012},
month = {Mar},
pages = {173-174},
doi = {https://doi.org/10.1109/3DUI.2012.6184217},
pdf = {papers/evalwiimouse.pdf},
abstract = {We present two studies of navigation and object manipulation in a virtual supermarket. The first study compared a mouse and keyboard setup to a game hardware setup using a Wii Remote, Wii Balance Board and a dancemat. The second study used more game-like software interfaces for both conditions and used only the Wii Remote and Nunchuk in the game-hardware setup. The mouse setup was around 36% faster in both studies. In the first study the mouse setup was 98% more accurate; no difference in accuracy was found in the second study.},
keywords = {3D pointing},
}
@misc{teather2012investigating,
title = {Investigating One-Eyed and Stereo Cursors for {3D} Pointing Tasks},
author = {Teather*, Robert J. and Stuerzlinger, Wolfgang},
booktitle = {Symposium on {3D} User Interfaces},
publisher = {IEEE},
series = {3DUI '12},
howpublished = {Extended Abstract},
year = {2012},
month = {Mar},
pages = {167-168},
doi = {https://doi.org/10.1109/3DUI.2012.6184214},
pdf = {papers/cursor3Dpointingposter.pdf},
abstract = {We compared two remote pointing techniques to two mouse pointing techniques using both with a stereo- and mono-rendered cursor. These were compared using a Fitts' law pointing experiment with varying target depths in a 3D scene. Results indicate that mouse-based techniques performed best and that the one-eyed cursor is beneficial only for some pointing techniques.},
keywords = {3D pointing},
}
@misc{stuerzlinger2011onoffline,
title = {On- and Off-Line User Interfaces for Collaborative Cloud Services},
author = {Stuerzlinger, Wolfgang},
booktitle = {CHI Workshop Designing Interaction for the Cloud},
howpublished = {Extended Abstract},
year = {2011},
month = {May},
numpages = {6},
pdf = {papers/cloudui.pdf},
abstract = {We describe a vision for user interfaces of cloud-based systems that permit seamless collaboration and provide also on- and off-line access to data. All individual components of this vision are currently available in various systems, but the sum of the components will satisfy user needs much more comprehensively.},
keywords = {GUI, cloud computing, off-line, collaboration},
}
@misc{pavlovych2011pursuit,
title = {Pursuit Tracking in Presence of Latency, Jitter, and Dropouts},
author = {Pavlovych*, Andriy and Stuerzlinger, Wolfgang},
booktitle = {GRAND NCE Conference},
series = {GRAND '11},
howpublished = {Poster},
year = {2011},
month = {May},
keywords = {latency, jitter, tracking},
}
@misc{zaman2011darls,
title = {DARLS: Differencing and Merging Diagrams Using Dual View Animation, Re-Layout, Layers and a Storyboard},
author = {Zaman*, Loutfouz and Kalra+, Ashish and Stuerzlinger, Wolfgang},
booktitle = {Extended Abstracts on Human Factors in Computing Systems},
publisher = {ACM},
series = {CHI EA '11},
howpublished = {Extended Abstract},
year = {2011},
month = {May},
pages = {1657-1662},
doi = {https://doi.org/10.1145/1979742.1979824},
pdf = {papers/darls.pdf},
abstract = {We present a new system for visualizing and merging differences in diagrams. It uses animation, dual views, a storyboard, relative re-layout, and layering to visualize differences. The system is also capable of differencing UML class diagrams. An evaluation produced positive results for animation and dual views with difference layer.},
keywords = {difference visualization},
}
@misc{shuralyov2011puzzle,
title = {A {3D} Desktop Puzzle Assembly System},
author = {Shuralyov*, Dmitri and Stuerzlinger, Wolfgang},
booktitle = {Symposium on {3D} User Interfaces},
publisher = {IEEE},
series = {3DUI '11},
howpublished = {3DUI contest entry},
year = {2011},
month = {Mar},
pages = {139-140},
doi = {https://doi.org/10.1109/3DUI.2011.5759244},
pdf = {papers/3dpuzzle.pdf},
video = {videos/Puzzle2x.mp4},
teaser = {teasers/3dpuzzle.png},
abstract = {We describe a desktop virtual reality system targeted at 3D puzzle assembly. The results of the evaluation show that all novices could successfully complete the puzzle within an average of about six minutes, while experts took about two minutes.},
keywords = {3D manipulation},
}
@misc{pavlovych2010effects,
title = {Effects of Latency Jitter and Dropouts in Pointing Tasks},
author = {Pavlovych*, Andriy and Stuerzlinger, Wolfgang},
booktitle = {GRAND NCE Conference},
series = {GRAND '10},
howpublished = {Poster},
year = {2010},
month = {Jul},
abstract = {Interactive computing systems frequently use pointing as an input modality, while also supporting other forms of input. We focus on pointing and investigate the effects of variations, i.e. jitter, in the input device latency, as well as dropouts, on 2D pointing speed and accuracy. First, we characterize the latency, latency jitter, and dropouts in several common input technologies. Then we present an experiment, where we systematically explore combinations of dropouts, latency, and latency jitter on a desktop mouse. The results indicate that latency and dropouts have a strong effect on human performance; moderate amounts of jitter in latency do not change performance in a significant way in most cases.},
keywords = {latency, jitter, pointing},
}
@misc{zaman2010interface,
title = {A New Interface for Cloning Objects in Drawing Systems},
author = {Zaman*, Loutfouz and Stuerzlinger, Wolfgang},
booktitle = {GRAND NCE Conference},
series = {GRAND '10},
howpublished = {Poster},
year = {2010},
month = {Jun},
abstract = {Cloning objects is a common operation in graphical user interfaces. A good example is calendar systems, where users commonly create and modify recurring events, i.e. repeated clones of a single event. Inspired by the calendar paradigm, we introduce a new cloning technique for 2D drawing programs. This technique allows users to clone objects by first selecting them and then dragging them to create clones along the dragged path. A novel approach for the generation of clones of clones is also presented. Moreover, the technique enables editing of the generated sequences of clones similar to the editing of calendar events.
We compared our new clone creation technique with generic duplication via copy-and-paste, smart duplication, and a dialog driven technique on a desktop system. The results show that the new cloning method is always faster than dialogs and faster than smart duplication for most conditions. We also compared our clone editing method against rectangular selection. The results show that our method is better in general. In situations where rectangle selection is effective, our method is still competitive. Participants preferred the new techniques overall, too.},
keywords = {cloning, drawing, copy, paste},
}
@misc{pavlovych2010effectslatency,
title = {Effects of Latency Jitter and Dropouts in Pointing Tasks},
author = {Pavlovych*, Andriy and Stuerzlinger, Wolfgang},
booktitle = {Graphics Interface},
series = {GI '10},
howpublished = {Poster},
year = {2010},
month = {May},
pages = {30-32},
abstract = {Interactive computing systems frequently use pointing as an input modality, while also supporting other forms of input. We focus on pointing and investigate the effects of variations, i.e. jitter, in the input device latency, as well as dropouts, on 2D pointing speed and accuracy. First, we characterize the latency, latency jitter, and dropouts in several common input technologies. Then we present an experiment, where we systematically explore combinations of dropouts, latency, and latency jitter on a desktop mouse. The results indicate that latency and dropouts have a strong effect on human performance; moderate amounts of jitter in latency do not change performance in a significant way in most cases.},
keywords = {latency, jitter, pointing},
}
@misc{arif2010mobile,
title = {Two New Mobile Touchscreen Text Entry Techniques},
author = {Arif*, Ahmed Sabbir and Lopez+, Mauricio H. and Stuerzlinger, Wolfgang},
booktitle = {Graphics Interface},
series = {GI '10},
howpublished = {Poster},
year = {2010},
month = {May},
abstract = {This article introduces two new mobile touchscreen text entry techniques. One is timeout-based and the other is pressure-based. Also, this work examines the effects of tactile feedback on text entry techniques. Empirical comparisons between conventional and proposed techniques show that the new techniques, as well as tactile feedback, enhance overall text entry performance.},
keywords = {text entry, mobile device},
}
@misc{agarwal2010widgetlens,
title = {{WidgetLens}: Interaction Through The Looking Glass},
author = {Agarwal*, Bhavna and Stuerzlinger, Wolfgang},
booktitle = {Graphics Interface},
series = {GI '10},
howpublished = {Poster},
year = {2010},
month = {May},
abstract = {Computer and mobile device screens are increasing in size and resolution. This increase in resolution causes problems with graphical user interfaces designed for lower resolution screens, as all information gets smaller and smaller. We present two novel techniques to make graphical user interfaces on high-resolutions screens more accessible and usable. We introduce a new in-place, localized zooming technique that works on a per widget basis. We also present a novel widget magnification technique that implements special modalities for common user interface elements, which affords widget-dependent magnification.},
keywords = {GUI, widget, magnification, layout},
}
@misc{dehmeshki2010design,
title = {Design of a Perceptual-Based Object Group Selection Technique},
author = {Dehmeshki*, Hoda and Stuerzlinger, Wolfgang},
booktitle = {Graphics Interface},
series = {GI '10},
howpublished = {Poster},
year = {2010},
month = {May},
abstract = {Selecting groups of objects is a common task in graphical user interfaces. Current selection techniques such as lasso and rectangle selection become time-consuming and error-prone in dense configurations or when the area covered by targets is large or hard to reach. This paper presents a new pen-based interaction technique that allows users to efficiently select perceptual groups formed by the Gestalt principle of good continuity.},
keywords = {group selection},
}
@misc{teather2010target,
title = {Target Pointing in {3D} User Interfaces},
author = {Teather*, Robert J. and Stuerzlinger, Wolfgang},
booktitle = {Graphics Interface},
series = {GI '10},
howpublished = {Poster},
year = {2010},
month = {May},
abstract = {We present two studies using ISO 9241-9 to evaluate target pointing in two different 3D user interfaces. The first study was conducted in a CAVE, and used the standard tapping task to evaluate passive haptic feedback. Passive feedback increased throughput significantly, but not speed or accuracy alone. The second experiment used a fish tank VR system, and compared tapping targets presented at varying heights stereoscopically displayed at or above the surface of a horizontal screen. The results indicate that targets presented closer to the physical display surface are generally easier to hit than those displayed farther away from the screen.},
keywords = {3D pointing},
}
@misc{ashtiani2009xnt,
title = {XNT: Object Transformation on Multi-Touch Surfaces},
author = {Ashtiani*, Behrooz and Stuerzlinger, Wolfgang},
booktitle = {Conference on Interactive Tabletops and Surfaces 2009},
series = {ITS '09},
howpublished = {Poster},
year = {2009},
month = {Nov},
numpages = {2},
pdf = {papers/xntposter.pdf},
video = {videos/XNT3D.mp4},
abstract = {We present and evaluate a new object transformation technique for multi-touch surfaces. Specifying complete object transformations for a two-dimensional space requires a minimum of four degrees of freedom (DOF): two for position, one for rotation, and another for scaling. Many existing techniques for object transformation are designed to function with traditional input devices such as mice, single-touch surfaces, or stylus pens. The challenge is then to compensate for the lack of DOF's. XNT is a new three-finger object transformation technique, designed specifically for multi-touch surface devices. It provides a natural interface for object manipulation and was experimentally found to be faster than previous techniques.},
keywords = {manipulation, touch},
}
@misc{teather2009coupling,
title = {Evaluating Visual/Motor Coupling in Fish Tank VR},
author = {Teather*, Robert J. and Allison, Robert and Stuerzlinger, Wolfgang},
booktitle = {CVR Conference},
series = {CVR '09},
howpublished = {Poster},
year = {2009},
month = {Jun},
keywords = {3D pointing},
}
@misc{teather2009effectslatency,
title = {Effects of Latency and Spatial Jitter on {2D} and {3D} Pointing},
author = {Teather*, Robert J. and Pavlovych*, Andriy and Stuerzlinger, Wolfgang},
booktitle = {Virtual Reality Conference},
publisher = {IEEE},
series = {VR '09},
howpublished = {Poster},
year = {2009},
month = {Mar},
pages = {229-230},
doi = {https://doi.org/10.1109/VR.2009.4811029},
abstract = {We investigate the effects of input device latency and spatial jitter on 2D pointing tasks and a 3D movement. First, we characterize jitter and latency in a 3D tracking device and an optical mouse used for baseline comparison. We present an experiment based on ISO 9241-9, which measures performance of pointing devices. We added latency and jitter to the mouse and compared it to a 3D tracker. Results indicate that latency has a stronger effect on performance than small spatial jitter. A second experiment found that erratic jitter "spikes" can affect 3D movement performance.},
keywords = {3D pointing, latency, jitter},
}
@misc{stuerzlinger2008nextgen,
title = {Next Generation {3D} Interaction Techniques},
author = {Stuerzlinger, Wolfgang and Wingrave*, Chad},
booktitle = {Virtual Realities},
series = {Dagstuhl Seminar 08231},
howpublished = {Abstract},
year = {2008},
month = {Jun},
url = {http://drops.dagstuhl.de/opus/volltexte/2008/1634},
abstract = {We present a set of guidelines for 3D positioning techniques. These guidelines are intended for developers of object interaction schemes in 3D games, modeling packages, computer-aided design systems, and virtual environments. The guidelines promote intuitive object movement techniques in these types of environments.},
keywords = {3D manipulation, 3D pointing},
}
@misc{das2008recall,
title = {Recall Accuracy Drive Visual Strategy Adaptation in Multi-tap Text Entry},
author = {Das*, Arindam and Stuerzlinger, Wolfgang},
booktitle = {Graphics Interface},
series = {GI '08},
howpublished = {Poster},
year = {2008},
month = {May},
abstract = {We present a cognitive model that demonstrates how the recall accuracy of letter positions on a cell phone keypad effects the transition from novice to expert behavior. In particular, we target multi-tap text entry methods and focus on the process of visually searching versus selecting (i.e. deciding) a letter on the keypad. The model predicts the probability of letter location recall by novice users through a cognitive architecture named ACT-R, and models learning as the user gradually gains cognitive expertise with practice, session after session. We then employ this probability within a model of strategy adaptation that encapsulates the effect of different visual exploration strategies: novice users search for a letter while the behavior of advanced users is modeled by the Hick-Hyman Law. The final output of our cognitive model is the entry speed for the key press for a letter in a letter-group containing multiple distinct letters.},
keywords = {text entry, learning},
}
@misc{dadgari2008analysis,
title = {Analysis of Merging Text Versions Using Differentiation Methods},
author = {Dadgari*, Darius and Stuerzlinger, Wolfgang},
booktitle = {Graphics Interface},
series = {GI '08},
howpublished = {Poster},
year = {2008},
month = {May},
abstract = {Comparing and selecting text from multiple versions of a document is a necessary task for a task-leader or group to undertake when users collaborate in writing a document, or when a single user generates different versions of a document to experiment with. Comparing multiple documents in an intuitive, efficient way allows a user to select the most appropriate portions of work from multiple sources quickly, to create a final document. Examination and even publications of text versioning methods are not documented in the literature, even though implementations of text versioning are abundant in a multitude of commercial and non-commercial software.
We propose new methods for text versioning, based on methods which have been previously shown to be effective for differentiating between objects. We plan to perform an extensive evaluation with these proposed methods to currently implemented ones in order to examine which methods are preferred by users and which show benefit in terms of error rate and completion time.},
keywords = {difference visualization},
}
@misc{dehmeshki2008using,
title = {Using Perceptual Grouping for Object Group Selection},
author = {Dehmeshki*, Hoda and Stuerzlinger, Wolfgang},
booktitle = {Graphics Interface},
series = {GI '08},
howpublished = {Poster},
year = {2008},
month = {May},
abstract = {Selection is a critical task in document processing systems, and is required for many manipulation operations such as deleting, moving, reusing, or re-formatting. Documents have usually a hierarchical structure. For example, books are naturally represented as a sequence of chapters, sections, subsections and so on until described completely in terms of basic component such as paragraphs, tabular material, and images. This structure is usually visualized using different formats (e.g. font sizes) or different views (e.g. outline views in Microsoft Words). Despite this inherent structure, to the best of our knowledge no selection technique systematically utilizes this structure in pen-based system. The multi-click approach is a standard selection method offered by many systems. Single, double, and triple clicking then selects the corresponding unit (e.g. word, line, and paragraph, respectively). This approach cannot select larger units than a paragraph and is not well suited for pen-based systems, as multi-clicking is unreliable for pens. Current selection techniques such as Rectangle, Lasso require users to explicitly define a selection scope by a pen movement. This can be time-consuming and error-prone when the target is large (e.g. multiple paragraphs) or spans more than a page. In the later case, the user has to select and scroll simultaneously. Moreover, these techniques are one directional, i.e. from the start point to the end point. The following common scenario describes potential problems: during a paragraph selection, the user decides to select the previous paragraph as well. She has two choices: either cancelling, relocating the mouse (pen), and re-starting a new selection, or selecting both paragraphs individually while using a phrasing technique (such as a Shift-key).
We propose a novel pen-based technique issues for selecting document components. Performing a pigtail gesture in a margin selects the nearby unit. Continuous pigtails extend selection to previous, next or both units according to the last pigtail orientation. Our technique automatically scrolls (or zooms out) when selecting off-screen targets.},
keywords = {group selection},
}
@misc{pavlovych2008effect,
title = {Effect of Group Size and Interaction Devices in Co-Located Computer Supported Collaborative Work},
author = {Pavlovych*, Andriy and Stuerzlinger, Wolfgang},
booktitle = {Graphics Interface},
series = {GI '08},
howpublished = {Poster},
year = {2008},
month = {May},
keywords = {large display interaction, collaboration, groupware, CSCW},
}
@misc{teather2008exaggerating,
title = {Exaggerating Head-Coupled Camera Motions in Fish Tank VR},
author = {Teather*, Robert J. and Stuerzlinger, Wolfgang},
booktitle = {Graphics Interface},
series = {GI '08},
howpublished = {Poster},
year = {2008},
month = {May},
abstract = {Virtually exaggerating head motions when using head-coupled viewing may be beneficial. This is especially important in environments where the user is sitting, such as in desktop or "fish-tank" VR. We present an evaluation of exaggerated head-coupled perspective for 3D assembly tasks. Three levels of exaggeration were compared to determine if exaggeration was beneficial compared to a direct mapping. The results suggest that there is some user preference towards modest levels of exaggeration. However, no significant differences by the experimental conditions were detected, other than a learning effect.},
keywords = {3D navigation},
}
@misc{dehmeshki2008intelligent,
title = {Intelligent Object Group Selection},
author = {Dehmeshki*, Hoda and Stuerzlinger, Wolfgang},
booktitle = {Extended Abstracts on Human Factors in Computing Systems},
publisher = {ACM},
series = {CHI EA '08},
howpublished = {Extended Abstract},
year = {2008},
month = {Apr},
pages = {3111-3116},
doi = {https://doi.org/10.1145/1358628.1358816},
pdf = {papers/gestaltclick.pdf},
abstract = {Current object group selection techniques such as lasso or rectangle selection can be time consuming and error prone. This is apparent when selecting distant objects on a large display or objects arranged along curvilinear paths in a dense area. We present a novel group selection technique based on the Gestalt principles of proximity and good continuity. The results of a user study show that our new technique outperforms lasso and rectangle selection for object groups in(curvi)linear arrangements or clusters, i.e. groups with an implicit structure.},
keywords = {group selection},
}
@misc{teather2008assessingeffects,
title = {Assessing the Effects of Orientation and Device on {3D} Positioning},
author = {Teather*, Robert J. and Stuerzlinger, Wolfgang},
booktitle = {Virtual Reality Conference},
publisher = {IEEE},
series = {VR '08},
howpublished = {Poster},
year = {2008},
month = {Mar},
pages = {293-294},
doi = {https://doi.org/10.1109/VR.2008.4480807},
pdf = {papers/move3dposter2.pdf},
abstract = {We present two studies to assess which physical factors of various input devices influence 3D object movement tasks. In particular, we evaluate the factors that seem to make the mouse a good input device for constrained 3D movement tasks. The first study examines the effect of a supporting surface across orientation of input device movement and display orientation. Surprisingly, no significant results were found for the effect of physical support for constrained movement techniques. Also, no significant difference was found between matching the orientation of the display to that of the input device movement. A second study found that the mouse outperformed all tracker conditions for speed, but the presence or absence of support had no significant effect when tracker movement is constrained to 2D.},
keywords = {3D pointing},
}
@misc{dehmeshki2007gestalt,
title = {Gestalt-Based Object Group Selection},
author = {Dehmeshki*, Hoda and Stuerzlinger, Wolfgang},
booktitle = {CVR Conference},
series = {CVR '08},
howpublished = {Poster},
year = {2007},
month = {Jun},
pdf = {papers/gestaltmodel2.pdf},
abstract = {Object grouping in graphical systems is supported by Lasso or Rectangle techniques which could require extra steps. This work presents a new approach to group objects by Gestalt principles of proximity, curve-linearity, similarity and common region. We demonstrate the results with several examples.},
keywords = {group selection},
}
@misc{teather2007challenge,
title = {The Challenge of {3D} Interaction: Guidelines for Intuitive {3D} Manipulation Techniques},
author = {Teather*, Robert J. and Stuerzlinger, Wolfgang},
booktitle = {Interacting with Immersive Worlds},
howpublished = {Abstract},
year = {2007},
month = {Jun},
numpages = {1},
abstract = {The rapid evolution of computer technology has made it possible to generate increasingly realistic virtual environments. However, despite the promise and hype of virtual reality that began in the 1980s, actual usage of the technology (outside of research settings) is limited primarily to derivatives of truly immersive VR, such as 3D video games. We suggest that one of the greatest barriers to widespread adoption of VR technology is the lack of intuitive interaction techniques available in virtual environments. True 3D manipulation is a 6 degree of freedom (6DOF) task, i.e. three independent axes of movement and three independent axes of rotation. Although we regularly perform such manipulations in reality with our hands, in a virtual environment, we are faced with a difficult choice of input devices: either use a familiar, but less immersive device, such as a mouse or use any of a number of unfamiliar and problematic 3D input devices. However, a mouse is a 2DOF device, providing movement in two directions only. Without support from software techniques that map 2D mouse movements into 6DOF operations, such a device is inadequate for manipulating objects in 3D.
One alternative is to use a higher DOF input device (e.g. 3D wands or gloves) which can provide high-precision 3D positioning and orientation. This is an attractive solution for immersive environments where the user is standing. Another possibility is to use a mouse with indirect manipulation techniques, such as 3D widgets, or control keys to toggle the axis of movement/rotation. However, both of these approaches present unique sets of problems. Full 6DOF input devices tend to be difficult to use and indirect manipulation techniques force the user to mentally decompose each manipulation into a series of steps. Both solutions require the user to think about the interface, rather than the task at hand.
A third approach is to use constraints, such as gravity, collision avoidance, etc. Building on this idea, we propose instead the use of "intelligent" 2DOF interaction techniques that automatically and intuitively map 2D mouse motions to 3D movement. One such technique, used for moving objects in the Sesame 3D conceptual modeling tool has been shown in experiments to be significantly faster and more accurate than both 6DOF input and 3D widget interaction techniques. This technique is an example of 3D direct manipulation, allowing users to "click and drag" objects in the scene. Dragging the object causes it to slide along the foremost visible surface behind it in the scene. This sliding motion behaves in a very predictable, natural way, and suggests that a mouse with suitably intelligent software support may be an ideal "3D" input device for certain VR and 3D applications, notably 3D modeling.
Based on this, and related research, we have composed a list of several guidelines for researchers developing immersive applications requiring 3D interaction. These guidelines are intended to aid designers in choosing methods of interaction, but are broad enough to encompass any type of 3D application requiring the accurate interactive positioning of objects in the environment. Current research suggests that techniques based on these guidelines may not only benefit mouse-based input, but input from higher-DOF devices as well.},
keywords = {3D manipulation},
}
@misc{teather2007evaluation,
title = {An Evaluation of {3D} Positioning Techniques for Scene Assembly},
author = {Teather*, Robert J. and Stuerzlinger, Wolfgang},
booktitle = {Symposium on {3D} User Interfaces},
publisher = {IEEE},
series = {3DUI '07},
howpublished = {Poster},
year = {2007},
month = {Mar},
numpages = {1},
pdf = {papers/move3dposter.pdf},
keywords = {3D manipulation, 3D positioning},
}
@misc{stuerzlinger2006covidsystem,
title = {{CoViD}: A System for Collaborative Virtual {3D} Design},
author = {Stuerzlinger, Wolfgang},
booktitle = {CSCW Workshop: Design and CSCW},
howpublished = {Extended Abstract},
year = {2006},
month = {Nov},
numpages = {2},
pdf = {papers/covid_short.pdf},
abstract = {Many important decisions in the design process are made fairly early on, after designers have presented initial concepts. In many domains, these concepts are now realized as 3D digital models and, in meetings, the stakeholders evaluate these potential solutions. Frequently, the participants in such a meeting want to interactively modify the proposed designs to explore the design space better. Today's systems and tools do not support this, as computer systems typically support only a single user and computer-aided design tools require significant training. This paper presents a new system to facilitate a collaborative 3D design process. The new system, CoViD, consists of two main parts. The first part is an easy-to-use conceptual 3D design tool that can be used productively even by naive users. The second part is a novel infrastructure for collaborative work, which offers an interactive table and several large interactive displays in a semi-immersive setup. The synthesis of both parts forms a new platform for collaborative virtual 3D design.},
keywords = {collaboration, design, 3D modeling},
}
@misc{dehmeshki2006perceptual,
title = {A Perceptual-based Group Selection Technique for Graph Drawing Systems},
author = {Dehmeshki*, Hoda and Stuerzlinger, Wolfgang},
booktitle = {Grace Hopper Conference},
howpublished = {Poster},
year = {2006},
month = {Oct},
keywords = {group selection},
}
@misc{stuerzlinger2006reality,
title = {Reality-Based Object Movement Techniques for {3D}},
author = {Stuerzlinger, Wolfgang and Dadgari*, Darius and Oh*, Ji-Young},
booktitle = {CHI Workshop: What is the Next Generation of Human-Computer Interaction?},
howpublished = {Extended Abstract},
year = {2006},
month = {Apr},
articleno = {D.3},
numpages = {4},
pdf = {papers/realitymove3d.pdf},
abstract = {Scene layout and part assembly are basic tasks in 3D object manipulation. While movement methods based on 3D or 6D input devices exist, the most efficient 3D movement techniques are based on utilizing only two degrees of freedom. This poses the problem of mapping the motion of the 2D input device to efficient and predictable object motion in 3D. We present a new method to map 2D input to 3D motion in this paper. The object position follows the mouse cursor position closely, while the object always stays in contact with other surfaces in the scene. In contrast to existing techniques, the movement surface and the relative object position is determined using the whole area of overlap of the moving object with the static scene. The resulting object movement is visually smooth and predictable, while avoiding undesirable collisions. The technique also utilizes the fact that people easily recognize the depth-order of shapes based on occlusions. The proposed technique runs in real-time. Finally, the evaluation of the new technique with a user study shows that it compares very favorably to conventional techniques.},
keywords = {3D manipulation, 3D positioning},
}
@misc{kulikov2006targeted,
title = {Targeted Steering Motions},
author = {Kulikov*, Sergey and Stuerzlinger, Wolfgang},
booktitle = {Extended Abstracts on Human Factors in Computing Systems},
publisher = {ACM},
series = {CHI EA '06},
howpublished = {Extended Abstract},
year = {2006},
month = {Apr},
pages = {983-988},
doi = {https://doi.org/10.1145/1125451.1125640},
pdf = {papers/targetsteer.pdf},
abstract = {In this paper we investigate targeted steering motions. Fitts' law is a very successful model to explain human targeting behavior, while the Steering law has been used to model steering motions. Dennerlein et al. combined these two models to explain targeted steering motions, but this combination introduces additional parameters. In this paper, we present a new, simpler, model that can be used to predict targeted steering motions.},
keywords = {steering},
}
@misc{dehmeshki2006using,
title = {Using Perceptual Grouping for Object Group Selection},
author = {Dehmeshki*, Hoda and Stuerzlinger, Wolfgang},
booktitle = {Extended Abstracts on Human Factors in Computing Systems},
publisher = {ACM},
series = {CHI EA '05},
howpublished = {Extended Abstract},
year = {2006},
month = {Apr},
pages = {700-705},
doi = {https://doi.org/10.1145/1125451.1125593},
pdf = {papers/gestaltmodel.pdf},
abstract = {Modern graphical user interfaces support the direct manipulation of objects and efficient selection of objects is an integral part of this user interface paradigm. For the selection of object groups most systems implement only rectangle selection and shift-clicking. This paper presents an approach to group selection that is based on the way human perception naturally groups objects, also known as the "Gestalt" phenomenon. Based on known results from perception research, we present a new approach to group objects by the Gestalt principles of proximity, curve-linearity, and closure. We demonstrate the results with several examples.},
keywords = {group selection},
}
@misc{kulikov2005measuring,
title = {Measuring the Effective Parameters of Steering Motions},
author = {Kulikov*, Sergey and {MacKenzie}, I. Scott and Stuerzlinger, Wolfgang},
booktitle = {Extended Abstracts on Human Factors in Computing Systems},
publisher = {ACM},
series = {CHI EA '05},
howpublished = {Extended Abstract},
year = {2005},
month = {Apr},
pages = {1569-1572},
doi = {https://doi.org/10.1145/1056808.1056968},
pdf = {papers/steeringwidth.pdf},
teaser = {teasers/steeringwidth.png},
abstract = {The steering law model describes pointing device motion through constrained paths. Previous uses of the model are deficient because they are built using only error-free responses, ignoring altogether the path of the cursor. We correct this by proposing and validating a technique to include spatial variability, including errors. The technique is a variant of the well-known "effective target width" used in Fitts' law models. An experiment designed to test our technique demonstrates the improvement: Correlations are consistently higher when spatial variability is included in building the model. Suggestions to aid further development of the steering law model are included.},
keywords = {steering},
}
@misc{stuerzlinger2005multi,
title = {MULTI: Multi-User Laser Table Interface},
author = {Stuerzlinger, Wolfgang},
booktitle = {CHI Workshop on Distributed Display Environments},
howpublished = {Extended Abstract},
year = {2005},
month = {Apr},
numpages = {2},
pdf = {papers/multi_design.pdf},
abstract = {We present a new system, which consists of an interactive table and several interactive wall displays and is designed to be used by a single person as well as collaboratively. A new kind of interaction device, based on laser pointes, affords both local (i.e. pen-based) as well as remote interaction. The research focuses on interaction techniques for this system as well as research on collaborative activities, in particular collaborative design.},
keywords = {large display system, large display interaction, collaboration, laser},
}
@misc{pavlovych2005windowmanager,
title = {A Window Manager for High Dynamic Range Display Systems},
author = {Pavlovych*, Andriy and Vorozcovs*, Andrew and Stuerzlinger, Wolfgang},
booktitle = {VR Workshop on Emerging Display Technologies},
howpublished = {Extended Abstract},
year = {2005},
month = {Mar},
pages = {31-34},
pdf = {papers/hdrwinmgr.pdf},
abstract = {The dynamic luminance range of many real-world environments exceeds the capabilities of current display technology by several orders of magnitude. Recently, new display systems have demonstrated, which are capable of displaying images with a dynamic luminance range much more similar to that encountered in the real world.
The paper summarizes how the human eye perceives high dynamic luminance ranges, sources of high dynamic range data, how the new display systems work, as well as their limitations. The paper discusses the need for a high dynamic range window manager and presents an initial implementation. Finally, the results of a preliminary evaluation are presented.},
keywords = {high dynamic range, GUI},
}
@misc{oh2004sesame,
title = {{SESAME}: {3D} Conceptual Design System},
author = {Oh*, Ji-Young and Stuerzlinger, Wolfgang},
booktitle = {SIGGRAPH Posters},
publisher = {ACM},
series = {SIGGRAPH '04},
howpublished = {Poster},
year = {2004},
month = {Aug},
numpages = {1},
doi = {https://doi.org/10.1145/1186415.1186461},
pdf = {papers/sesame_poster.pdf},
abstract = {We present a system for a conceptual design session in the desktop Virtual Environment (DVE) and Computer Aided Design (CAD). We consider easy modification to be important for conceptual sessions, as users alter the design frequently in those sessions. The system presents new techniques to make the modification of a scene easy.},
keywords = {3D manipulation, 3D positioning, design},
}
@misc{pouliquen2004hog,
title = {{HOG}: A New Model Representation for {3D} Acquisition and Planning},
author = {Pouliquen*, Gilles and Stuerzlinger, Wolfgang},
booktitle = {Canadian Conference on Intelligent Systems},
howpublished = {Poster},
year = {2004},
month = {Jun},
numpages = {1},
pdf = {papers/HOG_poster.pdf},
abstract = {Digital acquisition of 3D objects is a process in which a computer model of a physical object is constructed. This process is extremely popular nowadays as the resulting computer models have many applications. The acquisition process can be decomposed into four stages which have to be repeated until a satisfying model is obtained. Those four stages are scanning, registration, integration and planning [1].
The planning stage is needed because an object cannot be modeled from a single scan. It is necessary to measure the object from various points of view to obtain a complete model.
Currently, there is no system that can automatically scan an unknown object. Hence, a highly trained operator is needed to control the scanning device. The operator must select poses for the scanner such that the number of scans required to completely scan the object is kept reasonably small.
We present a novel representation for the model: the Hierarchical Occupancy Grid (HOG). This representation can be used for the integration and planning stage of the 3D acquisition pipeline.},
keywords = {3D scanning, next-best view},
}
@misc{stuerzlinger2004presentation,
title = {High Dynamic Range Display System},
author = {Stuerzlinger, Wolfgang},
booktitle = {DRDC/CVR Workshop},
howpublished = {Abstract},
year = {2004},
month = {Mar},
keywords = {high dynamic range, display},
}
@misc{pavlovych2003modeling,
title = {Modeling non-Expert Text Entry Speed on Phone Keypads},
author = {Pavlovych*, Andriy and Stuerzlinger, Wolfgang},
booktitle = {16th Annual ACM Symposium on User Interface Software and Technology},
series = {UIST '03},
howpublished = {Poster},
year = {2003},
month = {Nov},
pdf = {papers/nonexpertmodel.pdf},
abstract = {For mobile phones, previous research has created models that can be used to predict expert performance. However, one important factor that influences the success of new interaction techniques is the users' initial experience with them. In this work, we present a new model to predict text entry speed on 12-button mobile phone keypads for novices. The model is based on Fitts' law, letter digraph probabilities, and a model of the mental processing time before key presses.},
keywords = {text entry, novice},
}
@misc{seetzen2003emerging,
title = {High Dynamic Range Display System},
author = {Seetzen*, Helge and Whitehead, Lorne and Stuerzlinger, Wolfgang and Vorozcovs*, Andrew and Wilson, Hugh and Ashdown, Ian and Ward, Greg},
booktitle = {Emerging Technologies at ACM SIGGRAPH 2003},
series = {SIGGRAPH '03},
howpublished = {Demonstration},
year = {2003},
month = {Jul},
numpages = {1},
pdf = {papers/hdr_demonstration.pdf},
abstract = {We have developed a high dynamic range (HDR) display capable of presenting a luminance range of 10,000 cd/m2 to 0.1 cd/m2. In addition to the initial embodiment of the technology, we have developed a flat-panel version using light emitting diodes (LED) which offers the same dramatic dynamic range benefits in a much smaller package.},
keywords = {high dynamic range, display},
}
@misc{yourganov2002simulation,
title = {Simulation of Camera Distortions},
author = {Yourganov*, Grigori and Stuerzlinger, Wolfgang},
booktitle = {Space Vision and Advanced Robotics},
series = {SVAR '02},
howpublished = {Poster},
year = {2002},
month = {Jun},
keywords = {camera distortion},
}
@techreport{yourganov2001tonemapping,
title = {Tone-Mapping for High Dynamic Range Images},
author = {Yourganov*, Grigori and Stuerzlinger, Wolfgang},
institution = {Dept. of Computer Science, York University, Canada},
type = {Technical Report},
year = {2001},
month = {Dec},
numpages = {12},
pdf = {papers/TR_tonemapping.pdf},
keywords = {high dynamic range, tone mapping},
}
@misc{yourganov2001hdrvideo,
title = {High Dynamic Range Video},
author = {Yourganov*, Grigori and Stuerzlinger, Wolfgang},
booktitle = {York CVR Conference: Levels of Perception},
series = {CVR '01},
howpublished = {Poster},
year = {2001},
month = {Jun},
keywords = {high dynamic range, video},
}
@techreport{yourganov2001acquiring,
title = {Acquiring High Dynamic Range Video at Video Rates},
author = {Yourganov*, Grigori and Stuerzlinger, Wolfgang},
institution = {Dept. of Computer Science, York University, Canada},
type = {Technical Report},
year = {2001},
month = {May},
numpages = {18},
pdf = {papers/TR_hdrvideo.pdf},
abstract = {In the real world, the scene may contain some well-illuminated areas as well as some areas that are in the darkness. The dynamic range of the scene, or the radiance ratio between the brightest and the darkest spots, can be quite big – it can span several orders of magnitude in some cases. This is a lot wider range than the range that our digital camera can adequately capture, and that our monitor can adequately display. The areas that are too bright for the dynamic range of our camera are going to be saturated on our image, and the areas that are too dark will be under-exposed. In both cases, all the information about these areas will be lost in the image.
A way to solve this problem is to combine different shutter speeds of our camera. Smaller shutter speeds can give us good information about the bright areas (because we won't have saturation), and longer shutter speeds effectively capture the dark areas. So by alternating the shutter speeds and by combining the two images into one in real-time, we can achieve higher dynamic range for digital video cameras.},
keywords = {high dynamic range, video},
}
@misc{yourganov2001poster,
title = {High Dynamic Range Video},
author = {Yourganov*, Grigori and Stuerzlinger, Wolfgang},
booktitle = {Vision and Intelligent Systems Workshop},
howpublished = {Poster},
year = {2001},
month = {May},
keywords = {high dynamic range, video},
}
@misc{poupyrev20003duibib,
title = {20th Century {3DUI} Bib: Annotated Bibliograpy of {3D} User Interfaces of the 20th Century},
author = {Poupyrev, Ivan and Kruijff, Ernst and Bowman, Doug and Billinghurst, Mark and Cugini, John and Dachselt, Raimund and Hinckley, Ken and {LaViola}, Joe and Lindeman, Rob and Pierce, Jeff and Steed, Anthony and Stuerzlinger, Wolfgang},
year = {2000},
month = {Jan},
url = {http://people.cs.vt.edu/~bowman/3dui.org/bibs/3duibib.pdf},
commented-url = {http://www.mic.atr.co.jp/~poup/3dui/3duibib.htm},
commented-url2 = {https://web.archive.org/web/20070223123901/http://www.mic.atr.co.jp/~poup/3dui/3duibib.htm},
}
@misc{elinas2000clouds,
title = {Real Time Rendering of {3D} Clouds},
author = {Elinas*, Pantelis and Stuerzlinger, Wolfgang},
booktitle = {Graphics Interface},
series = {GI '00},
howpublished = {Poster},
year = {2000},
month = {May},
numpages = {3},
pdf = {papers/cloudsposter.pdf},
abstract = {There is a myriad of real-time graphics applications that can greatly increase in realism with the introduction of realistic clouds in the scenery. These include applications in virtual reality, outdoor scene visualization, flight simulation, games etc. In the past, several researchers have proposed algorithms for realistic cloud rendering for non-real-time applications. Of these, the approaches of Gardner 85 and Nishita 96 stand out as the ones that give the most visually pleasing results. In our work, we are developing an implementation of Gardner's 3D cloud rendering algorithm augmented with recent advances such as photon maps with the help of hardware accelerated OpenGL.
Our implementation follows closely, Gardner's approach. We use textured ellipsoids as the building blocks for the clouds. We use Perlin noise textures compared to Gardner's spectral noise textures because we have more flexibility in controlling their appearance. The texture used is an indication of the volume density of the ellipsoid. Rendering the ellipsoids produces ellipses. Because clouds are more transparent at their edges compared to their middle, a result of the fact that the center of a cloud is denser, we need to fuzz out the edges of the ellipses.
Each cloud is made of a number of ellipsoids. The first step is to render each of the ellipsoids individually and evaluate the transparency over the resulting ellipse. The next step is to combine all the ellipses together to render the complete cloud.
Equation (1) is used to compute the transparency as a function of two thresholds one applied to the edge (T1) and one applied to the center of
the ellipse (T2). The values produced are consistent with OpenGL alpha channel values. We use a normalizing factor D just as Gardner did. We generate the function g(x,z) over the ellipsoid by utilizing projective textures. The latter function is maximum at the center of the ellipse and goes to zero at its edges; a spotlight texture is used to generate this effect. Evaluation is done partly in the alpha channel and partly in the RGB channels of the frame buffer in two steps. First T2*(1-g(x,z)) is computed and stored in the RGB channels. The It-T1 part is computed in the alpha channel. We then perform α = (R-α) by utilizing the color matrix extension. We set the color matrix to copy the red to the alpha channel while setting up subtractive blending and then we perform the operation by copying the frame buffer onto itself. The 1/D scaling is also achieved in the same step by including the 1/D term in the color matrix. The result is stored in the alpha channel while the RGB channels are cleared to accept new data in the next step.
Next we render the ellipsoids using a second texture that determines their color. We use another Perlin noise texture modulated with the color of the ellipsoids calculated using an infinite light source representing the Sun. The latter produces a simple approximation to global illumination of the cloud even though effects such as self-shading of the cloud is not taken into account. We are currently investigating better approaches to this such as using photon maps. The results of this step are stored in the RGB channels.
At this point the back buffer holds each of the ellipses including their transparency. We read these data into a texture of the smallest size that includes all the ellipses. Then, we calculate where on the screen each of the ellipses should appear and we render textured rectangles for each of the ellipsoids. We render each of the rectangles in the order of back to front with respect to the position of the ellipsoids in 3D; the ellipsoids are originally sorted roughly from back to front with respect to the location of their center.
This implementation is compatible with standard OpenGL hardware in its majority with the exception of the color matrix extension that is only available on SGI machines. Our implementation achieves real-time frame rates on low-end workstations such the SGI NT 320 and SGI O2 machines. More complex clouds made of 130+ ellipsoids can be rendered in real-time on more powerful machines such as the SGI Onyx.},
keywords = {rendering, real-time},
}
@misc{salzman2000constraint,
title = {Constraint Based {3D} Scene Construction},
author = {Salzman*, Tim and Smith*, Graham and Stuerzlinger, Wolfgang},
booktitle = {Graphics Interface},
series = {GI '00},
howpublished = {Poster},
year = {2000},
month = {May},
numpages = {2},
pdf = {papers/miveposter.pdf},
abstract = {Realistic 3D scenes often contain thousands of objects, and are in general difficult to model using today's CAD programs. We address this problem by exploiting predefined semantic relationships between objects to dynamically group and constrain them [GS99]. Virtual constraints, which de-couple the object's geometry from its constraints, are presented. Also discussed are techniques for dynamically grouping and re-grouping objects based on their semantic and virtual constraints. Preliminary testing shows that our system provides a fast, intuitive user interface for 3D scene construction. Finally, we will present ideas for future work.
Positioning objects in a virtual environment is not an intuitive task. One approach is direct manipulation using a six degree of freedom (DOF) input device. However, it is hard to position objects precisely using these devices, users often become fatigued, and many object interactions can be more effectively accomplished using a simple 2D interface such as a mouse [HPGK+94]. For these reasons, much research has been focused on software techniques for manipulating 3D objects using standard 2D input devices.
Bier [Bi90] presented snap-dragging for interactive solid modeling systems. This system used a general purpose gravity function and alignment manifolds to position objects in the scene. Snap-dragging provided easy selection of object features but the system required a complex user interface, had an unchangeable view and was computationally intensive.
In Object Associations [BS95], Bukowski and Sequin use a combination of physical properties (pseudo gravity) and goal oriented behaviour (alignment) to position and manipulate objects in a scene. This system was used to model the Berkeley Soda Hall WALKTRHU environment, which contained thousands of objects. However, adding new objects to the library is difficult, as object association must be coded. Constrained objects do not always move together because there is no dynamic grouping, instead the scene is searched for associated objects each time an object is moved. Further, all associations in this system are limited by object geometry.
Gosele exploited natural object behaviour to define and maintain object constraints [Go99]. Polygons were used to define offer and constraint areas, and a hierarchical labelling system was used to define which polygons could be constrained together. Typical constraint labels were on-Floor, on-Wall, and on-Workspace. Collision detection was added to the system to add realism by preventing inter-object penetrations. However, once constrained, objects in this system could not be unconstrained. Also, multiple constraints between two-objects were not possible.
Our system improves upon previous work in the following ways. Firstly, we allow constraints to be broken by pulling away from the constraining surface. For example, an object constrained to the floor and the wall can be unconstrained from the wall by pulling the object away from the wall. Also, an object can be re-constrained by translating it to another acceptable offer area. To show the user which offer areas will accept an object, all acceptable offer areas are highlighted when an object is selected for translation. Un-constraining and re-constraining an object invokes the dynamic grouping mechanism, which maintains the constraint relationships between objects.
We present the notion of virtual constraints. A virtual-constraint can be any polygon in 3D object-space, not necessarily associated with the object's geometry. An example is a polygon somewhere beneath a table, to which the front of a chair may be constrained. We present negative constraints, which are a specialization of virtual constraints are. Negative constraints are useful for defining volumes of space in which certain objects should not be placed. For example a desk would not be placed against a doorway because it would make the door inaccessible.
Our system has optimized the constraint satisfaction algorithm by pruning the search for valid offer areas and using a minimal distance constraint, typically the bounding radius of an object.
Finally, we present dual-constraints, bi-directional constraints between objects. When two or more objects are constrained by dual constraints, they form a dual-group. Using a drag-add technique, a row of constrained, neatly aligned books can be created on a bookshelf with one interaction step. We introduce the push-pull metaphor for interacting with a dual-group. When a dual-group is selected for translation, a connected-component search finds all group members who are attached to the selected object by dual-constraints in the approximate direction of translation. Those objects that are not attached in the direction of translation are un-grouped. With this technique, a row of cabinets that are connected by dual groups can be split into two groups by selecting a cabinet in the center and pulling in the direction that the new group is to translate.
Preliminary testing of the system is very promising. After a very short demo of the system, first time users were able to recreated a reasonably complicated scene in a matter minutes. Future plans are to test the system rigorously and compare results to a system with conventional interaction techniques.},
keywords = {3D manipulation},
}
@misc{stcyr2000knowledge,
title = {A Knowledge-Based Agent for CAD systems},
author = {St-Cyr+, Olivier and Lesperance, Yves and Stuerzlinger, Wolfgang},
booktitle = {Graphics Interface},
series = {GI '00},
howpublished = {Poster},
year = {2000},
month = {May},
numpages = {2},
pdf = {papers/agentposter.pdf},
abstract = {This poster describes an approach in improving the usability of computer-aided design (CAD) applications by adding an intelligent agent that assists the user in his/her interaction with the system. To implement the agent, I used ConGolog [GLL97, LLR99] – a very high-level programming language for developing knowledge-based agents that are embedded in complex environments. ConGolog supports the specification of a task-level model of a dynamic environment, the description of complex behaviours, and the synthesis of new plans at run-time. A prototype intelligent agent is being developed to work with an existing 3D CAD system [GS99]. This agent is intended to help the user in designing an office layout that satisfies his goals.
The CAD system [GS99] that our intelligent agent works with is built to allow the user to design a 3D virtual environment (office, kitchen, living room, etc.). The system's graphical user interface is quite simple. Interactions consist primarily of using the mouse to pick and place various types of objects (desk, chair, lamp, inkwell, etc.) in the room layout. In this, it resembles the Object Associations system [BS95]. The system handles the details of interactions based on a model of objects and the physical constraints that hold in the scene, for instance, an object being supported by a particular surface. But the system lacks a model of the user, of the task that he/she is trying to perform, and of the objectives that he/she is trying to achieve. It cannot really assist the user in quickly creating the desired room layout.
An early example for a system that attempts to aid the user in creating a room layout is CRACK [FM88]. This 2D system critiques the current design with text messages that explain the problem. The domain knowledge embedded in the critiquing system is not used to actively aid the user for placing objects.
It is believed that the use of intelligent agent technology can provide many benefits in the area of layout systems. An agent would maintain a high-level representation of the application domain, including object behaviour and user knowledge and goals. This could be used to enforce complex application specific constraints on the way objects are manipulated and on the layouts
that are produced. Secondly, such a model could be used for disambiguation and consistency checking. Humans often communicate information about a task very inaccurately because they understand the context of the task and its goals from previous experience. An agent could use its domain knowledge to resolve ambiguities, as well as ask more meaningful questions when user input is required. Moreover, the user goal model could be exploited to detect inadvertent errors. Thirdly, the agent could also aid the user in constructing the virtual design using its knowledge of the domain and user goals. Because it is aware of the current state of the design, it can provide suggestions and advice to the user, guide him through the task, and respond to user's questions. All this would lead towards much more natural and intuitive interaction between the user and the CAD system.},
keywords = {3D manipulation, design},
}
@misc{stcyr2000intelligent,
title = {An Intelligent Assistant for Computer-Aided Design},
author = {St-Cyr+, Olivier and Lesperance, Yves and Stuerzlinger, Wolfgang},
booktitle = {Smart Graphics: Papers from the AAAI Spring Symposium},
series = {SG '00},
isbn = {978-157735110-8},
howpublished = {Extended Abstract},
year = {2000},
month = {Mar},
pages = {24-28},
url = {https://aaai.org/Library/Symposia/Spring/ss00-04.php},
pdf = {papers/intelagent.pdf},
abstract = {This paper describes an approach in improving the usability of computer-aided design (CAD) applications by adding an intelligent agent that assists the user in his/her interaction with the system. To implement the agent, we use ConGolog [GLL97, LLR99] – a very high-level programming language for developing knowledge-based agents that are embedded in complex environments. ConGolog supports the specification of a task-level model of a dynamic environment, the description of complex behaviors, and the synthesis of new plans at run-time. A prototype intelligent agent is being developed to work with an existing 3D CAD system [GS99]. This agent is intended to help the user in designing an office layout that satisfies his goals.
The CAD system [GS99] that our intelligent agent works with is built to allow the user to design a 3D virtual environment (office, kitchen, living room, etc.). The system's graphical user interface is quite simple. Interactions consist primarily of using the mouse to pick and place various types of objects (desk, chair, lamp, inkwell, etc.) in the room layout. In this it resembles the Object Associations system [BS95]. The system handles the details of interactions based on a model of objects and the physical constraints that hold in the scene, for instance, an object being supported by a particular surface. But the system lacks a model of the user, of the task that he is trying to perform, and of the objectives that he is trying to achieve. It cannot really assist the user in quickly creating the desired room layout.
An early example for a system that attempts to aid the user in creating a room layout is CRACK [FM88]. This 2D system critiques the current design with text messages that explain the problem. The domain knowledge embedded in the critiquing system is not used to actively aid the user for placing objects.
We believe that the use of intelligent agent technology can provide many benefits in the area of layout systems. An agent would maintain a high-level representation of the application domain, including object
behavior and user knowledge and goals. This could be used to enforce complex application specific constraints on the way objects are manipulated and on the layouts that are produced. Secondly, such a model could be used for disambiguation and consistency checking. Humans often communicate information about a task very inaccurately, because they understand the context of the task and its goals from previous experience. An agent could use its domain knowledge to resolve ambiguities, as well as ask more meaningful questions when user input is required. Moreover, the user goal model could be exploited to detect inadvertent errors. Thirdly, the agent could also aid the user in constructing the virtual design using its knowledge of the domain and user goals. Because it is aware of the current state of the design, it can provide suggestions and advice to the user, guide him through the task, and respond to user questions. All this would lead to much more natural and intuitive interaction between the user and the CAD system.},
keywords = {3D modeling, 3D manipulation, constraints},
}
@comment{c, c={leave the "_stuerzlinger" in the ID to enable umlaut-free search!}}
@techreport{bastos_stuerzlinger1998forward,
title = {Forward Mapped Planar Mirror Reflections},
author = {Bastos*, Rui and Stürzlinger, Wolfgang},
institution = {Univ. of North Carolina at Chapel Hill},
type = {Technical Report},
year = {1998},
month = {Aug},
number = {TR98-026},
numpages = {12},
pdf = {papers/TR98-026.pdf},
abstract = {This paper presents a new technique, which we call depth-preserving reflection mapping, to render mirror-like reflections on planar surfaces in constant time. It is a hybrid solution which combines geometry-based rendering and image-based rendering into a two-pass mirror reflection rendering approach. The technique extends the traditional reflection mapping to preserve depth per texel and uses forward warping to approximate the mirror-like reflections on planar surfaces. For clarity, to distinguish these texels from the ones of traditional reflection mapping, we call them zexels.},
keywords = {rendering, real-time},
}
@comment{c, c={leave the "_stuerzlinger" in the ID to enable umlaut-free search!}}
@techreport{raskar_stuerzlinger1998efficientimage,
title = {Efficient Image Generation for Multiprojector and Multisurface Displays},
author = {Raskar*, Ramesh and Cutts*, Matt and Welch, Greg and Stürzlinger, Wolfgang},
institution = {Univ. of North Carolina at Chapel Hill},
type = {Technical Report},
year = {1998},
month = {Apr},
number = {TR98-016},
numpages = {12},
pdf = {papers/TR98-016.pdf},
abstract = {We describe an efficient approach to rendering a perspectively correct image on a potentially irregular display surface that may be illuminated with one or more distinct devices. The first pass of the technique generates an image of the desired graphics model using conventional rendering. The second pass projects that image as a texture onto a model of the display surface, then re-renders the textured display surface model from the viewpoint of each display device. The algorithm scales with the complexity of the display surface, and is constant with respect to the complexity of the graphics model.},
keywords = {rendering, projector, real-time},
footnote = {Extended version of EGSR '98 paper with theoretical analysis},
}
@comment{c, c={leave the "_stuerzlinger" in the ID to enable umlaut-free search!}}
@misc{schaufler_stuerzlinger1998hierarchical,
title = {{3D} Hierarchical Image Cache},
author = {Schaufler*, Gernot and Stürzlinger, Wolfgang},
booktitle = {Workshop on Image-Based Rendering and Modeling},
howpublished = {Poster},
year = {1998},
month = {Mar},
commented-url = {http://www.gup.uni-linz.ac.at:8001/staff/schaufler/papers/octimp},
keywords = {rendering, real-time},
}
@techreport{aliaga_stuerzlinger1998framework,
title = {A Framework for the Real-Time Walkthrough of Massive Models},
author = {Aliaga*, Daniel and Cohen*, Jon and Wilson*, Andrew and Zhang*, Hansong and Erikson*, Carl and Hoff*, Kenny and Hudson*, Tom and Stürzlinger, Wolfgang and Baker*, Eric and Bastos*, Rui and Whitton, Mary and Brooks, Fred and Manocha, Dinesh},
institution = {Univ. of North Carolina at Chapel Hill},
type = {Technical Report},
year = {1998},
month = {Mar},
number = {TR98-013},
numpages = {12},
url = {https://techreports.cs.unc.edu/papers/98-013.pdf},
pdf = {papers/TR98-013.pdf},
abstract = {We present a framework for rendering very large 3D models at nearly interactive rates. The framework scales with model size. Our framework can integrate multiple rendering acceleration techniques, including visibility culling, geometric levels of detail, and image-based approaches. We describe the database representation scheme for massive models used by the framework. We provide an effective pipeline to manage the allocation of system resources among different techniques. We demonstrate the system on a model of a coal-fired power plant composed of more than 15 million triangles.},
keywords = {rendering, real-time},
}
@techreport{stuerzlinger1998imaging,
title = {Imaging all Visible Surfaces Or How many Reference Images are needed for Image-Based Modeling?},
author = {Stürzlinger, Wolfgang},
institution = {Univ. of North Carolina at Chapel Hill},
type = {Technical Report},
year = {1998},
month = {Mar},
number = {TR98-010},
numpages = {11},
pdf = {papers/TR98-010.pdf},
abstract = {Today many systems exist to generate geometric models of existing scenes and objects. However, no accurate data about surface appearance such as colors and textures is stored in this process. Such data can be captured as a series of images that, collectively, capture all surfaces of the object.
This work introduces a method to compute a minimal set of camera positions for this purpose. Taking images from the computed positions can then be used to derive a complete set of surface appearance data. A slightly different application of the presented method is the computation of a minimal set of viewpoints for reference images to be used in image-based rendering methods.
First a method to determine an optimal set of viewpoint regions for a given scene is introduced. It uses a hierarchical visibility method to preprocess the scene. Then a technique to find an optimal set of viewpoint regions is presented and the solution is used to derive an optimal set of viewpoints. Results and visualizations of the computed solutions are presented.},
keywords = {3D scanning, visibility},
}
@techreport{stuerzlinger1995discontinuity,
title = {Discontinuity Meshing for a Radiosity Algorithm},
author = {Stürzlinger, Wolfgang},
institution = {GUP, Johannes Kepler Universität Linz, Austria},
type = {Technical Report},
year = {1995},
month = {Oct},
number = {CEI PACT D4V-8},
url = {https://www.jku.at/forschung/forschungs-dokumentation/publikation/2155},
keywords = {rendering, global illumination},
}
@techreport{stuerzlinger1995form,
title = {Form Factor Calculation for a Parallel Radiosity Algorithm},
author = {Stürzlinger, Wolfgang},
institution = {GUP, Johannes Kepler Universität Linz, Austria},
type = {Technical Report},
year = {1995},
month = {Jul},
number = {CEI-PACT D4V-6},
url = {https://www.jku.at/forschung/forschungs-dokumentation/publikation/2142},
keywords = {rendering, global illumination, parallel, visibility},
}
@comment{c, c={leave the "_stuerzlinger" in the ID to enable umlaut-free search!}}
@misc{schaufler_stuerzlinger1995parallelposter,
title = {Parallel Radiosity},
author = {Schaufler*, Gernot and Stürzlinger, Wolfgang and Volkert, Jens},
booktitle = {Workshop on Algorithms for Future Technologies},
howpublished = {Poster},
year = {1995},
month = {Mar},
commented-location = {Prague, CZ},
keywords = {rendering, global illumination, parallel},
}
@comment{c, c={leave the "_stuerzlinger" in the ID to enable umlaut-free search!}}
@techreport{schaufler_stuerzlinger1995load,
title = {Load Balancing for a Parallel Radiosity Algorithm},
author = {Schaufler*, Gernot and Stürzlinger, Wolfgang and Wild*, Christoph},
institution = {GUP, Johannes Kepler Universität Linz, Austria},
type = {Technical Report},
year = {1995},
month = {Jan},
number = {CEI PACT D4V-3},
url = {https://www.jku.at/forschung/forschungs-dokumentation/publikation/2134},
keywords = {rendering, global illumination, parallel, visibility},
}
@techreport{stuerzlinger1994description,
title = {Description and Implementation of a Parallel Radiosity Algorithm},
author = {Stürzlinger, Wolfgang and Wild*, Christoph and Schaufler*, Gernot},
institution = {GUP, Johannes Kepler Universität Linz, Austria},
type = {Technical Report},
year = {1994},
month = {Jul},
number = {CEI PACT D4V-1},
url = {https://www.jku.at/forschung/forschungs-dokumentation/publikation/2129},
keywords = {rendering, global illumination, parallel},
}
@misc{stuerzlinger1994parallelvisibility,
title = {Parallel Visibility Calculations for Parallel Radiosity},
author = {Stürzlinger, Wolfgang and Wild*, Christoph},
booktitle = {Workshop Paragraph},
howpublished = {Poster},
year = {1994},
month = {Mar},
pages = {32-40},
commented-location = {Hagenberg, AT},
abstract = {The radiosity method models the interaction of light between diffuse reflecting surfaces, thereby accurately predicting global illumination effects. Due to the high computational effort to calculate the transfer of light between surfaces and the memory requirements for the scene description, a distributed, parallelized version of the algorithm is needed for scenes consisting of thousands of surfaces. We present a distributed, parallel progressive radiosity algorithm. Then we parallelize the visibility calculations and present a scheme for the communication structure. Finally we analyze the results.},
keywords = {rendering, global illumination, parallel, visibility},
}
@techreport{stuerzlinger1993fxfire,
title = {FXFIRE - Global Illumination with Radiosity},
author = {Stürzlinger, Wolfgang},
institution = {GUP, Johannes Kepler Universität Linz, Austria},
type = {Technical Report},
year = {1993},
month = {Dec},
keywords = {rendering, global illumination},
}
@techreport{stuerzlinger1993flirt,
title = {FLIRT - Faster than Light Ray Tracer},
author = {Stürzlinger, Wolfgang and Tobler*, Robert and Schindler*, Michael},
institution = {Vienna University of Technology, Austria},
type = {Technical Report},
year = {1993},
month = {Aug},
keywords = {rendering, ray tracing},
}
@mastersthesis{stuerzlinger1999habilitation,
title = {Bildgenerierung},
author = {Stürzlinger, Wolfgang},
publisher = {Johannes Kepler Universität Linz, Austria},
year = {1999},
month = {Apr},
abstract = {A fundamental task in computer graphics is the generation of images. Given a geometric model of an object or scene the user wants a visual representation for a given viewpoint. This visualization process is also known as rendering images of a model.
An active research area in rendering is the generation of images with high visual realism. Important visual cues like highlights on surfaces and shadows cast by light sources aid the viewer in understanding an image. Images with high realism are produced with global illumination methods, which approximate the light distribution in an environment to varying degrees.
The major challenge in real-time rendering is to generate images as quickly as possible. Frame rates higher than 20 frames per second are needed to ensure that users perceive smooth motion. Although image generation hardware is widely available, it is hard to visualize very large structures at interactive rates even on high-end platforms. Furthermore, model sizes are growing quicker than graphics hardware capabilities. Several classes of techniques for optimized rendering have been devised to achieve high frame rates.
This text places most publications of the author in the context of these two research areas in computer graphics.},
keywords = {rendering, real-time, ray tracing},
note = {Austrian Habilitation},
}
@phdthesis{stuerzlinger1992dissertation,
title = {Radiosity mit Voronoi-Diagrammen und Diskontinuitäts-Meshes},
author = {Stürzlinger, Wolfgang},
school = {Vienna University of Technology, Austria},
year = {1992},
month = {Dec},
url = {https://catalogplus.tuwien.at/permalink/f/qknpf/UTW_alma2156324830003336},
abstract = {In dieser Arbeit wird ein Verfahren vorgestellt, das es ermöglicht, die genaue Beleuchtung einer Szene zu berechnen, die von flächigen Lichtquellen beleuchtet wird und die durch Polygone beschrieben ist, deren Oberflächen diffus sind. Zuerst wird eine Oberflächenrepräsentation mit Voronoi-Diagrammen vorgestellt, die es erlaubt beim Progressive Refinement Radiosity-Verfahren die Oberflächen adaptiv zu unterteilen, ohne dass die aus der Literatur bekannten Probleme auftreten. Dann wird ein Verfahren zur Berechnung von Schatten- und Halbschatten-Bereichen besprochen. Dieses Verfahren konstruiert eine Oberflächen-Repräsentation, die auf die verschiedenen Diskontinuitäten der Helligkeitsfunktion auf einer Oberfläche Rücksicht nimmt. Durch die neu vorgestellte Kombination der beiden Verfahren kann nun sowohl die Helligkeitsfunktion auf den Oberflächen sehr exakt approximiert werden, als auch die Radiosity von diesen Flächen genau weiterverteilt werden. Dadurch wird das Problem der diffusen globalen Beleuchtung gelöst. Zusätzlich wird eine Methode vorgestellt, die es erlaubt, nur die relevanten Diskontinuitäten zu berechnen, wodurch eine Beschleunigung des Verfahrens erzielt wird.},
keywords = {rendering, global illumination},
note = {Dissertation, in German},
}
@mastersthesis{stuerzlinger1989ccompiler,
title = {C-Compiler für den VIP-Prozessor},
author = {Stürzlinger, Wolfgang},
school = {Vienna University of Technology, Austria},
year = {1989},
month = {Nov},
url = {https://catalogplus.tuwien.at/permalink/f/qknpf/UTW_alma2145146200003336},
abstract = {An der Technischen Universität Wien ist in den Jahren 1985 bis 1988 das VIP-System ("Vienna Integrated Prolog") entstanden. Speziell für die schnelle Interpretation der Prolog-Programme wurde nun dazu der VIP-Prozessor entworfen. Beim Design des Prozessors wurden, um den Durchsatz zu steigern, einige RISC-Technologien verwendet. Vienna Integrated Prolog ist in der Programmiersprache C implementiert. Zur Portierung auf den VIP-Prozessor wurde nun ein Entwicklungssystem benötigt. Im Rahmen dieser Arbeit wurde ein existierender C-Compiler auf den Prozessor angepasst. Als Compiler wurde ein Produkt der Free Software Foundation ausgewählt, das unter dem Namen GNU-C bekannt ist. Dieser optimierende Compiler ist durch das Erstellen einer sogenannten Maschinenbeschreibung auf einen neuen Prozessor portierbar. Der Compiler wird kontinuierlich erweitert und ist kostenlos erhältlich.},
keywords = {compiler, optimization},
note = {Diplomarbeit, in German},
}
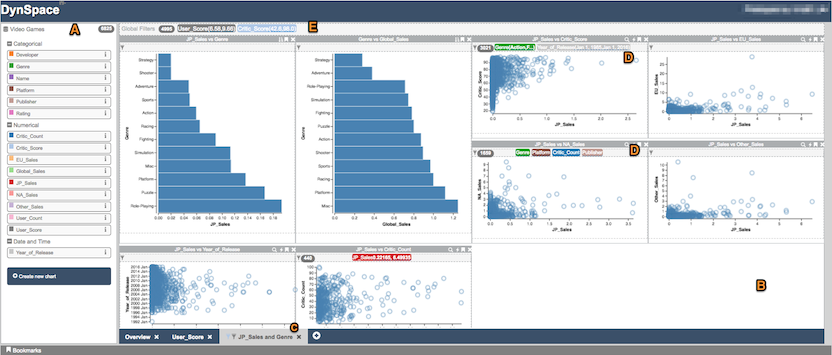
Immersive Analytics
Immersive Analytics uses the power of immersive systems, such as Virtual and Augmented Reality setups and large display to support Visual Analytics processes. A key component is the ability of the user to lay out the visualization of their data in 2D or 3D space as needed to solver their current analytics tasks.
@comment{c, c={STYLE: Author entry should be in "[von] Last [Jr.], First and ..." format}}
@comment{c, c={STYLE: Author trailing* on last name is grad, trailing+ is undergrad student}}
@comment{c, c={STYLE: no year or series or publisher name in booktitle}}
@comment{c, c={STYLE: series should have format "ACRONYM '##", with 2-digit year}}
@comment{c, c={STYLE: conference articles published in journal have conference name in note= and journal acronym in series=}}
@comment{c, c={STYLE: articleno= and numpages= are both supported}}
@comment{c, c={STYLE: pdf= is link to PDF, video= is link to video, teaser= is link to teaser image}}
@comment{c, c={STYLE: doi= is link to doi (or publisher page), url= is link to webpage}}
@comment{c, c={STYLE: note= shows up in the list, footnote= shows up in the individual pages}}
@comment{c, c={STYLE: footnote= is the right place for pdf2, url2, video2, other supplementary materials, etc.}}
@comment{c, c={STYLE: to comment out a field, just prefix it with "commented-", e.g., "commented-year"}}
@comment{c, c={canonical field order: 'title', 'author', 'journal', 'booktitle', 'publisher', 'series', 'issn', 'isbn', 'institution', 'school', 'type', 'howpublished', 'year', 'month', 'volume', 'number', 'pages', 'articleno', 'numpages', 'doi', 'url', 'pdf', 'video', 'teaser', 'abstract', 'keywords', 'award', 'note', 'footnote'}}
@comment{***************************books&special_issues*******************************}
@comment{zachman2025special,
title = {Special Section on the Best Papers of the 20th EuroXR International Conference (EuroXR 2023)},
author = {Walczak, Krzysztof and Zachmann, Gabriel and Niamut, Omar A. and Johnsen, Kyle and Stuerzlinger, Wolfgang and Bourdot, Patrick and Welch, Greg and Alcaniz Raya, Mariano},
journal = {Computers & Graphics},
publisher = {Elsevier},
series = {C&G},
year = {2025},
month = {Nov},
commented-volume = {48},
commented-number = {C},
pages = {1-2},
commented-doi = {https://doi.org/10.1016/j.cag.2025.00.000},
abstract = {We are delighted to introduce this special section of Computers & Graphics, which presents extended versions of the best papers selected from the 20th EuroXR International Conference (EuroXR 2023). The conference was held in Rotterdam, The Netherlands, from November 29 to December 1, 2023, co-located with the Immersive Tech Week. It continues a rich tradition of EuroXR events focused on advances in Virtual, Augmented, and Mixed Reality (VR, AR, MR), collectively referred to as Extended Reality (XR). Since its inception in 2004 under the INTUITION Network of Excellence and subsequent evolution into the EuroXR International Conference, the event has consistently served as a platform to present cutting-edge research, foster collaborations among academia, industry, and public institutions, and promote the adoption of XR technologies across various domains.
The scientific track of EuroXR 2023 maintained a rigorous review process to ensure high quality and impact. A total of 42 papers were submitted to the scientific program, out of which 14 were accepted (an acceptance rate of 33%) across different categories: long, medium, and short papers. Each submission underwent a thorough double-blind peer review process by at least three independent experts, followed by a rebuttal phase and final discussions among the reviewers. The scientific program chairs then made final decisions based on comprehensive meta-reviews. A dedicated Best Papers Awards Committee subsequently evaluated the accepted papers, identifying outstanding contributions, which were then invited for significant extension and re-review for publication in this special section of Computers & Graphics.
The two articles presented here exemplify the diversity and high quality of research at EuroXR 2023:
Enhancing anatomy learning through collaborative VR? An advanced investigation by Haya Almaree, Roland Fischer, René Weller, Verena Uslar, Dirk Weyhe, and Gabriel Zachmann explores the potential benefits of collaborative VR learning environments in medical education. The authors developed a multi-user VR Anatomy Atlas and conducted two comprehensive user studies comparing individual and collaborative learning modes. Their findings offer valuable insights into the effectiveness, usability, and motivational aspects of collaborative VR learning, suggesting that although collaboration does not necessarily enhance learning outcomes or motivation in anatomy education, it opens important questions regarding cognitive load and system usability that require further research.
Psychophysiology of rhythmic stimuli and time experience in virtual reality by Stéven Picard and Jean Botev investigates how rhythmic auditory and visual stimuli influence users' perception of time and task performance within VR environments. The authors systematically analyze the interplay between sensory stimuli, physiological responses (such as eye-tracking data and body temperature), and subjective time estimation. Their results reveal nuanced relationships between stimulus modality, tempo, fatigue, and time perception, offering promising directions for designing VR environments that strategically modulate user experience through rhythm and sensory cues.
Collectively, these papers highlight valuable advancements at the intersection of XR technology, human factors, education, and psychophysiology. They demonstrate how XR can be leveraged not only to improve learning and interaction but also to deepen our understanding of human cognitive and sensory experiences in immersive contexts.
We express our sincere gratitude to all the authors for their outstanding contributions and to the reviewers for their thorough work in maintaining the high standards of Computers & Graphics. We also extend special thanks to the EuroXR 2023 Organizing Committee and the Immersive Tech Week team for hosting a vibrant conference that successfully bridged research, practice, and innovation in Extended Reality.
For further information about EuroXR and future conferences, please visit the official EuroXR Association website at https://www.euroxr-association.org.
We hope that readers will find these contributions as inspiring and thought-provoking as we did.},
keywords = {3D user interfaces, virtual reality, augmented reality},
note = {To appear},
}
@proceedings{zachman2023euroxr,
title = {Virtual Reality and Mixed Reality, 20th EuroXR International Conference},
author = {Zachmann, Gabriel and Walczak, Krzysztof and Niamut, Omar A. and Johnsen, Kyle and Stuerzlinger, Wolfgang and Alcaniz Raya, Mariano and Bourdot, Patrick and Welch, Greg},
publisher = {Springer},
series = {EuroXR '23},
volume = {LNCS 14410},
year = {2023},
month = {Nov},
doi = {https://doi.org/10.1007/978-3-031-48495-7},
teaser = {teasers/EuroXR23.png},
abstract = {We are pleased to present in this LNCS volume the scientific proceedings of the 20th EuroXR International Conference (EuroXR 2023), organized in colocation with the Immersive Tech Week, Rotterdam, the Netherlands, and held during November 29 – December 1, 2023.
This conference follows a series of successful international conferences initiated in 2004 by the INTUITION Network of Excellence on Virtual and Augmented Reality, which was supported by the European Commission until 2008. From 2009 through 2013, it was embedded in the Joint Virtual Reality Conferences (JVRC). Since then, it was known as EuroVR, then EuroXR International Conference, in line with the renaming of the umbrella association.
The focus and aim of the EuroXR conferences is to present, each year, novel results and insights in Virtual Reality (VR), Augmented Reality (AR), and Mixed Reality (MR), commonly referred to under the umbrella of Extended Reality (XR), including software systems, immersive rendering technologies, 3D user interfaces, and applications. EuroXR also aims to foster engagement between European industries, academia, and the public sector, to promote the development and deployment of XR techniques in new and emerging, but also in existing fields. To this end, all EuroXR conferences include not only a scientific track, but also an application-oriented track, with its own proceedings.
Since 2017, the EuroXR Association has collaborated with Springer to publish the proceedings of the scientific track of its annual conference. In order to maintain the scientific standards to be expected from such a conference, we established a number of committees overseeing the process of creating a scientific program: the scientific program chairs, leading an International Program Committee (IPC) made up of international experts in the field, and the EuroXR academic task force.
For the 2023 issue, a total of 42 papers were submitted, out of which 14 papers were accepted (4 long, 8 medium, and 2 short papers). This amounts to an acceptance ratio of 33%. The selection process involved a double-blind peer-review process (each and every paper was reviewed by at least 3 members of the IPC, in many cases even 4), followed by a rebuttal phase, and a final discussion and scoring phase amongst the revewiers. Based on the review reports, the scores, and the reviewers’ discussions, the scientific program chairs took the final decision and wrote a meta-review for each paper.
This year, the scientific program of EuroXR and, hence, this LNCS volume, is organized into three sections: Interaction in Virtual Reality, Designing XR Experiences, and Human Factors in VR: Performance, Acceptance, and Design.
In addition to the regular scientific papers track, EuroXR invited three keynote speakers: Tabitha C. Peck (Davidson College, Davidson, NC, USA), Ferran Argelaguet (Research Scientist, Hybrid team, IRISA/Inria, Rennes, France), and Zerrin Yumak (Assistant Professor of Utrecht University, The Netherlands). Furthermore, the conference hosted an application track, demos and posters sessions, and lab tours. Finally, there were dedicated sessions, for instance, by Greg Welch on VERA, and a workshop on “Vocational Training”.
We would like to thank all the IPC members and external reviewers for their insightful reviews, which helped ensure the high quality of papers selected for the scientific track. Furthermore, we would like to thank the application chairs, demos and posters chairs, and the local organizers of EuroXR 2023.
We are also grateful to the staff of Springer for their support and advice during the preparation of this LNCS volume.},
keywords = {virtual reality, augmented reality, extended reality},
}
@proceedings{teather2020vrstproceedings,
title = {26th Symposium on Virtual Reality Software and Technology 2020},
author = {Teather, Robert J. and Joslin, Chris and Stuerzlinger, Wolfgang and Figueroa, Pablo and Hu, Yaoping and Batmaz, Anil Ufuk and Lee, Wonsook and Ortega, Francisco},
publisher = {ACM},
series = {VRST '20},
year = {2020},
month = {Nov},
doi = {https://doi.org/10.1145/3385956},
teaser = {teasers/VRST2020.png},
abstract = {Welcome to the 26th ACM Symposium on Virtual Reality Software and Technology (VRST 2020) for exchanging knowledge and experience. It is our pleasure to virtually host VRST 2020 from Ottawa, Canada, for the safety of attendees, due to the on-going COVID-19 pandemic.
As a premier international forum for advanced in virtual reality technology, VRST 2020 received 132 paper submissions from all continents. Its program committee (PC) consisted of 27 esteemed researchers to coordinate additional 176 expert reviewers. Each submission underwent at least three reviews for its novelty, technical quality, and impact to the field. The final program of VRST 2020 was thus composed of 28 full papers and 7 short papers, yielding an overall acceptance rate of 26%. The topics of these papers ranged from simulation & graphics, 3D reconstruction & computer vision, haptics, navigation & locomotion, collaborations, avatars, and display & visual perception, to applications. In addition, a total of 59 posters and demos were submitted, and 43 of these were accepted to the technical program.
Moreover, the program was honoured by two distinguished keynote speakers: Doug Bowman from Virginia Tech University (USA) and Mary Whitton of the University of North Carolina at Chapel Hill (USA). As two of the foremost names in the field of virtual reality, they presented stimulating insights to energize the program and provide invaluable insights to new and seasoned researchers alike.
Special thanks are extended to the PC members and expert reviewers for all their dedicated efforts and thoughtful reviews. Their hard work uniquely empowered the program to be interesting.
We hope that attendees will find VRST 2020 inspiring, as it spotlights the latest research in the growing field of Virtual Reality. The event aims to foster collaboration and instigate further growth in this exciting field.},
keywords = {3D user interfaces, virtual reality},
}
@book{marriott2018immersiveanalytics,
title = {Immersive Analytics},
author = {Marriott, Kim and Schreiber, Falk and Dwyer, Tim and Klein, Karsten and Henry Riche, Nathalie and Itoh, Takayuki and Stuerzlinger, Wolfgang and Thomas, Bruce H.},
publisher = {Springer},
year = {2018},
month = {Oct},
volume = {LNCS 11190},
numpages = {371},
doi = {https://doi.org/10.1007/978-3-030-01388-2},
teaser = {teasers/iabook.png},
abstract = {We live in an age where the amount and complexity of data available to us far surpass our ability to understand or to utilise them in decision-making. Analysis of such data is not only common in the physical, social, and life sciences, but is becoming an integral part of effective planning in business, government, e-health, and many other aspects of modern society. Furthermore data analytics is no longer solely the preserve of scientists and professional analysts as personalised data analytics becomes increasingly common.
Visual analytics has become a key technology for human-in-the-loop data analysis. While the standard definition for visual analytics is agnostic of the actual interface devices employed by visual analytics systems, the affordances of the display and input devices used for analysing data strongly affect the experience of the users of such systems and, thereby, their degree of engagement and productivity. For practical visual analytics tools, the platform for interaction is almost always a standard desktop computer. A systematic approach to developing analysis and decision support tools that move beyond the desktop is lacking.
Immersive analytics is a new interdisciplinary field that brings together researchers and practitioners from data visualisation, visual analytics, virtual and mixed reality, human–computer interaction, and human-in-the-loop algorithmics to explore these new forms of analytics tools. The goal is to remove barriers between people, their data, and the tools they use for analysis by developing more engaging, embodied analysis tools that support data understanding and decision-making everywhere and by everyone, either working individually or collaboratively.
This book is the outcome of two coordinated workshops on immersive analytics held in 2016. The first in Shonan, Japan, took place in February and organised by Takayuki Itoh, Kim Marriott, Falk Schreiber, and Uwe Wössner with the help of Karsten Klein, the second was held in June at Dagstuhl, Germany, and was organised by Tim Dwyer, Nathalie Henry Riche, Wolfgang Stuerzlinger, and Bruce H. Thomas, again with the help of Karsten Klein. In all, 25 leading international experts in data visualisation, visual analytics, human–computer interaction, virtual reality and augmented reality attended the first workshop, with another 38 experts attending the second. There was a sizeable overlap of experts between the two workshops that provided a sensible continuity of concepts.
The two workshops explored the definition of immersive analytics and identified the structure and focus of this book. A working group for each chapter was formed at the workshops, with the participation of invited experts as needed, and the groups wrote the chapters contained in this book. A critical goal was to develop a vision of the research domain for immersive analytics and a roadmap for future investigations. Authors submitted manuscripts for their chapters in mid-2017. These initial versions were first reviewed "internally" by one of the book editors. After an initial round of revision based on these internal reviews, the updated manuscripts were sent to expert reviewers invited from the community. We are grateful to these people for their detailed and insightful reviews.},
keywords = {immersive analytics, visual analytics, visualization},
}
@proceedings{arif2018socio,
title = {Socio-Technical Aspects of Text Entry: {MobileHCI} 2018 Workshop},
author = {Arif, Ahmed Sabbir and Stuerzlinger, Wolfgang and Dunlop, Mark D. and Yi, Xin and Seim, Caitlyn},
series = {TEXT '18},
year = {2018},
month = {Sep},
url = {http://ceur-ws.org/Vol-2183},
teaser = {teasers/TEXT2018.png},
abstract = {Mobile text entry has become an integral part of our daily life. We regularly input text on smartphones, laptops, desktops and increasingly on smartwatches, VR systems, interactive tabletops/walls, and kiosks. This text entry is done in all social settings, from solo individuals writing private notes, through social networking in bars with friends, to jointly writing on collaborative devices in public spaces. Traditional tap-based input is increasingly being replaced with or supplemented by voice input or multimodal control. With the ubiquity of text entry, it is becoming increasingly important to consider socio-technical systems perspectives in the design, development, and evaluation of new techniques. The purpose of this one-day workshop is to share and encourage research exploring various socio-technical aspects of text entry, including social and cultural impacts, developing socially and culturally acceptable techniques, and techniques to support all users of varying ages, social and technical backgrounds, language, and physical abilities.},
keywords = {text entry},
}
@proceedings{banic2015suiproceedings,
title = {3rd Symposium on Spatial User Interaction 2015},
author = {Banic, Amy and Suma, Evan and Steinicke, Frank and Stuerzlinger, Wolfgang},
publisher = {ACM},
series = {SUI '15},
year = {2015},
month = {Aug},
doi = {https://doi.org/10.1145/2788940},
teaser = {teasers/SUI2015.png},
abstract = {It is our great pleasure to welcome you to the third ACM Symposium on Spatial User Interaction. This event focuses on the user interface challenges that appear when users interact in the space where the flat, two-dimensional, digital world meets the volumetric, physical, three-dimensional (3D) space we live in. The symposium considers both spatial input as well as output, with an emphasis on the issues around the interaction between humans and systems. Due to the advances in 3D technologies, spatial interaction is now more relevant than ever. Powerful graphics engines and high-resolution screens are now ubiquitous in everyday devices, such as tablets and mobile phones. Moreover, new forms of input, such as multi-touch, finger and body tracking technologies are now easily available, and more and more commercial 3D systems with spatial interaction capabilities exist, many priced at the consumer level. However, the challenges, limitations, and advantages of leveraging this third dimension in human-computer interfaces are still not yet fully understood. These questions will only become more relevant as these emerging technologies continue to cross the barrier towards wide adoption.
The call for papers attracted 48 submissions from Asia, Europe, Australia, and North and South America in all areas of Spatial User Interaction research. The international program committee consisting of 19 experts in the topic areas and the three program chairs handled the review process. Eight submissions were reviewed by the program chairs and rejected without further review due to being incomplete, insufficient quality, or inappropriate for the symposium topic. All other submissions received at least four detailed reviews, two from members of the international program committee and two or more from external reviewers. The reviewing process was double-blind, with the authors' identities visible only to the program chairs and the primary program committee member assigned to the paper. In the end, the program committee accepted 17 papers (10 long, 7 short), corresponding to an overall acceptance rate of 35%. Additionally, 11 posters complement the program and appear in the proceedings. Furthermore, three research demonstrations were accepted and will be presented at the symposium. We also encourage attendees to attend the keynote talk, TRANSFORM: Beyond Tangible Bits, Towards Radical Atoms, presented by Hiroshi Ishii from the MIT Media Lab.},
keywords = {3D user interfaces, virtual reality},
}
@article{steinicke2015spatial,
title = {Spatial Interfaces},
author = {Steinicke, Frank and Stuerzlinger, Wolfgang},
journal = {Computer Graphics and Applications},
publisher = {IEEE},
series = {CG&A},
year = {2015},
month = {Jul},
volume = {35},
number = {4},
pages = {6-7},
doi = {https://doi.org/10.1109/MCG.2015.92},
abstract = {CG&A welcomes Frank Steinicke (University of Hamburg) and Wolfgang Stuerzlinger (Simon Fraser University) as new members to its editorial board and as the new coeditors of the Spatial Interfaces department.},
keywords = {3D user interfaces, virtual reality},
}
@article{steinicke2015special,
title = {Special Section on Spatial User Interaction},
author = {Steinicke, Frank and Stuerzlinger, Wolfgang and Suma, Evan},
journal = {Computers & Graphics},
publisher = {Elsevier},
series = {C&G},
year = {2015},
month = {May},
volume = {48},
number = {C},
pages = {A1-A2},
doi = {https://doi.org/10.1016/j.cag.2015.03.002},
abstract = {It is our great pleasure to present you with the Computers & Graphics special section on Spatial User Interaction (SUI). The special section contains extended versions of the best scientific papers from the 2nd ACM Symposium on Spatial User Interaction (SUI׳14), which was held Oct. 4–5, 2014 in Honolulu, USA. The SUI symposium focuses on the user interface challenges that appear when users interact in the space where the flat, two-dimensional, digital world meets the volumetric, physical, three-dimensional (3D) space we live in. This considers both spatial input as well as output, with an emphasis on the issues around the interaction between humans and systems. The goal of the symposium is to provide an intensive exchange between academic and industrial researchers working in the area of SUI and to foster discussions among participants.
The symposium call for papers attracted 62 submissions from Asia, Europe, Australia, and North and South America in all areas of Spatial User Interaction research. The international program committee consisting of 19 experts in the topic areas and the two program chairs handled the highly competitive and selective review process. In the end, the program committee accepted overall 18 (11 long papers plus 7 short papers) out of 62 submissions, which corresponds to an acceptance rate of 29% in total.
The SUI׳14 award chairs, Bruce Thomas from the University of South Australia and Patrick Baudisch from the Hasso-Plattner-Institut in Germany, selected the best full and best short papers from these 18 submissions, which received the invitation to be published as extended articles in this special section:
The article "Coordinated 3D Interaction in Tablet- and HMD-Based Hybrid Virtual Environments" written by Jia Wang, Robert Lindeman proposes a novel spatial interactive solution using a coordinated, tablet- and HMD-based, hybrid virtual environment system.
The article "Principles, Interactions and Devices for Real-World Immersive Modeling" co-authored by Mark Mine, Arun Yoganandan, and Dane Coffey presents an approach that combines the natural and intuitive power of virtual reality interaction, the precision and control of 2D touch surfaces, and the richness of a commercial modeling package.
The article "VideoHandles: Searching through Action Camera Videos by Replicating Hand Gestures" by Jarrod Knibbe, Sue Ann Seah, and Mike Fraser introduces a detailed exploration of VideoHandles, a novel interaction technique to support rapid review of wearable video camera data by re-performing gestures as a search query.},
keywords = {3D user interfaces, virtual reality},
}
@proceedings{steinicke2014suiproceedings,
title = {2nd Symposium on Spatial User Interaction 2014},
author = {Steinicke, Frank and Stuerzlinger, Wolfgang and Suma, Evan},
publisher = {ACM},
series = {SUI '14},
year = {2014},
month = {Oct},
doi = {https://doi.org/10.1145/2659766},
teaser = {teasers/SUI2014.png},
abstract = {It is our great pleasure to welcome you to the second ACM Symposium on Spatial User Interaction - SUI'14. This event focuses on the user interface challenges that appear when users interact in the space where the flat, two-dimensional, digital world meets the volumetric, physical, threedimensional (3D) space we live in. This considers both spatial input as well as output, with an emphasis on the issues around the interaction between humans and systems. The goal of the symposium is to provide an intensive exchange between academic and industrial researchers working in the area of SUI and to foster discussions among participants. The SUI symposium was held October 4-5, 2014, in Honolulu, USA.
The call for papers attracted 62 submissions from Asia, Europe, Australia, and North and South America in all areas of Spatial User Interaction research. The international program committee consisting of 19 experts in the topic areas and the three program chairs handled the highly competitive and selective review process. Every submission received at least four detailed reviews, two from members of the international program committee and two or more from external reviewers. The reviewing process was double-blind, where only the program chairs as well as the program committee member, who was assigned to each paper to identify external reviewers, knew the identity of the authors. In the end, the program committee accepted overall 18 (11 long papers plus 7 short papers) out of 62 submissions, which corresponds to an acceptance rate of 29% in total. Additionally, 25 posters complement the program and appear in the proceedings. Furthermore, several demos were presented at the symposium. The topics range from spatial interaction techniques, gestures, vision in 3D space, spatial applications, to interaction with multi-touch technologies and spatial interaction in augmented reality. We hope that these proceedings will serve as a valuable reference for Spatial User Interaction researchers and developers.},
keywords = {3D user interfaces, virtual reality},
}
@proceedings{daiber2013isis3dproceedings,
title = {Interactive Surfaces for Interaction with Stereoscopic {3D}: Tutorial and Workshop at {ITS} 2013},
author = {Daiber, Florian and de Araujo, Bruno Rodrigues and Steinicke, Frank and Stuerzlinger, Wolfgang},
booktitle = {Conference on Interactive Tabletops and Surfaces},
publisher = {ACM},
series = {ISIS3D '13},
year = {2013},
month = {Oct},
pages = {483–486},
doi = {https://doi.org/10.1145/2512349.2512351},
abstract = {With the increasing distribution of multi-touch capable devices multi-touch interaction becomes more and more ubiquitous. Multi-touch interaction offers new ways to deal with 3D data allowing a high degree of freedom (DOF) without instrumenting the user. Due to the advances in 3D technologies, designing for 3D interaction is now more relevant than ever. With more powerful engines and high resolution screens also mobile devices can run advanced 3D graphics, 3D UIs are emerging beyond the game industry, and recently, first prototypes as well as commercial systems bringing (auto-) stereoscopic display on touch-sensitive surfaces have been proposed. With the Tutorial and Workshop on ``Interactive Surfaces for Interaction with Stereoscopic 3D (ISIS3D)'' we aim to provide an interactive forum that focuses on the challenges that appear when the flat digital world of surface computing meets the curved, physical, 3D space we live in.},
keywords = {3D user interfaces, virtual reality},
}
@proceedings{stuerzlinger2013suiproceedings,
title = {1st Symposium on Spatial User Interaction 2013},
author = {Stuerzlinger, Wolfgang and Steinicke, Frank},
publisher = {ACM},
series = {SUI '13},
year = {2013},
month = {Jul},
doi = {https://doi.org/10.1145/2491367},
teaser = {teasers/SUI2013.png},
abstract = {It is our great pleasure to welcome you to the first ACM Symposium on Spatial User Interaction - SUI'13. This new event focuses on the user interface challenges that appear when users interact in the space where the flat, twodimensional, digital world meets the volumetric, physical, three-dimensional (3D) space we live in. This considers both spatial input as well as output, with an emphasis on the issues around the interaction between humans and systems. The goal of the symposium is to provide an intensive exchange between academic and industrial researchers working in the area of SUI and to foster discussions among participants. The first SUI symposium was held July 20-21, 2013 in Los Angeles, USA.
The call for papers attracted 31 submissions from Asia, Europe, Australia, and North and South America in all areas of Spatial User Interaction research. The international program committee consisting of 15 experts in the topic areas and the two program chairs handled the highly competitive and selective review process. Every submission received at least four detailed reviews, two from members of the international program committee and two or more from external reviewers. The reviewing process was double-blind, where only the program chairs as well as the program committee member, who was assigned to each paper to identify external reviewers, knew the identity of the authors.
In the end, the program committee accepted overall 12 (8 full papers plus 4 short papers) out of 31 submissions, which corresponds to an acceptance rate of 26% for full papers (and 38% in total). Additionally 12 posters and demonstrations will complement the program and appear in the proceedings. The topics range from spatial interaction techniques, vision in 3D space, applications, to interaction with multi-touch technologies and in augmented reality. We hope that these proceedings will serve as a valuable reference for Spatial User Interaction researchers and developers.
Putting together the content for SUI'13 was a team effort. We first thank the authors for providing the content of the program. Special thanks go to the members of the international program committee, who successfully dealt with the reviewing load. We also thank the external reviewers.},
keywords = {3D user interfaces, virtual reality},
}
@proceedings{stuerzlinger2012vrstproceedings,
title = {Symposium on Virtual Reality Software and Technology 2012},
author = {Stuerzlinger, Wolfgang and Latoschik, Marc Erich and Kapralos, Bill},
publisher = {ACM},
series = {VRST '12},
year = {2012},
month = {Dec},
doi = {https://doi.org/10.1145/2407336},
teaser = {teasers/VRST2012.png},
abstract = {It is our great pleasure to welcome you to the 2012 ACM Symposium on Virtual Reality Software and Technology - VRST'12. VRST has become one of the major scientific events in the area of virtual reality since its debut in 1994 in Singapore. The symposium continues its tradition as an international forum for the presentation of research results and experience reports on leading edge issues of software, hardware and systems for Virtual Reality. The mission of the symposium is to share novel technologies that fulfill the needs of Virtual Reality applications and environments and to identify new directions for future research and development. VRST gives researchers and practitioners a unique opportunity to share their perspectives with others interested in the various aspects of Virtual Reality and owes its existence to a vibrant and productive research community. This year, VRST was held December 10-12, 2012 in Toronto, Ontario, Canada.
The call for papers attracted 88 submissions from Asia, Europe, Australia, and North and South America in all areas of Virtual Reality research. Particular attention was given to work on system with a special track focusing on architectures, frameworks, reusability, adaptivity, and performance testing and evaluation. An international program committee consisting of 16 experts in the topic areas and the three program chairs handled the highly competitive and selective review process. Almost every submission received four or more reviews, two from members of the international program committee and two from external reviewers. Reviewing was double-blind, where only the program chairs and the program committee member assigned to identify external reviewers knew the identity of the authors.
In the end, the program committee was able to accept 25 out of 88 submissions, which corresponds to an acceptance rate of 28%. For posters, 15 out of 32 submissions will appear in the proceedings. The topics range from tracking, augmented and mixed reality, interaction, navigation and locomotion, collaboration, haptics, simulation, agents and behaviors to two sessions for a systems track. We hope that these proceedings will serve as a valuable reference for Virtual Reality researchers and developers.},
keywords = {virtual reality, 3D user interfaces},
}
@article{bowman2009special,
title = {Special Issue on Current Trends in {3D} User Interface Research},
author = {Bowman, Doug and Fröhlich, Bernd and Kitamura, Yoshifumi and Stuerzlinger, Wolfgang},
journal = {Int. Journal of Human-Computer Studies},
publisher = {Elsevier},
series = {IJHCS},
year = {2009},
month = {Mar},
volume = {67},
number = {3},
pages = {223-224},
doi = {https://doi.org/10.1016/j.ijhcs.2008.10.003},
abstract = {Hardware, software, and in particular users now seem ready to engage with computer-generated 3D worlds and the appropriate 3D user interfaces (3D UIs) for interacting with such worlds. 3D UIs have traditionally only been used in very specific application domains such as virtual reality (VR) and augmented reality (AR) environments, digital content creation (DCC) systems, computer-aided design (CAD) systems, visualization systems, and computer games. Now they are beginning to appear in operating systems, on personal digital assistants (PDAs) and mobile phones, and in console gaming systems (e.g., Nintendo's Wii). Even 3D cinema has been given a second chance, and stereoscopic versions of movies are produced on a regular basis. Consequently, new television systems are being equipped with 3D functionality. These examples show that the demand for and the use of 3D UIs is significantly increasing.
The IEEE Symposium on 3D User Interfaces (3DUI) was established in 2006 following two successful workshops—the 2004 workshop "Beyond Wand and Glove Based Interaction" and the 2005 workshop "New Directions in 3D User Interfaces." Today, the 3DUI symposium is the premier conference for all types of 3D user interface research for desktop and off-the-desktop environments, including novel input device designs, interaction techniques, evaluation methods, and user studies.
In this special issue of IJHCS, we are pleased to present extended versions of three outstanding papers that were originally presented at the 3DUI 2007 and 3DUI 2008. An additional paper resulting from an open call was also accepted to this special issue.
The first paper, by Hachet et al. (2009), describes a set of widgets that provide a comprehensive solution for point of interest (POI) navigation in 3D environments. It allows users to quickly navigate to a particular view, explore a 3D scene, or investigate a single object in detail, and it can be used on a variety of display devices. These basic concepts are also extended to other uses beyond navigation alone.
The work by Vanacken et al. (2009) presents two new 3D selection techniques, 3D Bubble Cursor and Depth Ray. Both are targeted at selection in dense and occluded 3D virtual environments. The user studies vary both environment density and target visibility to evaluate the new techniques against a standard 3D point cursor. The effect of auditory and haptic feedback on the selection process is also investigated in a study. The results show that the new techniques enable efficient selection of hidden objects.
The paper by Pusch et al. (2009) presents a new method for providing a pseudo-haptic sensation in an augmented reality setting. The central idea is to displace the virtual representation of the hand from the actual position of the real hand depending on the strength of a virtual flow field. When a user places the hand in a virtual flow field and tries to maintain the hand's position at a cued location, a flow pressure-like sensation is perceived. Experimental results show that different force field strength levels can be discriminated.
Finally, Sharlin et al. (2009) present a novel system and a set of measures for assessing cognitive mapping abilities in the context of a wayfinding task. The hardware setup consists of a projection display for the presentation of virtual environments and a tangible tabletop interface for building a physical model of a seen environment. The cognitive mapping abilities of the users are assessed by recording and analyzing the building progress of the physical model. Since this setup has proven to be sensitive to factors affecting cognitive mapping it allows the computer-supported assessment of this important human ability.
All of these papers contain high-quality contributions to the growing field of 3D user interfaces. We thank the authors for their stimulating work and the reviewers for their constructive and detailed comments.},
keywords = {3D user interfaces, virtual reality},
}
@comment{c, c={leave the "_stuerzlinger" in the ID to enable umlaut-free search!}}
@proceedings{coquillart_stuerzlinger20083duiproceedings,
title = {Symposium on {3D} User Interfaces 2008},
author = {Coquillart, Sabine and Stürzlinger, Wolfgang and Kiyokawa, Kiyoshi},
publisher = {IEEE},
series = {3DUI '08},
year = {2008},
month = {Mar},
doi = {https://doi.org/10.1109/3DUI.2008.4476581},
teaser = {teasers/3DUI2008.png},
abstract = {Welcome to the IEEE Symposium on 3D User Interfaces 2008 (3DUI 2008), organized in Reno, Nevada on March 8-9, 2008. The symposium is co-located with IEEE Virtual Reality 2008 and with the symposium on Haptic Interfaces. 3DUI 2008 is the third international symposium focused on the topic of 3D UIs. It builds on successful 3DUI workshops in 2004 and 2005, as well as the IEEE 3DUI Symposiums in 2006 and 2007. Although a recent area of research, 3DUI is already a very well established topic and rapidely expanding. The submissions covered a variety of approaches ranging from handheld devices, desktop solutions, gesture, sound, haptics, augmented/mixed reality, to immersive systems.
This year, the program co-chairs received 67 submissions (45 papers and 22 technotes) in all areas of three-dimensional user interfaces. Each paper or technote was reviewed by at least two reviewers from the international program committee and two external reviewers. The review summary written by the primary reviewer provided the basis for a discussion among the reviewers when necessary. Reviewing was double-blind, i.e. the identity of the authors was known only to the program chairs and the program committee members responsible for choosing external reviewers for the submission. The acceptance rate was very selective at 28 % (31 % for papers and 23 % for technotes), and only 19 submissions were accepted (14 papers and 5 technotes). In addition, this year the proceedings also include 2 pages presentations for each of the 18 posters presented during the symposium.
We wish to thank all the persons who made 3DUI 2008 possible. Special thanks go to the program committee members and the reviewers for their insightful and thorough reviews of the submitted papers in a very short review period. We want to thank the posters chairs Raimund Dachselt, Robert Lindeman and Kouichi Matsuda who did handled the hard job of managing the posters. We also acknowledge the support by IEEE, the IEEE Visualization and Graphics Technical Committee as well as the VR steering committee. Most of the organization of IEEE 3DUI as well as local arrangement is shared with IEEE VR. We are grateful to Bill Sherman and the IEEE VR organizing committee for taking care of the organization of IEEE 3DUI 2008. Many thanks to James Stewart of Precision Conference Systems for his support of the reviewing process. Thanks also to Torsten Möllen and especially Meghan Haley for managing the printing process. Finally, we thank all the authors for their excellent submissions, without which this symposium could not exist.
We hope that this symposium will continue to connect researchers of all backgrounds in 3D user interface research and be enjoyable, interesting and stimulating for the participants. Please enjoy the 2008 3DUI Symposium !},
keywords = {3D user interfaces, virtual reality},
}
@proceedings{stuerzlinger20073duiproceedings,
title = {Symposium on {3D} User Interfaces 2007},
author = {Stürzlinger, Wolfgang and Kitamura, Yoshifumi and Coquillart, Sabine},
publisher = {IEEE},
series = {3DUI '07},
year = {2007},
month = {Mar},
doi = {https://doi.org/10.1109/3DUI.2007.340764},
teaser = {teasers/3DUI2007.png},
abstract = {Welcome to the IEEE Symposium on 3D User Interfaces 2007 (3DUI 2007), which took place in Charlotte, North Carolina on March 10-11, 2007. The symposium was held just before IEEE Virtual Reality 2007. The event owes its existence to a vibrant and productive research community in 3D user interfaces. This area has emerged from many different disciplines, including virtual reality, mixed and augmented reality, human-computer interaction, computer graphics, cognitive and perceptual psychology, and 3D games. 3DUI 2007 is sponsored by the IEEE Visualization and Graphics Technical Committee and is the second symposium in this series and follows two successful IEEE VR workshops on this topic in 2004 and 2005 as well as 3DUI 2006.
The program co-chairs received 81 submissions in all areas of three-dimensional user interfaces. The review process was highly competitive and selective. This year, we changed the review process and involved an international program committee consisting of 18 experts in 3D user interfaces. Each submission received at least 4 reviews, two of which were from members of the international program committee and two from external reviewers. Reviewing was double-blind this year, and the identity of the authors was known only to the program chairs and the program committee member responsible for choosing external reviewers for the submission. The program committee members were often able to solicit reviews from some of the top experts in a particular area of research. In the end, we were able to accept 18 full papers and 7 technotes (short papers), which corresponds to an acceptance rate of 31%. The accepted papers cover a wide range of topics in 3D user interfaces, including navigation, 3D movement, 3D selection, devices, gestures, mixed & augmented reality, force-feedback interfaces, and entertainment. We would like to thank all people who made 3DUI 2007 possible. Special thanks go to the program committee members who donated their time to ensure a fair selection process. Additional thanks go to the external reviewers who participated in the review process. We also acknowledge the support by IEEE, the IEEE Visualization and Graphics Technical Committee as well as the VR steering committee for support. Finally, we would like to thank Raimund Dachselt for handling the posters. Particular thanks go to IEEE VR's general chairs, especially Doug Bowman, for their great help with the organization of this event as well as the IEEE VR local arrangement chairs and other people involved in the local organization. Many thanks to James Stewart of Precision Conference Systems for his support of the reviewing process. Thanks also to Torsten Möller and especially Meghan Haley for creating the proceedings. Finally, we thank all the authors and researchers who submitted their work to the symposium.
We believe that 3DUI 2007 connects researchers of all backgrounds in 3D user interface research and collects and disseminates the best results in this area. Enjoy the symposium!},
keywords = {3D user interfaces, virtual reality},
}
@comment{c, c={leave the "_stuerzlinger" in the ID to enable umlaut-free search!}}
@proceedings{kitamura_stuerzlinger20063duiproceedings,
title = {Symposium on {3D} User Interfaces 2006},
author = {Kitamura, Yoshifumi and Bowman, Doug and Fröhlich, Bernd and Stürzlinger, Wolfgang},
publisher = {IEEE},
series = {3DUI '06},
year = {2006},
month = {Mar},
url = {https://ieeexplore.ieee.org/servlet/opac?punumber=10952},
teaser = {teasers/3DUI2006.png},
abstract = {We are extremely pleased and honored to present the proceedings of the First IEEE Symposium on 3D User Interfaces.
3DUI 2006 owes its existence to a vibrant and productive research community. Emerging from many different disciplines, such as virtual reality, mixed reality, computer graphics, human-computer interaction, and cognitive and perceptual psychology, 3D interaction has now become a coherent research area itself. Extremely successful workshops on this topic at IEEE Virtual Reality in 2004 and 2005 convinced us and the IEEE Visualization and Graphics Technical Committee that the time was right to give the 3D user interface community its own specialized venue. Our vision for the symposium is to connect researchers of all backgrounds working on 3D user interface issues, and to collect and disseminate the best 3D interaction research in the world.
Although this is the very first 3DUI symposium, the review of papers was highly competitive and selective. The program includes 18 full papers and 8 technotes (short papers), selected from 81 submissions (a 32% acceptance rate overall). The accepted papers cover a wide range of topics in 3D user interface, including navigation, applications and implementation, collaborative and bimanual interfaces, 3D interaction techniques, augmented reality and devices.
Dr. Ravin Balakrishnan of the University of Toronto will provide the keynote address for the Symposium. Dr. Balakrishnan is well-known for his research on effective and powerful 3D interaction techniques for emerging technologies such as volumetric displays and wall-sized displays. He is also a leader in the international human-computer interaction community. Dr. Balakrishnan's presentation will challenge researchers in 3D user interfaces to think more deeply about the application of their work to real-word problems.
We would like to thank all of the people who made this first-ever 3DUI Symposium possible. First, a big thank you to all of the dedicated reviewers who participated in the peer review process - your service helped to ensure the high quality of this technical program. Thanks are due to Simon Julier and Jim Chen, general chairs of IEEE VR 2006, who helped us make the transition from workshop to symposium smoothly and easily. We also thank the IEEE, the VGTC, and the VR steering committee for their support, as well as James Steward of Precision Conference Systems. Finally we thank all of the authors and researchers who submitted their work to the Symposium.
We trust that 3DUI 2006 will be the first in a long line of successful and influential events. Enjoy the Symposium!},
keywords = {3D user interfaces, virtual reality},
}
@comment{c, c={leave the "_stuerzlinger" in the ID to enable umlaut-free search!}}
@proceedings{bowman_stuerzlinger2005newdirections,
title = {New Directions in {3D} User Interfaces},
author = {Bowman, Doug and Fröhlich, Bernd and Kitamura, Yoshifumi and Stürzlinger, Wolfgang},
publisher = {Shaker Verlag},
year = {2005},
month = {Mar},
url = {https://www.shaker.de/de/content/catalogue/index.asp?lang=en&ID=8&ISBN=978-3-8322-3830-8},
pdf = {papers/3dui_workshop.pdf},
teaser = {teasers/3dui_workshop.png},
abstract = {This workshop focuses on novel research in three-dimensional user interfaces (3D UIs). The workshop builds on and expands the scope of last year's workshop "Beyond Wand and Glove Based Interaction." The theme of the workshop will again be on moving beyond the "common" and "traditional" (if one can use those words with respect to such a young research area) approaches to 3D UIs.
Just as wands, 3D mice, and gloves became traditional input devices for 3D UIs, a handful of well-known interaction techniques and UI metaphors also became de facto standards (often because they were the default interaction techniques in widely-used software toolkits). Most of these basic techniques, however, have been around for 5-10 years. Although this could certainly change, it seems that the discovery of radical new metaphors for the "universal 3D tasks" (navigation, selection, manipulation, system control) has slowed down significantly. This does not mean, however, that we should stop doing research on interaction techniques for these tasks. Rather, it means we have to improve the existing metaphors in subtle ways, experiment with the use of new devices, and consider the use of such techniques in specific domains or by specific types of users. Recent research has shown that there is still much to be learned in this area, and that current techniques can be enhanced to dramatically improve usability .
In this workshop, we will spotlight research that investigates novel and enhanced methods of 3D interaction for immersive virtual environments (VEs), augmented and mixed reality (AR/MR), and desktop 3D systems. Relevant topics include: 3D input devices, 3D display devices, 3D interaction techniques, 3D user interface metaphors, collaborative 3D interaction, evaluation methods for 3D UIs, application of existing devices/techniques in novel contexts (e.g. to AR, UbiComp, etc., migration of existing techniques to new display platforms.},
keywords = {3D user interfaces, virtual reality},
}
@book{stuerzlinger2003practical,
title = {Practical Programming in the Unix Environment},
author = {Stürzlinger, Wolfgang},
publisher = {Pearson Custom},
year = {2003},
month = {Jan},
teaser = {teasers/practicalprogramming.png},
abstract = {Today, software bugs are clearly a constant source of frustration with computers and also pose considerable security and safety concerns. While methods exist to prove the correctness of programs, they are not fully automatic and all requires significant training. Consequently, there is no real alternative to careful and systematic testing of programs to ensure that the software fulfills its designated function (even though testing cannot guarantee the absence of bugs). A further indication of the importance of this topic is that all accepted software development practices, such as Extreme Programming, require that programmers test their systems. While testing is taught abstractly in many courses, few students realized how important thorough testing is in practice. Only in the field do they gain this experience and learn the related skills. Hand in hand with testing goes debugging, the art of finding a problem based on observable symptoms and then fixing the problem. Last, but not least, optimization of programs is a skill that is often necessary for competitive systems.
When faced with the task of helping to re-design a second-year course on practical programming, I decided that C and UNIX were the right platform to teach many of the skills necessary for practical program development. Today, many students learn Java (or similar languages) in their first year, as this provides a relatively good and safe environment for learning the fundamental concepts. However, computer science students need to know how the layers underneath a high-level programming language work. C, besides being a high-performance environment and a prerequisite to C++, exposes students to these underlying layers and hence allows them to get a better understanding of how software works. Furthermore, a lot of safety layers (e.g., automatic handling of arithmetic overflows) are not present here, which makes this an ideal vehicle to teach the importance of testing. UNIX, with its cleverly designed file system, interactive shell and scripting languages, provides an excellent environment for systematic and repeated testing. The current implementation of the course teaches the importance of testing via strict enforcement of adherence to specifications in assignments. This is done with automatic, and hence objective, testing of assignments. As the test cases are revealed only after the deadline, this forces students to think very carefully about the robustness of their programs.
This textbook is designed to be used together with "The C Programming Language" by Kernighan & Ritchie. One of the most frustrating aspects of designing a course on practical programing is that there are very few textbooks that cover important skills, such as testing, debugging, optimization, the use of scripting languages, etc. with adequate examples. Fortunately, I found that parts of a book on the UNIX environment ("The UNIX Programming Environment" by Kernighan & Pike) and parts of a book on the practice of programming ("The Practice of Programming" by Kernighan & Pike) provide a good combination. Together, the new book covers most important issues for practical program development and hence forms a good basis for a course that focuses on such issues.
It is my hope that this book will help instructors to communicate practical programming skills as well as help students to develop better software.},
keywords = {programming},
}
@comment{c, c={leave the "_stuerzlinger" in the ID to enable umlaut-free search!}}
@article{heidrich_stuerzlinger2002special,
title = {Special Issue on Hardware-Accelerated Rendering Techniques},
author = {Heidrich, Wolfgang and Stürzlinger, Wolfgang},
journal = {Journal of Graphics Tools},
series = {JGT},
year = {2002},
month = {Dec},
volume = {7},
number = {4},
pages = {1-1},
doi = {https://doi.org/10.1080/10867651.2002.10487565},
teaser = {teasers/jgt4-2002.png},
abstract = {Real-time rendering systems are approaching a level of quality and economy that surpasses even the most elaborate offline rendering system available only ten years ago. As a consequence, hardware-accelerated rendering has had a strong impact on applications such as computer games, modeling and animation, design, and scientific visualization.
The aim of this special issue of the journal of graphics tools is to provide an overview of the state-of-the-art application of graphics hardware to problems in rendering, modeling, visualization, and other areas. One of the challenges in this area is to transform traditional algorithms into a form that adapts to the restrictions dictated by graphics hardware and takes advantage of its specific processing capabilities. These constraints often mandate significant changes or simplifications to the original algorithms, and sometimes lead to the development of new methods. Often it is possible to take a solution developed for solving a particular problem with the help of graphics hardware and to apply the ideas behind it to a completely different problem. This transfer of ideas is one of the motivations behind this special issue, which brings together work from a variety of application domains.
We received 33 submissions for this special issue, illustrating the recent interest in hardware-assisted techniques. From this, we selected 11 papers to be presented here. These represent a cross section of the different application areas for hardware-accelerated rendering. From realistic illumination algorithms to shadowing, from image-based rendering to non-photorealistic rendering, from digital imaging to digital halftoning, and from geometric modeling to collision detection, the papers in this special issue demonstrate the state-of-the art in hardware-assisted techniques. We hope you will enjoy these contributions as much as we did.},
keywords = {rendering, real-time},
}
@proceedings{stuerzlinger2002giproceedings,
title = {Graphics Interface 2002},
author = {Stürzlinger, Wolfgang and {McCool}, Mike},
publisher = {CHCCS and AK Peters},
series = {GI '02},
year = {2002},
month = {May},
url = {https://graphicsinterface.org/proceedings/gi2002},
teaser = {teasers/GI2002.png},
abstract = {Welcome to Graphics Interface (GI) 2002, a conference that combines coverage of original research results in both Human-Computer Interaction and Graphics. The conference took place in Calgary, Alberta, over 27-29 May 2002, and was held in conjunction with the Artificial Intelligence 2002 and Vision Interface 2002 conferences. GI 2002 is the 28th instance of the longest running conference series in human-computer interaction and computer graphics. This event has previously been held two times in Calgary: in 1977 and in 1991.
The program co-chairs received 96 submissions in all areas of human-computer interaction and computer graphics. The large number of submissions was a pleasant surprise; however, the number of submissions also necessitated an enlargement of the program committee on short notice. We are very grateful to all the additional program committee members who agreed to take time out of their busy schedules late in 2001. By agreeing to serve, these additional members reduced the workload on other committee members and permitted us to maintain our high reviewing standards.
The overall quality of the submissions was very high, which made the selection process difficult. After considerable deliberation, the program committee selected 25 papers for publication. The international program committee consisted of 20 people from around the world. Each paper received at least 4 reviews, two of which were from members of the program committee. The reviewing process was double-blind, and the identity of the authors was known only to program co-chairs and the program committee member responsible for choosing external reviewers for each submission. The program committee members were often able to solicit reviews from some of the topmost experts in a particular area of research. We greatly appreciate the effort of the members of the program committee. We would like to extend additional thanks to the 13 members of the program committee who attended the meeting at York University, Toronto, Canada on 16 February 2002 and funded their own travel.
Graphics Interface customarily has several invited speakers. This year three invited speakers were: Saul Greenberg, Professor at the University of Calgary; John Buchanan, Electronic Arts Canada and Adjunct Professor at the University of Alberta; and David Kirk, Chief Scientist at NVIDIA. We extend our gratitude to them for sharing their inspiration in their respective fields.
We would like to thanks James Stewart for his work on the PCS electronic submission and reviewing system. His help behind the scenes made our job a lot easier! We would also like to thank Pierre Poulin and Kelly Booth for handling the liaison with AI and VI conference organizers, and Kelly Booth again for additional valuable advice. We thank further all referees for their voluntary work, Ravin Balakrishnan for handling the posters, Sara Diamond for organizing the video show, and Fred Peet, treasurer of the Canadian Human-Computer Communication Society, for keeping the finances straight, and Graphics Services at the University of Waterloo for doing such an excellent job on the proceedings. Last but not least, we send a very big thanks to Camille Sinanan, Sheelagh Carpendale, Mario Costa-Sousa, and Joerg Denzinger for the local organization of the joint conferences at the University of Calgary. Without their work, this conference would simply not have been possible.
For further information about the conference series we invite you to visit our web site: http://www.graphicsinterface.org/},
keywords = {human-computer interaction, HCI, computer graphics},
}
@proceedings{stuerzlinger2002egveproceedings,
title = {Eurographics Workshop on Virtual Environments 2002},
author = {Stürzlinger, Wolfgang and Müller, Stefan},
publisher = {ACM SIGGRAPH},
series = {EGVE '02},
year = {2002},
month = {May},
url = {https://dl.acm.org/doi/proceedings/10.5555/509709},
teaser = {teasers/EGVE2002.png},
abstract = {This book contains the proceedings of the Eighth EUROGRAPHICS Workshop on Virtual Environments. The event was held in Barcelona from May 30 to May 31, 2002. The workshop brought together scientists, developers, and users from all over the world to present and discuss the latest scientific advances in the field of Virtual Environments. 60 papers were submitted for reviewing and 22 were selected to be presented at the workshop. Most of the top research institutions working in the area submitted papers and presented their latest results. The presentations were complemented by two keynote talks from Marc Mine (Walt Disney Imagineering - VR Studio) and Eric Badiqué (European Commission - IST program). The research presented at this workshop can be classified into the following aspects of Virtual Environments (VEs): Input and Output Devices, Interaction and Navigation, Evaluation, Collaboration, Systems, and Applications. Devices focus mainly on hardware issues to interface with a simulation, whereas Interaction and Navigation techniques investigate how the raw input is best interpreted so that the user can easily achieve his/her goals. Evaluations provide data about the usability of Virtual Environments, and the importance of objective and reproducible studies can only be stressed. Virtual Environments are often used to communicate and to co-operate and this focus is evident in the research on Collaboration. The area of Systems discusses the various tradeoffs in building complete solutions and last, but not least, applications report on the transfer of research results into the real world. However, the reader should note that many contributions cross these boundaries, which reflects the multidisciplinary nature of Virtual Environments.},
keywords = {virtual reality},
}
@proceedings{stuerzlinger2000giposterproceedings,
title = {Poster Proceedings Graphics Interface 2000},
author = {Stürzlinger, Wolfgang},
series = {GI '00},
year = {2000},
month = {May},
teaser = {teasers/GIposter2000.png},
abstract = {After the success of last year, I am happy to report that Graphics Interface was again able to attract a large number of posters. This year a significant part of the submissions is from all over the world, which underlines the international aspect of the conference. Furthermore, the topics nicely cover the range of research areas that are the focus of the conference: Graphics and Human-Computer Interaction.
Posters are an excellent medium for communicating new and emerging ideas. For many first-time authors it also enables them to meet future colleagues. I encourage all conference participants to go to the poster session and meet the authors in person. Please chat with the students and provide them with feedback!},
keywords = {human-computer interaction, HCI, computer graphics},
}
@comment{************************journal_articles************************}
@comment{c, c={not sure if this is best article or proceedings}}
@comment{barrera2027dagstuhl,
title = {Sketching Beyond 2D in Extended Reality (Dagstuhl Seminar 27022)},
author = {Barrera Machuca, Mayra Donaji and Jackson, Bret and Keefe, Daniel and Habakuk, Johann and Stuerzlinger, Wolfgang},
journal = {Dagstuhl Reports},
publisher = {Schloss Dagstuhl-Leibniz-Zentrum fuer Informatik},
commented-series = {Dagstuhl Seminar 27022},
commented-issn = {2192-5283},
year = {2027},
month = {Jun},
commented-volume = {0},
commented-number = {0},
commented-pages = {1-9},
commented-doi = {https://doi.org/10.4230/DagRep.0.0.1},
commented-pdf = {papers/dagstuhl_IA.pdf},
commented-teaser = {teasers/dagstuhl.png},
commented-abstract = {Advances in virtual, mixed, and augmented reality (VR, MR, AR) have enabled a new form of computer-mediated art expression called 3D sketching, also referred to as "3D painting", "3D drawing", or a variant of "immersive sketching", which allows artists, engineers, designers, and scientists to create 3D works in a body-centric space. One of the unique aspects of 3D sketching is that it requires a computer-based tracking system to record the artist's spatial movements, which create the digital marks, and computer graphics techniques to render these marks in space. Moreover, the resulting sketch is often displayed in this same 3D space, e.g., via the use of immersive computer displays.
This dependency on computer systems to create and display the creations makes 3D sketching a unique medium that requires the union of artists and computer scientists to develop tools that artists can then use to interact with the 3D "canvas". Thus, over the last 30 years, the computing research and digital arts communities have collaborated to study and exhibit 3D sketching techniques, applications, and artifacts.
This Dagstuhl Seminar invites participants to broaden these collaborations by combining computer scientists, cognitive scientists, artists, engineers, and practitioners from both academia and industry.
The seminar will provide the unique opportunity to foster intellectual exchange on three general themes: (1) Technology: the design and implementation of novel user interfaces and hardware that address the needs of artists and other practitioners, (2) Theory: understanding the role of spatial perception and cognition in the act of sketching, and (3) Creative Practice and Education: identifying novel ways to train the next generation of 3D sketching artists. The seminar’s goals include:
- Coalescing an international community of creative practitioners, educators, and researchers working with 3D drawing, including establishing a new online presence at http://3ddrawing.org/
- Mapping and disseminating a future research agenda for 3D sketching, including a position paper and tutorials at top conferences like IEEE VR and ACM CHI.
- Making work with 3D drawing more visible to the public by contributing, exhibiting, and supporting emerging venues for exhibiting 3D drawings in places like ARSElectronica, SIGGRAPH Art Show or the IEEE XR Gallery.
- Describing training and education methods for 3D sketching, including identifying best practices that artists and schools can apply.
By fulfilling these goals, this seminar aims to guide our ability to teach and use 3D sketching tools.},
commented-keywords = {},
}
@article{li2026selectrunning,
title = {Investigating 3D Selection Performance While Running in Extended Reality: an In-depth Study of the Effect of Speed},
author = {Li*, Ang and Knibbe, Jarrod and Tatsuzawa*, Kiichiro and Demartini, Gianluca and Viller, Stephen and Wallis, Guy and Stuerzlinger, Wolfgang and Cordeil, Maxime},
journal = {Transactions on Visualization and Computer Graphics},
publisher = {IEEE},
series = {TVCG},
year = {2026},
month = {Sep},
commented-volume = {32},
commented-number = {0},
numpages = {13},
commented-doi = {https://doi.org/10.1109/ISMAR0000.2026.00000},
commented-pdf = {papers/selectrunning.pdf},
commented-video = {videos/selectrunning.mp4},
commented-teaser = {teasers/selectrunning.png},
abstract = {We explore how running speed affects target selection in immersive environments. Through a Fitts' tapping task, we investigate direct touch selections while participants are standing or running (at speeds up to 9 km/h). We conduct a multifaceted controlled study (n=22) to understand the effect of speed, pointing phase, and foot-strike on selection performance. We find that speed dramatically increases movement time, error rate, perceived exertion, and task load. The increased movement time is driven by the correction phase, which doubles in duration at 9 km/h, while the ballistic phase remains stable. Our exploratory analysis further reveals that a higher cadence reduces the error rate at lower speeds (4.5 km/h), while this effect disappears at higher speeds (9 km/h), as participants' motor control in target selection is significantly disrupted by the movement oscillations. As the selection error rate quickly exceeds 30% when speed increases, even with accurate, fast external tracking, we argue that direct touch interaction is likely inappropriate for running. Further efforts are needed to facilitate selection interaction at higher running speeds.},
keywords = {3D pointing, running, jogging},
note = {To appear},
}
@article{rasoulifar2026dynamicvac,
title = {Dynamic Vergence–Accommodation Conflict: Effects on 3D Selection Performance When Target Depth Changes},
author = {Rasoulifar+, Zahra and Turkmen*, Rumeysa and Barrera Machuca, Mayra D. and Stuerzlinger, Wolfgang and Batmaz, Anil Ufuk},
journal = {Transactions on Visualization and Computer Graphics},
publisher = {IEEE},
series = {TVCG},
year = {2026},
month = {Oct},
commented-volume = {32},
commented-number = {11},
numpages = {11},
commented-doi = {https://doi.org/10.1109/ISMAR0000.2026.00000},
commented-pdf = {papers/dynamicvac.pdf},
commented-video = {videos/dynamicvac.mp4},
commented-teaser = {teasers/dynamicvac.png},
abstract = {The effect of the Vergence--Accommodation Conflict (VAC) in state-of-the-art head-mounted displays on 3D interaction performance is well-studied in scenarios where targets remain stationary at a fixed depth. Yet, many VR applications include targets moving continuously toward or away from the user, causing vergence demand to change over time while accommodation remains fixed at the display focal plane. We study this scenario using an ISO 9241-411 multidirectional target selection task with: \emph{No VAC} (targets at the display focal plane), \emph{Constant VAC} (targets further from the focal plane), \emph{Varying VAC} (targets appear at both No VAC and Constant VAC depths across selections), and \emph{Dynamic VAC} (target depth changes continuously during acquisition) conditions. In a within-subjects study with 24 participants, Dynamic VAC produced slower selections, higher error rates, lower accuracy, and reduced throughput compared with the No VAC condition. To account for target movements in depth, we propose an extension of Fitts’ law that models the additional performance costs introduced by continuously changing vergence demand. Our results provide guidance for modeling and designing interaction techniques in depth-varying 3D environments.},
keywords = {3D pointing},
note = {ISMAR '26, conditionally accepted, to appear},
}
@article{jeong2026throwmodel,
title = {Modeling Throwing Selection in Virtual Reality},
author = {Jeong*, Jae-Yeop and Stuerzlinger, Wolfgang and Jeong, Jin-Woo},
journal = {Transactions on Visualization and Computer Graphics},
publisher = {IEEE},
series = {TVCG},
year = {2026},
month = {Oct},
commented-volume = {32},
commented-number = {11},
numpages = {11},
commented-doi = {https://doi.org/10.1109/ISMAR0000.2026.00000},
commented-pdf = {papers/throwmodel.pdf},
commented-video = {videos/throwmodel.mp4},
commented-teaser = {teasers/throwmodel.png},
abstract = {Throwing is a natural and embodied interaction for selecting distant targets in virtual reality (VR). Unlike conventional pointing, throwing is ballistic: once released, the trajectory can no longer be corrected. Despite its practical importance, throwing-based target selection has received relatively little attention in human behavior and performance modeling, making systematic design and evaluation still difficult. In this paper, we investigate throwing-based target selection in VR and propose predictive models for its behavior and performance. Through a controlled user study manipulating target width ($W$) and movement amplitude ($A$), we measured planning time ($PT$) and endpoint distribution. Our results showed that $PT$ increased systematically with task difficulty, following a pattern similar to movement time in Fitts' law. Throwing endpoints were also generally well approximated by a bivariate Gaussian distribution, and target parameters significantly affected both endpoint bias and variability. Based on these findings, we derived a probabilistic accuracy model that predicts target acquisition performance. The proposed models showed high goodness-of-fit, and the accuracy model was robust under leave-one-condition-out cross-validation. Our findings provide a quantitative understanding of throwing-based target selection and support the design of throwing interactions in immersive environments.},
keywords = {selection, throwing},
note = {ISMAR '26, conditionally accepted, to appear},
}
@article{bashar2026vacgazeconflict,
title = {Evaluating the Vergence–Accommodation Conflict in Gaze-Based 3D Target Selection},
author = {Bashar*, Mohammad Raihanul and Amini*, Mohammadreza and Mutasim, Aunnoy K. and Barrera Machuca, Mayra D. and Stuerzlinger, Wolfgang and Batmaz, Anil Ufuk},
journal = {Transactions on Visualization and Computer Graphics},
publisher = {IEEE},
series = {TVCG},
year = {2026},
month = {Oct},
commented-volume = {32},
commented-number = {11},
numpages = {11},
commented-doi = {https://doi.org/10.1109/ISMAR0000.2026.00000},
commented-pdf = {papers/vacgazeconflict.pdf},
commented-video = {videos/vacganzeconflict.mp4},
commented-teaser = {teasers/vacgazeconflict.png},
abstract = {State-of-the-art head-mounted displays (HMDs) enable gaze-based selection in virtual environments. Yet, these HMDs suffer from the vergence–accommodation conflict (VAC), which is known to affect interaction performance. The VAC might influence gaze-based selection performance because it directly affects eye-movement behavior. Thus, in this paper, we investigate how the VAC influences \gaze-based 3D target selection across varying depth conditions. Our results show that as the (visual) depth increases, user performance significantly decreases with gaze-based selection. Moreover, a previously suggested ``\textit{Variation in Diopter}'' Fitts’ law model captured this performance change better relative to a linear model. These findings provide evidence that gaze-based pointing is negatively affected by the VAC and highlight the importance of accounting for depth-dependent factors when designing gaze-based interaction in 3D environments.},
keywords = {3D pointing, eye gaze},
note = {ISMAR '26, conditionally accepted, to appear},
}
@article{hu2025trackingaccuracysteering,
title = {Exploring and Modeling the Effects of Eye-Tracking Accuracy and Precision on Gaze-Based Steering in Virtual Environments},
author = {Hu*, Xuning and Zhang*, Yichuan and Wei*, Yushi and Zhang*, Liangyuting and Li, Yue and Stuerzlinger, Wolfgang and Liang, Hai-Ning},
journal = {Transactions on Visualization and Computer Graphics},
publisher = {IEEE},
series = {TVCG},
year = {2025},
month = {Oct},
volume = {31},
number = {11},
pages = {9559-9569},
doi = {https://doi.org/10.1109/TVCG.2025.3616824},
pdf = {papers/trackingaccuracysteering.pdf},
teaser = {teasers/trackingaccuracysteering.png},
abstract = {Recent advances in eye-tracking technology have positioned gaze as an efficient and intuitive input method for Virtual Reality (VR), offering a natural and immersive user experience. As a result, gaze input is now leveraged for fundamental interaction tasks such as selection, manipulation, crossing, and steering. Although several studies have modeled user steering performance across various path characteristics and input methods, our understanding of gaze-based steering in VR remains limited. This gap persists because the unique qualities of eye movements—involving rapid, continuous motions—and the variability in eye-tracking make findings from other input modalities nontransferable to a gaze-based context, underscoring the need for a dedicated investigation into gaze-based steering behaviors and performance. To bridge this gap, we present two user studies to explore and model gaze-based steering. In the first one, user behavior data are collected across various path characteristics and eye-tracking conditions. Based on this data, we propose four refined models that extend the classic Steering Law to predict users’ movement time in gaze-based steering tasks, explicitly incorporating the impact of tracking quality. The best-performing model achieves an adjusted R^2 of 0.956, corresponding to a 16% improvement in movement time prediction. This model also yields a substantial reduction in AIC (from 1550 to 1132) and BIC (from 1555 to 1142), highlighting improved model quality and better balance between goodness of fit and model complexity. Finally, data from a second study with varied settings, such as a different eye-tracking sampling rate, illustrate the strong robustness and predictability of our models. Finally, we present scenarios and applications that demonstrate how our models can be used to design enhanced gaze-based interactions in VR systems.},
keywords = {eye tracking, gaze steering},
award = {This work received an Honorable Mention Award},
note = {ISMAR '25},
}
@article{mostajeran2025biophilicsteering,
title = {The Effects of Biophilic Design on Steering Performance in Virtual Reality},
author = {Mostajeran, Fariba and Friedrich*, Moritz and Steinicke, Frank and Kühn, Simone and Stuerzlinger, Wolfgang},
journal = {Scientific Reports},
publisher = {Nature Portfolio},
series = {SciRep},
year = {2025},
month = {Sep},
volume = {15},
commented-number = {1},
articleno = {32485},
numpages = {12},
doi = {https://doi.org/10.1038/s41598-025-19113-4},
pdf = {papers/biophilicsteering.pdf},
teaser = {teasers/biophilicsteering.png},
abstract = {Biophilic design aims to connect people to nature by incorporating natural elements such as plants in built environments. In immersive virtual reality (VR) environments, experiments have shown that, for instance, the presence of virtual plants in VR leads to higher cognitive performance and psychological well-being. However, it has not been investigated so far whether such effects extend to the performance of spatial interaction tasks such as path steering. In this paper, we explore the effects of the presence of virtual plants in an immersive virtual office environment on path steering performance in VR. For this purpose, we combined and replicated two previous studies in this field. The results of our study did not find an effect of the presence of virtual plants on steering time, as our participants performed all steering tasks in a similar amount of time in both biophilic and non-biophilic environments. We could, however, replicate one of the original studies on path steering in VR by Liu et al. and show that the steering time in our study also follows the extension of the steering law proposed in their work. Accordingly, we found not only a significant effect of the length (p < .001, effect size: partial eta squared=.93) and width (p < .001, effect size=.96) of the steering path, but also a significant effect of the path curvature (p=.003, effect size=.64) on the time needed for steering through the path. We also found significant effects of path latitude (p < .001, effect size=.57) and longitude (p=.01, effect size=.18) on steering time. Our findings challenge the previous research, which demonstrated the positive effects of biophilic design in VR on cognitive processes, and therefore, pave the path for future work to better understand the effects of biophilic design on users’ performance in VR.},
keywords = {biophilic design, cognition, well-being},
}
@article{bashar2025depthvac,
title = {The Effect of Visual Depth on the Vergence-Accommodation Conflict on 3D Selection Performance within Virtual Reality Headsets},
author = {Bashar*, Mohammad Raihanul and Barrera Machuca, Mayra Donaji and Stuerzlinger, Wolfgang and Batmaz, Anil Ufuk},
journal = {Visual Computer},
publisher = {Springer},
commented-series = {VisComp},
year = {2025},
month = {May},
volume = {41},
commented-number = {},
pages = {9645-9661},
doi = {https://doi.org/10.1007/s00371-025-03990-x},
pdf = {papers/depthvac.pdf},
teaser = {teasers/depthvac.png},
abstract = {Prior studies have shown that the vergence-accommodation conflict (VAC) negatively affects the interaction performance in Virtual Reality (VR) and Augmented Reality (AR) systems, particularly as object depth increases. This paper examines user selection performance across six different visual depths. Through a study closely resembling prior research, eighteen participants participated in an ISO 9241:411 task with six different depth distances. We observed that with higher depth values, selection times increased while the throughput performance of the participants decreased. Based on this finding, we propose a Fitts' law model based on the focal distances, which models pointing times in VR and AR systems with substantially higher accuracy. We hope that our findings aid developers in creating 3D user interfaces for VR and AR that offer better performance and an improved user experience.},
keywords = {3D pointing, vergence-accomodation conflict},
}
@article{menin2025thematicmobility,
title = {What about thematic information? An analysis of the multidimensional visualization of individual mobility},
author = {Menin*, Aline and Quere*, Clément and Wagner*, Jorge and Chardonnel, Sonia and Davoine, Paule-Annick and Stuerzlinger, Wolfgang and Freitas, Carla Maria Dal Sasso and Nedel, Luciana and Winckler, Marco},
journal = {Visual Informatics},
publisher = {Elsevier},
commented-series = {VisInf},
year = {2025},
month = {Mar},
volume = {9},
number = {1},
pages = {99-115},
doi = {https://doi.org/10.1016/j.visinf.2025.02.002},
pdf = {papers/thematicmobility.pdf},
teaser = {teasers/thematicmobility.png},
abstract = {This paper reviews the literature on the visualization of individual mobility data, with a focus on thematic integration. It emphasizes the importance of visualization in understanding mobility patterns within a population and how it helps mobility experts to address domain-specific questions. We analyze 38 papers published between 2010 and 2024 in GIS and VIS venues that describe visualizations of multidimensional data related to individual movements in urban environments, concentrating on individual mobility rather than traffic data. Our primary aim is to report advances in interactive visualization for individual mobility analysis, particularly regarding the representation of thematic information about people’s motivations for mobility. Our findings indicate that the thematic dimension is only partially represented in the literature, despite its critical significance in transportation. This gap often stems from the challenge of identifying data sources that inherently provide this information, necessitating visualization designers and developers to navigate multiple, heterogeneous data sources. We identify the strengths and limitations of existing visualizations and suggest potential research directions for the field.},
keywords = {visual analytics, visualization, thematic information, individual mobility},
}
@article{mutasim2025gazegem,
title = {The Influence of Eye Gaze Interaction Technique Expertise and the Guided Evaluation Method on Text Entry Performance Evaluations},
author = {Mutasim*, Aunnoy K and Batmaz, Anil Ufuk and Hudhud Mughrabi*, Moaaz and Stuerzlinger, Wolfgang},
journal = {Proceedings of the ACM Human-Computer Interaction},
publisher = {ACM},
series = {PACM-HCI},
year = {2025},
month = {May},
volume = {9},
number = {3},
articleno = {ETRA17},
numpages = {19},
doi = {https://doi.org/10.1145/3725842},
pdf = {papers/gazegem.pdf},
teaser = {teasers/gazegem.png},
video = {videos/gazegem.mp4},
abstract = {Any investigation of learning unfamiliar text entry systems is affected by the need to train participants on multiple new components simultaneously, such as novel interaction techniques and layouts. The Guided Evaluation Method (GEM) addresses this challenge by bypassing the need to learn layout-specific skills for text entry. However, a gap remains as the GEM’s performance has not been assessed in situations where users are unfamiliar with the interaction technique involved, here eye-gaze-based dwell. To address this, we trained participants on only the eye-gaze-based interaction technique over eight days with QWERTY and then evaluated their performance on the OPTI layout with the GEM. Results showed that the unfamiliar OPTI layout outperformed QWERTY, with QWERTY's speed aligning with previous findings, suggesting that interaction technique expertise significantly impacts performance outcomes. Importantly, we also identified that for scenarios where the familiarity with the involved interaction technique(s) is the same, the GEM analyzes the performance of keyboard layouts effectively and quickly identifies the best option.},
keywords = {text entry, layout learning, eye tracking, gaze},
note = {ETRA '25},
}
@article{lee2025scalingtechniques,
title = {Scaling Techniques for Exocentric Navigation Interfaces in Multiscale Virtual Environments},
author = {Lee, Jong-In and Stuerzlinger, Wolfgang},
journal = {Transactions on Visualization and Computer Graphics},
publisher = {IEEE},
series = {TVCG},
year = {2025},
month = {Mar},
volume = {31},
number = {5},
pages = {2704-2714},
doi = {https://doi.org/10.1109/TVCG.2025.3549535},
pdf = {papers/scalingtechniques.pdf},
teaser = {teasers/scalingtechniques.png},
video = {videos/scalingtechniques.mp4},
abstract = {Navigating multiscale virtual environments necessitates an interaction method to travel across different levels of scale (LoS). Prior research has studied various techniques that enable users to seamlessly adjust their scale to navigate between different LoS based on specific user contexts. We introduce a scroll-based scale control method optimized for exocentric navigation, targeted at scenarios where speed and accuracy in continuous scaling are crucial. We pinpoint the challenges of scale control in settings with multiple LoS and evaluate how distinct designs of scaling techniques influence navigation performance and usability. Through a user study, we investigated two pivotal elements of a scaling technique: the input method and the scaling center. Our findings indicate that our scroll-based input method significantly reduces task completion time and error rate and enhances efficiency compared to the most frequently used bi-manual method. Moreover, we found that the choice of scaling center affects the ease of use of the scaling method, especially when paired with specific input methods.},
keywords = {3D navigation, multiscale virtual environment, 3D locomotion},
note = {VR '25},
}
@article{mutasim2024gem,
title = {The Guided Evaluation Method: An Easier Way to Empirically Estimate Trained User Performance for Unfamiliar Keyboard Layouts},
author = {Mutasim*, Aunnoy K and Batmaz, Anil Ufuk and Hudhud Mughrabi+, Moaaz and Stuerzlinger, Wolfgang},
journal = {International Journal of Human-Computer Studies},
publisher = {Elsevier},
series = {IJHCS},
year = {2024},
month = {Oct},
volume = {190},
articleno = {103317},
numpages = {19},
doi = {https://doi.org/10.1016/j.ijhcs.2024.103317},
pdf = {papers/gem.pdf},
teaser = {teasers/gem.png},
abstract = {To determine in a user study whether proposed keyboard layouts, such as OPTI, can surpass QWERTY in performance, extended training through longitudinal studies is crucial. However, addressing the challenge of creating trained users presents a logistical bottleneck. A common alternative involves having participants type the same word or phrase repeatedly. We conducted two separate studies to investigate this alternative. The findings reveal that both approaches, repeatedly typing words or phrases, have limitations in accurately estimating trained user performance. Thus, we propose the Guided Evaluation Method (GEM), a novel approach to quickly estimate trained user performance with novices. Our results reveal that in a matter of minutes, participants exhibited performance similar to an existing longitudinal study — OPTI outperforms QWERTY. As it eliminates the need for resource-intensive longitudinal studies, our new GEM thus enables much faster estimation of trained user performance. This outcome will potentially reignite research on better text entry methods.},
keywords = {text entry, touch typing, soft keyboards, layout learning},
}
@article{hoerantner2024vismet,
title = {Visual training in dry age-related macular degeneration},
author = {Hörantner, Robert and Wolfsgruber, Jürgen and Stürzlinger, Gerald and Stürzlinger, Wolfgang and Hörantner, Paul},
journal = {Spektrum der Augenheilkunde},
publisher = {Springer},
year = {2024},
month = {Aug},
volume = {39},
number = {1},
pages = {4-8},
doi = {https://doi.org/10.1007/s00717-024-00578-z},
pdf = {papers/vismet.pdf},
teaser = {teasers/vismet.png},
abstract = {Purpose: To investigate the efficacy of visual training with stimulation in patients with dry age-related macular degeneration (AMD).
Method: The Medical Eye Trainer (M.E.T.) was tested in 67 patients with dry AMD. By using the training system, the entire visual system is treated. A moving grid is displayed on a standard smartphone or tablet. The training was carried out once a day for 90 seconds over a total period of two months.
Results: The Medical Eye Trainer (M.E.T.) significantly improved visual function after two months. The results of a questionnaire, which was used after the therapy, also showed a satisfactory stabilization or improvement of the findings.
Conclusions: The M.E.T. represents an effective additional treatment option for patients with dry AMD without interfering with established treatment methods.},
keywords = {macular degeneration, dry AMD, visual training, visual perception},
note = {In German},
}
@article{rajabiseraji2024hybridaxes,
title = {Analyzing User Behaviour Patterns in a Cross-virtuality Immersive Analytics System},
author = {Rajabi Seraji*, Mohammad and Piray*, Parastoo and Zahednejad*, Vahid and Stuerzlinger, Wolfgang},
journal = {Transactions on Visualization and Computer Graphics},
publisher = {IEEE},
series = {TVCG},
year = {2024},
month = {Mar},
volume = {30},
number = {5},
pages = {2613-2623},
doi = {https://doi.org/10.1109/TVCG.2024.3372129},
pdf = {papers/hybridaxes2.pdf},
teaser = {teasers/hybridaxes2.png},
video = {videos/hybridaxes2.mp4},
abstract = {Recent work in immersive analytics suggests benefits for systems that support work across both 2D and 3D data visualizations, i.e., cross-virtuality analytics systems. Here, I introduce HybridAxes, an immersive visual analytics system that enables users to conduct their analysis either in 2D on desktop monitors or in 3D within an immersive AR environment - while enabling them to seamlessly switch and transfer their visualizations between the two modes. The results of my user study show that the cross-virtuality sub-systems in HybridAxes complement each other well in helping the users in their data-understanding journey. I show that users preferred using the AR component for exploring the data, while they used the desktop component to work on more detail-intensive tasks. Despite encountering some minor challenges in switching between the two virtuality modes, users consistently rated the whole system as highly engaging, user-friendly, and helpful in streamlining their analytics processes. Finally, I present suggestions for designers of cross-virtuality visual analytics systems and identify avenues for future work.},
keywords = {immersive analytics, cross-reality, augmented reality},
award = {This work received an Honorable Mention Award},
note = {VR '24}
}
@article{barrera2023immersivesketchingframework,
title = {Toward More Comprehensive Evaluations of 3D Immersive Sketching, Drawing, and Painting},
author = {Barrera Machuca, Mayra Donaji and Israel, Johann Habakuk and Keefe, Daniel F. and Stuerzlinger, Wolfgang},
journal = {Transactions on Visualization and Computer Graphics},
publisher = {IEEE},
series = {TVCG},
year = {2024},
month = {Aug},
volume = {30},
number = {8},
pages = {4648-4664},
doi = {https://doi.org/10.1109/TVCG.2023.3276291},
pdf = {papers/immersivesketchingframework.pdf},
teaser = {teasers/immersivesketchingframework.png},
abstract = {To understand current practice and explore the potential for more comprehensive evaluations of 3D immersive sketching, drawing, and painting, we present a survey of evaluation methodologies used in existing 3D sketching research, a breakdown and discussion of important phases (sub-tasks) in the 3D sketching process, and a framework that suggests how these factors can inform evaluation strategies in future 3D sketching research. Existing evaluations identified in the survey are organized and discussed within three high-level categories: 1) evaluating the 3D sketching activity, 2) evaluating 3D sketching tools, and 3) evaluating 3D sketching artifacts. The new framework suggests targeting evaluations to one or more of these categories and identifying relevant user populations. In addition, building upon the discussion of the different phases of the 3D sketching process, the framework suggests to evaluate relevant sketching tasks, which may range from low-level perception and hand movements to high-level conceptual design. Finally, we discuss limitations and challenges that arise when evaluating 3D sketching, including a lack of standardization of evaluation methods and multiple, potentially conflicting, ways to evaluate the same task and user interface usability; we also identify opportunities for more holistic evaluations. We hope the results can contribute to accelerating research in this domain and, ultimately, broad adoption of immersive sketching systems.},
keywords = {3D sketching, 3D drawing, 3D painting},
}
@article{mostajeran2023biophilic,
title = {Adding Virtual Plants Leads to Higher Cognitive Performance and Psychological Well-being in Virtual Reality},
author = {Mostajeran, Fariba and Steinicke, Frank and Reinhart*, Sarah and Stuerzlinger, Wolfgang and Riecke, Bernhard E. and Kühn, Simone},
journal = {Scientific Reports},
publisher = {Nature Portfolio},
series = {SciRep},
year = {2023},
month = {May},
volume = {13},
number = {1},
numpages = {12},
doi = {https://doi.org/10.1038/s41598-023-34718-3},
pdf = {papers/biophilic.pdf},
teaser = {teasers/biophilic.png},
abstract = {Previous research has shown the positive effects of exposure to real and virtual nature. To investigate how such benefits might generalize to ever-more-prevalent virtual workplaces, we examined the effects of the absence or presence of virtual plants in an office environment in Virtual Reality (VR) on users’ cognitive performance and psychological well-being. The results of our user study with 39 participants show that in the presence of virtual plants, participants performed significantly better in both short-term memory and creativity tasks. Furthermore, they reported higher psychological well-being scores, including positive affect and attentive coping, whilst reporting lower feelings of anger and aggression after exposure to virtual plants in VR. The virtual office with plants was also perceived as more restorative and induced a higher sense of presence. Overall, these results highlight how the presence of virtual plants in VR can have positive influences on users, and therefore, constitute important design considerations when developing future working and learning spaces.},
keywords = {biophilic design, cognition, well-being},
}
@article{kaya2023covidvis,
title = {Evaluation of an Immersive COVID-19 Data Visualization},
author = {Kaya+, Furkan and Celik+, Elif and Batmaz, Anil Ufuk and Mutasim*, Aunnoy K and Stuerzlinger, Wolfgang},
journal = {Computer Graphics & Applications},
publisher = {IEEE},
series = {CG&A},
year = {2023},
month = {Jan},
volume = {43},
number = {1},
pages = {76-83},
doi = {https://doi.org/10.1109/MCG.2022.3223535},
pdf = {papers/covidvis.pdf},
teaser = {teasers/covidvis.png},
abstract = {COVID-19 restrictions have detrimental effects on the population, both socially and economically. However, these restrictions are necessary as they help reduce the spread of the virus. For the public to comply, easily comprehensible communication between decision-makers and the public is thus crucial. To address this, we propose a novel 3D visualization of COVID-19 data which could increase the awareness of COVID-19 trends in the general population. We conducted a user study and compared a conventional 2D visualization with the proposed method in an immersive environment. Results showed that the our 3D visualization approach facilitated understanding of the complexity of COVID-19. A majority of participants preferred to see the COVID-19 data with the 3D method. Moreover, individual results revealed that our method increases the engagement of users with the data. We hope that our method will help governments to improve their communication with the public in the future.},
keywords = {visualization, 3D visualization, immersive analytics},
}
@article{villanueva2022advancedfatigue,
title = {Advanced Modeling Method for Quantifying Cumulative Subjective Fatigue in Mid-Air Interaction},
author = {Villanueva*, Ana Maria and Jang*, Sujin and Stuerzlinger, Wolfgang and Ambike, Satyajit and Ramani, Karthik},
journal = {International Journal of Human-Computer Studies},
publisher = {Elsevier},
series = {IJHCS},
year = {2023},
month = {Jan},
volume = {169},
commented-number = {0},
articleno = {102931},
numpages = {15},
doi = {https://doi.org/10.1016/j.ijhcs.2022.102931},
pdf = {papers/advancedfatigue.pdf},
teaser = {teasers/advancedfatigue.png},
abstract = {Interaction in mid-air can be fatiguing. A model-based method to quantify cumulative subjective fatigue for such interaction was recently introduced in HCI research. This model separates muscle units into three states: active (MA) fatigued (MF) or rested (MR) and defines transition rules between states. This method demonstrated promising accuracy in predicting subjective fatigue accumulated in mid-air pointing tasks. In this paper, we introduce an improved model that additionally captures the variations of the maximum arm strength based on arm postures and adds linearly-varying model parameters based on current muscle strength. To validate the applicability and capabilities of the new model, we tested its performance in various mid-air interaction conditions, including mid-air pointing/docking tasks, with shorter and longer rest and task periods, and a long-term evaluation with individual participants. We present results from multiple cross-validations and comparisons against the previous model and identify that our new model predicts fatigue more accurately. Our modeling approach showed a 42.5% reduction in fatigue estimation error when the longitudinal experiment data is used for an individual participant’s fatigue. Finally, we discuss the applicability and capabilities of our new approach.},
keywords = {fatigue, mid-air, model, docking, 3D manipulation},
}
@article{yamanaka2022pathsegmentation,
title = {The Effectiveness of Path-segmentation for Modeling Lasso Times in Width-varying Paths},
author = {Yamanaka, Shota and Usuba*, Hiroki and Stuerzlinger, Wolfgang and Miyashita, Homei},
journal = {Proceedings of the ACM Human-Computer Interaction},
publisher = {ACM},
series = {PACM-HCI},
year = {2022},
month = {Dec},
volume = {6},
number = {ISS},
articleno = {584},
pages = {640-659},
doi = {https://doi.org/10.1145/3567737},
pdf = {papers/pathsegmentation.pdf},
video = {videos/pathsegmentation.mp4},
teaser = {teasers/pathsegmentation.png},
abstract = {Models of lassoing time to select multiple square icons exist, but realistic lasso tasks also typically involve encircling non-rectangular objects. Thus, it is unclear if we can apply existing models to such conditions where, e.g., the width of the path that users want to steer through changes dynamically or step-wise. In this work, we conducted two experiments where the objects were non-rectangular with path widths that narrowed or widened, smoothly or step-wise. The results showed that the baseline models for pen-steering movements (the steering and crossing law models) fitted the timing data well, but also that segmenting width-changing areas led to significant improvements. Our work enables the modeling of novel UIs requiring continuous strokes, e.g., for grouping icons.},
keywords = {steering, crossing, lasso, group selection},
note = {ISS '22},
}
@article{batmaz2022throughput,
title = {Effective Throughput Analysis of Different Task Execution Strategies for Mid-Air Fitts' Tasks in Virtual Reality},
author = {Batmaz, Anil Ufuk and Stuerzlinger, Wolfgang},
journal = {Transactions on Visualization and Computer Graphics},
publisher = {IEEE},
series = {TVCG},
year = {2022},
month = {Oct},
volume = {28},
number = {11},
pages = {3939-3947},
doi = {https://doi.org/10.1109/TVCG.2022.3203105},
commented-url = {https://youtu.be/lMUSoiAdwWA},
pdf = {papers/throughputstrategies.pdf},
teaser = {teasers/throughputstrategies.png},
abstract = {Fitts’ law and throughput based on effective measures are two mathematical models frequently used to analyze human motor performance together with a standardized task, e.g., to compare the performance of input and output devices. Even though pointing has been deeply studied in 2D, it is not well understood how different task execution strategies affect throughput in 3D virtual environments. In this work, we examine MacKenzie’s effective throughput measure, claimed to be invariant to task execution strategies, in Virtual Reality (VR) systems with three such strategies, “as fast, as precise, and as fast and as precise as possible” for ray casting and virtual hand interaction, by re-analyzing data from a 3D pointing ISO 9241-411 study. Results show that effective throughput is not invariant for different task execution strategies in VR, which also matches a more recent 2D result. Normalized speed vs accuracy curves also did not fit the data. We suggest that practitioners, developers, and researchers who use MacKenzie’s effective throughput formulation should consider our findings when analyzing 3D user pointing performance in VR systems.},
keywords = {3D pointing, speed-accuracy tradeoff},
note = {ISMAR '22},
}
@article{nowak2021visualanalytics,
title = {Visual Analytics: A Method to Explore Natural Histories of Oral Epithelial Dysplasia},
author = {Nowak*, Stan and Rosin, Miriam and Stuerzlinger, Wolfgang and Bartram, Lyn},
journal = {Frontiers in Oral Health},
publisher = {Frontiers},
year = {2021},
month = {Aug},
volume = {2},
articleno = {703874},
numpages = {10},
doi = {https://doi.org/10.3389/froh.2021.703874},
pdf = {papers/va4oralcancerDRAFT.pdf},
teaser = {teasers/va4oralcancer.png},
abstract = {Risk assessment and follow-up of oral potentially malignant lesions in patients with mild or moderate oral epithelial dysplasia is an ongoing challenge for improved oral cancer prevention. Part of the challenge is a lack of understanding of how observable features of such dysplasia, gathered as data by clinicians during follow-up, relate to underlying biological processes driving progression. Current research is at an exploratory phase where the precise questions to ask are not known. While traditional statistical and the newer machine learning and artificial intelligence methods are effective in well-defined problem spaces with large datasets, these are not the circumstances we face currently. We argue that the field is in need of exploratory methods that can better integrate clinical and scientific knowledge into analysis to iteratively generate viable hypotheses. In this perspective, we propose that visual analytics presents a set of methods well-suited to these needs. We illustrate how visual analytics excels at generating viable research hypotheses by describing our experiences using visual analytics to explore temporal shifts in the clinical presentation of epithelial dysplasia. Visual analytics complements existing methods and fulfills a critical and at-present neglected need in the formative stages of inquiry we are facing.},
keywords = {visual analytics, oral health, visualization, oral cancer},
commented-note = {draft version},
}
@article{wagner2021interaction,
title = {Comparing and Combining Virtual Hand and Virtual Ray Pointer Interactions for Data Manipulation in Immersive Analytics},
author = {Wagner Filho*, Jorge and Stuerzlinger, Wolfgang and Nedel, Luciana},
journal = {Transactions on Visualization and Computer Graphics},
publisher = {IEEE},
series = {TVCG},
year = {2021},
month = {Mar},
volume = {27},
number = {5},
pages = {2513-2523},
doi = {https://doi.org/10.1109/TVCG.2021.3067759},
pdf = {papers/stcinteraction.pdf},
video = {videos/stcinteraction.mp4},
teaser = {teasers/stcinteraction.png},
abstract = {Displaying data visualizations in Virtual Reality environments enables analysts to explore large amounts of information more easily, supported by different perspectives and stereoscopic 3D display. Easy-to-use interaction affords additional benefits, such as more intuitively querying or filtering the data. Many Immersive Analytics systems employ either a virtual hands metaphor, with actions such as grabbing and stretching, or virtual ray pointers, with actions assigned to controller buttons. However, the effect of this choice in immersive visualization systems is unknown. Considering that each approach has different advantages, we implemented and evaluated both as well as a third option: seamlessly integrating both modes and allowing the user to alternate between them without explicit mode switches. We compared these three conditions through a controlled user study in the spatio-temporal data domain. We did not find significant differences between hands and ray-casting in task performance, workload, or interactivity patterns. Yet, 60% of the participants preferred the mixed mode and benefited from it by choosing the best alternative for each low-level task. This mode significantly reduced completion times by 23% for the most demanding task, at the cost of a 5% decrease in overall success rates.},
keywords = {visual analytics, immersive analytics, space-time cube, 3D visualization, 3D interaction},
note = {VR '21},
}
@article{wagner2021navigation,
title = {The Effect of Exploration Mode and Frame of Reference in Immersive Analytics},
author = {Wagner Filho*, Jorge and Stuerzlinger, Wolfgang and Nedel, Luciana},
journal = {Transactions on Visualization and Computer Graphics},
publisher = {IEEE},
series = {TVCG},
year = {2021},
month = {Feb},
volume = {28},
number = {9},
numpages = {3252-3264},
doi = {https://doi.org/10.1109/TVCG.2021.3060666},
pdf = {papers/stcnavigation.pdf},
video = {videos/stcnavigation.mp4},
teaser = {teasers/stcnavigation.png},
abstract = {The design space for user interfaces for Immersive Analytics applications is vast. Designers can combine navigation and manipulation to enable data exploration with ego- or exocentric views, have the user operate at different scales, or use different forms of navigation with varying levels of physical movement. This freedom results in a multitude of different viable approaches. Yet, there is no clear understanding of the advantages and disadvantages of each choice. Our goal is to investigate the affordances of several major design choices, to enable both application designers and users to make better decisions. In this work, we assess two main factors, exploration mode and frame of reference, consequently also varying visualization scale and physical movement demand. To isolate each factor, we implemented nine different conditions in a Space-Time Cube visualization use case and asked 36 participants to perform multiple tasks. We analyzed the results in terms of performance and qualitative measures and correlated them with participants' spatial abilities. While egocentric room-scale exploration significantly reduced mental workload, exocentric exploration improved performance in some tasks. Combining navigation and manipulation made tasks easier by reducing workload, temporal demand, and physical effort.},
keywords = {visual analytics, immersive analytics, space-time cube, 3D visualization, 3D navigation},
}
@comment{c, c={issue appeared in 2021}}
@article{gloumeau2020pinnpivot,
title = {{PinNPivot}: Object Manipulation Using Pins in Immersive Virtual Environments},
author = {Gloumeau*, Paul Christopher and Stuerzlinger, Wolfgang and Han, JungHyun},
journal = {Transactions on Visualization and Computer Graphics},
publisher = {IEEE},
series = {TVCG},
year = {2020},
month = {Apr},
volume = {27},
number = {4},
pages = {2488-2494},
doi = {https://doi.org/10.1109/TVCG.2020.2987834},
pdf = {papers/pinnpivot.pdf},
video = {videos/pinnpivot.mp4},
teaser = {teasers/pinnpivot.png},
abstract = {Object manipulation techniques in immersive virtual environments are either inaccurate or slow. We present a novel technique, PinNPivot, where pins are used to constrain 1DOF/2DOF/3DOF rotations. It also supports 6DOF manipulation and 3DOF translation. A comparison with three existing techniques shows that PinNPivot is significantly more accurate and faster.},
keywords = {3D manipulation, docking},
}
@article{batmaz2020beam,
title = {How Automatic Speed Control Based on Distance Affects User Behaviours in Telepresence Robot Navigation within Dense Conference-like Environments},
author = {Batmaz, Anil Ufuk and Maiero*, Jens and Kruijff, Ernst and Riecke, Bernhard E. and Neustaedter, Carman and Stuerzlinger, Wolfgang},
journal = {PLoS ONE},
publisher = {Public Library of Science},
year = {2020},
month = {Nov},
volume = {15},
number = {11},
articleno = {e0242078},
numpages = {47},
doi = {https://doi.org/10.1371/journal.pone.0242078},
pdf = {papers/beamspeed.pdf},
teaser = {teasers/beamspeed.png},
commented-series = {PLOS One},
abstract = {Telepresence robots allow users to be spatially and socially present in remote environments. Yet, it can be challenging to remotely operate telepresence robots, especially in dense environments such as academic conferences or workplaces. In this paper, we primarily focus on the effect that a speed control method, which automatically slows the telepresence robot down when getting closer to obstacles, has on user behaviors. In our first user study, participants drove the robot through a static obstacle course with narrow sections. Results indicate that the automatic speed control method significantly decreases the number of collisions. For the second study we designed a more naturalistic, conference-like experimental environment with tasks that require social interaction, and collected subjective responses from the participants when they were asked to navigate through the environment. While about half of the participants preferred automatic speed control because it allowed for smoother and safer navigation, others did not want to be influenced by an automatic mechanism. Overall, the results suggest that automatic speed control simplifies the user interface for telepresence robots in static dense environments, but should be considered as optionally available, especially in situations involving social interactions.},
keywords = {telepresence robot, automatic distance, 3D navigation, speed control},
}
@article{alharbi2020frustration,
title = {The Effects of Predictive Features of Mobile Keyboards on Text Entry Speed and Errors},
author = {Alharbi*, Ohoud and Stuerzlinger, Wolfgang and Putze, Felix},
journal = {Proceedings of the ACM Human-Computer Interaction},
publisher = {ACM},
series = {PACM-HCI},
year = {2020},
month = {Nov},
volume = {4},
number = {ISS},
articleno = {183},
numpages = {16},
doi = {https://doi.org/10.1145/3427311},
pdf = {papers/autocorrectfrustration.pdf},
teaser = {teasers/autocorrectfrustration.png},
abstract = {Mobile users rely on typing assistant mechanisms such as prediction and autocorrect. Previous studies on mobile keyboards showed decreased performance for heavy use of word prediction, which identifies a need for more research to better understand the effectiveness of predictive features for different users. Our work aims at such a better understanding of user interaction with autocorrections and the prediction panel while entering text, in particular when these approaches fail. We present a crowd-sourced mobile text entry study with 170 participants. Our mobile web application simulates autocorrection and word prediction to capture user behaviours around these features. We found that using word prediction saves an average of 3.43 characters per phrase but also adds an average of two seconds compared to actually typing the word, resulting in a negative effect on text entry speed. We also identified that the time to fix wrong autocorrections is on average 5.5 seconds but that autocorrection does not have a significant effect on typing speed.},
keywords = {text entry, autocorrect, prediction, errors},
note = {ISS '20},
}
@article{yamanaka2020obstacle,
title = {Necessary and Unnecessary Obstacle Avoidance Movements Affect User Behaviors in Crossing Operations},
author = {Yamanaka, Shota and Stuerzlinger, Wolfgang},
journal = {Transactions on Computer-Human Interaction},
publisher = {ACM},
series = {TOCHI},
year = {2020},
month = {Nov},
volume = {27},
number = {6},
articleno = {44},
numpages = {31},
doi = {https://doi.org/10.1145/3418413},
pdf = {papers/obstacleavoidance.pdf},
teaser = {teasers/obstacleavoidance.png},
abstract = {The "crossing time" to pass between objects in lassoing tasks is predicted by Fitts' law. When an unwanted object, or obstacle, intrudes into the user's path, users curve the stroke to avoid hitting that obstacle. We empirically show that, in the presence of an obstacle, modified Fitts models for pointing with obstacle avoidance can significantly improve the prediction accuracy of movement time compared with standard Fitts' law. Yet, we also found that when an object is (only) close to the crossing path, i.e., a distractor, users still curve their stroke, even though the object does not intrude. We tested the effects of distractor proximity and length. While the crossing motion is modified by a nearby distractor, our results also identify that overall its effect on crossing times was small, and thus Fitts' law can still be applied safely with distractors.},
keywords = {steering, crossing, lasso, group selection, obstacle},
}
@comment{c, c={could be re-classified as misc, see also the blog entry: steed2020covidblog}}
@article{steed2020covid,
title = {Evaluating Immersive Experiences during {COVID-19} and Beyond},
author = {Steed, Anthony and Ortega, Francisco R. and Williams, Adam S. and Kruijff, Ernst and Stuerzlinger, Wolfgang and Batmaz, Anil Ufuk and Stevenson Won, Andrea and Suma Rosenberg, Evan and Simeone, Adalberto L. and Hayes, Aleshia},
journal = {Interactions},
publisher = {ACM},
year = {2020},
month = {Jul},
volume = {27},
number = {4},
pages = {62–67},
doi = {https://doi.org/10.1145/3406098},
pdf = {papers/evaluatingimmersive.pdf},
abstract = {The COVID-19 pandemic has disrupted our daily lives. The safety and well-being of people are paramount, and there is no exception for the human-computer interaction (HCI) field. Most universities and research labs have closed non-critical research labs. With that closure and the student populations having left campus, in-person user studies have been suspended for the foreseeable future. Experiments that involve the usage of specialized technology, such as virtual and augmented reality headsets, create additional challenges. While some head-mounted displays (HMDs) have become more affordable for consumers (e.g., Oculus Quest), there are still multiple constraints for researchers, including the expense of high-end HMDs (e.g., Microsoft Hololens), high-end graphics hardware, and specialized sensors, as well as ethical concerns around reusing equipment that comes in close contact with each participant and may be difficult to sterilize. These difficulties have led the extended reality (XR) community (which includes the virtual reality (VR) and augmented reality (AR) research communities) to ask how we can continue to practically and ethically run experiments under these circumstances. Here, we summarize the status of a community discussion of short-term, medium-term, and long-term measures to deal with the current COVID-19 situation and its potential longer-term impacts. In particular, we outline steps we are taking toward community support of distributed experiments. There are a number of reasons to look at a more distributed model of participant recruitment, including the generalizability of the work and potential access to target-specific, hard-to-reach user groups. We hope that this article will inform the first steps toward addressing the practical and ethical concerns for such studies.},
keywords = {3D user interfaces, COVID-19, virtual reality, augmented reality, extended reality},
}
@article{maiero2019backofdevice,
title = {Back-of-Device Force Feedback Improves Touchscreen Interaction for Mobile Devices},
author = {Maiero*, Jens and Eibich*, David and Kruijff, Ernst and Hinkenjann, André and Stuerzlinger, Wolfgang and Benko, Hrvoje and Ghinea, George},
journal = {Transactions on Haptics},
publisher = {IEEE},
series = {TOH},
year = {2019},
month = {Oct},
volume = {12},
number = {4},
pages = {483-496},
doi = {https://doi.org/10.1109/TOH.2019.2911519},
pdf = {papers/hapticphone.pdf},
teaser = {teasers/hapticphone.png},
abstract = {Touchscreen interaction suffers from occlusion problems as fingers can cover small targets, which makes interacting with such targets challenging. To improve touchscreen interaction accuracy and consequently the selection of small or hidden objects, we introduce a back-of-device force feedback system for smartphones. We introduce a new solution that combines force feedback on the back to enhance touch input on the front screen. The interface includes three actuated pins at the back of a smartphone. All three pins are driven by microservos and can be actuated up to a frequency of 50 Hz and a maximum amplitude of 5 mm. In a first psychophysical user study, we explored the limits of the system. Thereafter, we demonstrate through a performance study that the proposed interface can enhance touchscreen interaction precision, compared to state-of-the-art methods. In particular, the selection of small targets performed remarkably well with force feedback. The study additionally shows that users subjectively felt significantly more accurate with force feedback. Based on the results, we discuss back-to-front feedback design issues and demonstrate potential applications through several prototypical concepts to illustrate where the back-of-device force feedback could be beneficial.},
keywords = {haptics, mobile device, touch},
}
@comment{c, c={issue appeared in 2021}}
@article{nguyenvo2019naviboard,
title = {{NaviBoard} and {NaviChair}: Limited Translation Combined with Full Rotation for Efficient Virtual Locomotion},
author = {Nguyen-Vo*, Thinh and Riecke, Bernhard E. and Stuerzlinger, Wolfgang and Pham*, Duc-Minh and Kruijff, Ernst},
journal = {Transactions on Visualization and Computer Graphics},
publisher = {IEEE},
series = {TVCG},
year = {2019},
month = {Aug},
volume = {27},
number = {1},
pages = {165-177},
doi = {https://doi.org/10.1109/TVCG.2019.2935730},
pdf = {papers/naviboard.pdf},
video = {https://www.youtube.com/watch?v=JCYL2qVFO6M},
teaser = {teasers/naviboard.png},
abstract = {Walking has always been considered as the gold standard for navigation in Virtual Reality research. Though full rotation is no longer a technical challenge, physical translation is still restricted through limited tracked areas. While rotational information has been shown to be important, the benefit of the translational component is still unclear with mixed results in previous work. To address this gap, we conducted a mixed-method experiment to compare four levels of translational cues and control: none (using the trackpad of the HTC Vive controller to translate), upper-body leaning (sitting on a "NaviChair", leaning the upper-body to locomote), whole-body leaning/stepping (standing on a platform called NaviBoard, leaning the whole body or stepping one foot off the center to navigate), and full translation (physically walking). Results showed that translational cues and control had significant effects on various measures including task performance, task load, and simulator sickness. While participants performed significantly worse when they used a controller with no embodied translational cues, there was no significant difference between the NaviChair, NaviBoard, and actual walking. These results suggest that translational body-based motion cues and control from a low-cost leaning/stepping interface might provide enough sensory information for supporting spatial updating, spatial awareness, and efficient locomotion in VR, although future work will need to investigate how these results might or might not generalize to other tasks and scenarios.},
keywords = {3D navigation, speed control},
}
@article{wagner2019evaluating,
title = {Evaluating an Immersive Space-Time Cube Geovisualization for Intuitive Trajectory Data Exploration},
author = {Wagner Filho*, Jorge and Stuerzlinger, Wolfgang and Nedel, Luciana},
journal = {Transactions on Visualization and Computer Graphics},
publisher = {IEEE},
series = {TVCG},
year = {2019},
month = {Oct},
volume = {26},
number = {1},
pages = {514-524},
doi = {https://doi.org/10.1109/TVCG.2019.2934415},
pdf = {papers/stcvirtualdesk.pdf},
video = {videos/stcvirtualdesk.mp4},
teaser = {teasers/stcvirtualdesk.png},
abstract = {A Space-Time Cube enables analysts to clearly observe spatio-temporal features in movement trajectory datasets in geovisualization. However, its general usability is impacted by a lack of depth cues, a reported steep learning curve, and the requirement for efficient 3D navigation. In this work, we investigate a Space-Time Cube in the Immersive Analytics domain. Based on a review of previous work and selecting an appropriate exploration metaphor, we built a prototype environment where the cube is coupled to a virtual representation of the analyst's real desk, and zooming and panning in space and time are intuitively controlled using mid-air gestures. We compared our immersive environment to a desktop-based implementation in a user study with 20 participants across 7 tasks of varying difficulty, which targeted different user interface features. To investigate how performance is affected in the presence of clutter, we explored two scenarios with different numbers of trajectories. While the quantitative performance was similar for the majority of tasks, large differences appear when we analyze the patterns of interaction and consider subjective metrics. The immersive version of the Space-Time Cube received higher usability scores, much higher user preference, and was rated to have a lower mental workload, without causing participants discomfort in 25-minute-long VR sessions.},
keywords = {visual analytics, immersive analytics, space-time cube, 3D visualization},
note = {VIS '19},
}
@article{yamanaka2018analysis,
title = {Analysis and Modeling the Steering Operations in Sequential Linear Path Segments},
author = {Yamanaka*, Shota and Stuerzlinger, Wolfgang and Miyashita, Homei},
journal = {IPSJ Journal},
publisher = {Information Processing Society of Japan},
issn = {1882-7764},
year = {2018},
month = {Feb},
volume = {59},
number = {2},
pages = {633-643},
commented-url = {http://id.nii.ac.jp/1001/00185782},
url = {https://ipsj.ixsq.nii.ac.jp/records/185870},
keywords = {steering, lasso, group selection},
note = {In Japanese},
}
@article{seim2017passivehaptic,
title = {Passive Haptic Training to Improve Speed and Performance on a Keypad},
author = {Seim*, Caitlyn and Doering+, Nick and Zhang+, Yang and Stuerzlinger, Wolfgang and Starner, Thad},
journal = {Proceedings on Interactive, Mobile, Wearable and Ubiquitous Technologies},
publisher = {ACM},
series = {IMWUT},
year = {2017},
month = {Sep},
volume = {1},
number = {3},
articleno = {100},
numpages = {13},
doi = {https://doi.org/10.1145/3132026},
pdf = {papers/passivehapticslearning.pdf},
teaser = {teasers/passivehapticslearning.png},
abstract = {Learning text entry systems is challenging, yet necessary. Many layouts and keyboards exist, but they rely on laborious learning techniques. Passive haptic learning (PHL) has already demonstrated some benefit for learning the Braille text entry system. Could this computing-enabled technique be used to improve desktop keyboard typing skills? It is unknown whether passive haptic training can improve speed on a motor task (as opposed to initial learning). We use a randomized numeric keypad to examine users' typing performance with or without passive haptic training. When users were prevented from looking at the keyboard, the PHL group demonstrated consistent accuracy (-0.011 KSPC) while those in the control group greatly increased their error (+1.26 KSPC on average). This result is consistent with the finding that PHL users looked significantly less at the keyboard. In a second, longer study, users exposed to PHL were found to significantly improve their typing speed (mean increase of 11 WPM) versus control (mean increase of 2.2 WPM).},
keywords = {haptics, learning, text entry},
note = {Ubicomp '17},
}
@article{waese2017eplant,
title = {{ePlant}: Visualizing and Exploring Multiple Levels of Data for Hypothesis Generation in Plant Biology},
author = {Waese*, Jamie and Fan+, Jim and Pasha+, Asher and Yu+, Hans and Fucile, Geoffrey and Shi+, Ian and Cumming+, Matthew and Kelley, Lawrence and Sternberg, Michael and Krishnakumar, Vivek and Ferlanti, Erik and Miller, Jason and Town, Chris and Stuerzlinger, Wolfgang and Provart, Nicholas},
journal = {The Plant Cell},
publisher = {American Society of Plant Biologists},
year = {2017},
month = {Aug},
volume = {29},
number = {8},
pages = {1806-1821},
doi = {https://doi.org/10.1105/tpc.17.00073},
url = {http://bar.utoronto.ca/eplant},
pdf = {papers/eplant.pdf},
teaser = {teasers/eplant.png},
abstract = {A big challenge in current systems biology research arises when different types of data must be accessed from separate sources and visualized using separate tools. The high cognitive load required to navigate such a workflow is detrimental to hypothesis generation. Accordingly, there is a need for a robust research platform that incorporates all data and provides integrated search, analysis, and visualization features through a single portal. Here, we present ePlant (http://bar.utoronto.ca/eplant), a visual analytic tool for exploring multiple levels of Arabidopsis thaliana data through a zoomable user interface. ePlant connects to several publicly available web services to download genome, proteome, interactome, transcriptome, and 3D molecular structure data for one or more genes or gene products of interest. Data are displayed with a set of visualization tools that are presented using a conceptual hierarchy from big to small, and many of the tools combine information from more than one data type. We describe the development of ePlant in this article and present several examples illustrating its integrative features for hypothesis generation. We also describe the process of deploying ePlant as an "app" on Araport. Building on readily available web services, the code for ePlant is freely available for any other biological species research.},
keywords = {visualization, visual analytics},
}
@comment{c, c={not sure if this is best article or proceedings}}
@article{dwyer2016dagstuhl,
title = {Immersive Analytics (Dagstuhl Seminar 16231)},
author = {Dwyer, Tim and Henry Riche, Nathalie and Klein, Karsten and Stuerzlinger, Wolfgang and Thomas, Bruce H.},
journal = {Dagstuhl Reports},
publisher = {Schloss Dagstuhl-Leibniz-Zentrum fuer Informatik},
commented-series = {Dagstuhl Seminar 16231},
issn = {2192-5283},
year = {2016},
month = {Nov},
volume = {6},
number = {6},
pages = {1-9},
doi = {https://doi.org/10.4230/DagRep.6.6.1},
pdf = {papers/dagstuhl_IA.pdf},
teaser = {teasers/dagstuhl.png},
abstract = {This report documents the program and the outcomes of Dagstuhl Seminar 16231 "Immersive Analytics". Close to 40 researchers and practitioners participated in this seminar to discuss and define the field of Immersive Analytics, to create a community around it, and to identify its research challenges. As the participants had a diverse background in a variety of disciplines, including Human-Computer-Interaction, Augmented and Virtual Reality, Information Visualization, and Visual Analytics, the seminar featured a couple of survey talks on the first days, followed by plenary and working group discussions that were meant to shape the field of Immersive Analytics. As an outcome, a book publication is planned with book chapters provided by the participants.},
keywords = {visual analytics, visualization, immersive analytics},
}
@article{liang2013investigation,
title = {An Investigation of Suitable Interactions for {3D} Manipulation of Distant Objects Through a Mobile Device},
author = {Liang, Hai-Ning and Williams*, Cary and Semegen, Myron and Stuerzlinger, Wolfgang and Irani, Pourang},
journal = {International Journal on Innovative Computing, Information and Control},
issn = {1349-4198},
year = {2013},
month = {Dec},
volume = {9},
number = {12},
pages = {4737-4752},
url = {http://www.ijicic.org/vol-9(12).htm},
pdf = {papers/dualsurface2.pdf},
teaser = {teasers/dualsurface2.png},
abstract = {In this paper, we present our research linking two types of technologies that are gaining importance: mobile devices and large displays. Mobile devices now come integrated with a variety of sophisticated sensors, including multi-touch displays, gyroscopes and accelerometers, which allow them to capture rich varieties of gestures and make them ideal to be used as input devices to interact with an external display. In this research we explore what types of sensors are easy and intuitive to use to support people's exploration of 3D objects shown in large displays located at a distance. To conduct our research we have developed a device with two multi-touch displays, one on its front and the other in the back, and motion sensors. We then conducted an exploratory study in which we asked participants to provide interactions that they believe are easy and natural to perform operations with 3D objects. We have aggregated the results and found some common patterns about users' preferred input sensors and common interactions. In this paper we report the findings of the study and describe a new interface whose design is informed by the results.},
keywords = {3D manipulation, docking, mobile device},
}
@article{pintilie2013evaluation,
title = {An Evaluation of Interactive and Automated Next-best View Methods in {3D} Scanning},
author = {Pintilie*, Grigori D. and Stuerzlinger, Wolfgang},
journal = {Computer-Aided Design and Applications},
year = {2013},
month = {Mar},
volume = {10},
number = {2},
pages = {279-291},
doi = {https://doi.org/10.3722/cadaps.2013.279-291},
pdf = {papers/scanUI.pdf},
teaser = {teasers/scanUI.png},
abstract = {Scanning of objects to produce 3D models is becoming more commonplace as the required hardware is becoming less expensive and more widely attainable. The process involves obtaining scans of multiple views so as to create a complete 3D model. This is typically a user-driven process, and an analysis of the difficulty of this task, use of automation, visualization methods, and their effect on the final result has not yet been thoroughly investigated. In this paper we report on a user study related to 3D scanning in which the user is asked to use a simulated, somewhat simplified 3D scanner with a simple user interface. Our investigation focuses on scanning the complete surface of an object with decent sampling density, but does not take all sampling issues, such as reflections, into account. We evaluate different visualization methods, which aim to help the user complete or improve scans, and compare the results obtained by participants to those obtained using an automated approach. The results show that users can easily obtain complete scans or improve existing scans using this simple interface, and that different visualization methods are more or less equally effective; moreover, user performance is on par with automated scanning methods.},
keywords = {3D scanning, next-best view},
}
@article{mcarthur2010examining,
title = {Comparing {3D} Content Creation Interfaces in Two Virtual Worlds: World of Warcraft and Second Life},
author = {{McArthur}*, Victoria and Teather*, Robert J. and Stuerzlinger, Wolfgang},
journal = {Journal of Gaming & Virtual Worlds},
year = {2010},
month = {Dec},
volume = {2},
number = {3},
pages = {239-258},
doi = {https://doi.org/10.1386/jgvw.2.3.239_1},
pdf = {papers/3dui4virtualworldcreation.pdf},
teaser = {teasers/3dui4virtualworldcreation.png},
abstract = {In this article we compare the content creation systems of two popular virtual worlds: World of Warcraft and Second Life. We then discuss recommendations for 3D content creation systems based on current trends in 3D user interface research. We hypothesize that by designing 3D content creation systems that follow these recommendations, virtual world economies based on custom content creation (e.g., Second Life) may be transformed, as more people will be able to create and modify content.},
keywords = {3D modeling},
}
@article{bowman20083dui,
title = {{3D} User Interfaces: New Directions and New Perspectives},
author = {Bowman, Doug and Coquillart, Sabine and Fröhlich, Bernd and Hirose, Michitaka and Kitamura, Yoshifumi and Kiyokawa, Kiyoshi and Stuerzlinger, Wolfgang},
journal = {Computer Graphics & Applications},
publisher = {IEEE},
series = {CG&A},
year = {2008},
month = {Nov},
volume = {28},
number = {6},
pages = {20-36},
doi = {https://doi.org/10.1109/MCG.2008.109},
pdf = {papers/newdirections3dui.pdf},
abstract = {Three-dimensional user interfaces (3D UIs) allow users to interact with virtual objects, environments, or information using direct 3D input in the physical and/or virtual space. With the advent of systems like the Nintendo Wii, 3D UIs have entered the mainstream. Thus, research on 3D UIs is more relevant than ever. In this article, the founders and organizers of the IEEE Symposium on 3D User Interfaces reflect on the current state-of-the-art in several key aspects of 3D UIs, and speculate on future research directions for 3D UIs as well.},
keywords = {3D user interfaces},
}
@article{stuerzlinger2006covid,
title = {The Design and Realization of {CoViD}: A System for Collaborative Virtual {3D} Design},
author = {Stuerzlinger, Wolfgang and Zaman*, Loutfouz and Pavlovych*, Andriy and Oh*, Ji-Young},
journal = {Virtual Reality},
publisher = {Springer},
year = {2006},
month = {Oct},
volume = {10},
number = {2},
pages = {135-147},
doi = {https://doi.org/10.1007/s10055-006-0048-0},
pdf = {papers/covid.pdf},
teaser = {teasers/covid.png},
abstract = {Many important decisions in the design process are made fairly early on, after designers have presented initial concepts. In many domains, these concepts are already realized as 3D digital models. Then, in a meeting, the stakeholders for the project get together and evaluate these potential solutions. Frequently, the participants in this meeting want to interactively modify the proposed 3D designs to explore the design space better. Today's systems and tools do not support this, as computer systems typically support only a single user and computer-aided design tools require significant training.
This paper presents the design of a new system to facilitate a collaborative 3D design process. First, we discuss a set of guidelines which have been introduced by others and that are relevant to collaborative 3D design systems. Then, we introduce the new system, which consists of two main parts. The first part is an easy-to-use conceptual 3D design tool that can be used productively even by naive users. The tool provides novel interaction techniques that support important properties of conceptual design. The user interface is non-obtrusive, easy-to-learn, and supports rapid creation and modification of 3D models. The second part is a novel infrastructure for collaborative work, which offers an interactive table and several large interactive displays in a semi-immersive setup. It is designed to support multiple users working together. This infrastructure also includes novel pointing devices that work both as a stylus and a remote pointing device. The combination of the (modified) design tool with the collaborative infrastructure forms a new platform for collaborative virtual 3D design. Then, we present an evaluation of the system against the guidelines for collaborative 3D design. Finally, we present results of a preliminary user study, which asked naive users to collaborate in a 3D design task on the new system.},
keywords = {3D modeling, collaboration, design},
}
@article{vorozcovs2006hedgehog,
title = {The Hedgehog: A Novel Optical Tracking Method for Spatially Immersive Displays},
author = {Vorozcovs*, Andrew and Stuerzlinger, Wolfgang and Hogue*, Andrew and Allison, Robert},
journal = {Presence: Teleoperators & Virtual Environments},
year = {2006},
month = {Feb},
volume = {15},
number = {1},
pages = {108-121},
doi = {https://doi.org/10.1162/pres.2006.15.1.108},
pdf = {papers/hedgehog2.pdf},
teaser = {teasers/hedgehog2.png},
abstract = {Existing commercial technologies do not adequately meet the requirements for tracking in fully-enclosed Virtual Reality displays. We present a novel six degree of freedom tracking system, the Hedgehog, which overcomes several limitations inherent in existing sensors and tracking technology. The system reliably estimates the pose of the user's head with high resolution and low spatial distortion. Light emitted from an arrangement of lasers projects onto the display walls. An arrangement of cameras images the walls and the two-dimensional centroids of the projections are tracked to estimate the pose of the device. The system is able to handle ambiguous laser projection configurations, static and dynamic occlusions of the lasers, and incorporates an auto-calibration mechanism due to the use of the SCAAT (Single Constraint At A Time) algorithm. A prototype system was evaluated relative to a state-of-the-art motion tracker and showed comparable positional accuracy (1-2 mm RMS) and significantly better absolute angular accuracy (0.1 deg RMS).},
keywords = {3D tracking},
}
@article{seetzen2004hdrdisplay,
title = {High Dynamic Range Display Systems},
author = {Seetzen*, Helge and Heidrich, Wolfgang and Stuerzlinger, Wolfgang and Ward, Greg and Whitehead, Lorne and Trentacoste*, Matthew and Ghosh*, Abhijeet and Vorozcovs*, Andrew},
journal = {Transactions on Graphics},
publisher = {ACM},
series = {TOG},
year = {2004},
month = {Aug},
volume = {23},
number = {3},
pages = {760-768},
doi = {https://doi.org/10.1145/1015706.1015797},
pdf = {papers/hdrdisplays.pdf},
teaser = {teasers/hdrdisplays.png},
abstract = {The dynamic range of many real-world environments exceeds the capabilities of current display technology by several orders of magnitude. In this paper we discuss the design of two different display systems that are capable of displaying images with a dynamic range much more similar to that encountered in the real world. The first display system is based on a combination of an LCD panel and a DLP projector, and can be built from off-the-shelf components. While this design is feasible in a lab setting, the second display system, which relies on a custom-built LED panel instead of the projector, is more suitable for usual office workspaces and commercial applications. We describe the design of both systems as well as the software issues that arise. We also discuss the advantages and disadvantages of the two designs and potential applications for both systems.},
keywords = {high dynamic range, display},
note = {SIGGRAPH '04},
}
@article{oh2004conceptual,
title = {A System for Desktop Conceptual {3D} Design},
author = {Oh*, Ji-Young and Stuerzlinger, Wolfgang},
journal = {Virtual Reality},
publisher = {Springer},
year = {2004},
month = {Jun},
volume = {7},
number = {3-4},
pages = {198-211},
doi = {https://doi.org/10.1007/s10055-004-0128-y},
pdf = {papers/virtuallegodraft.pdf},
teaser = {teasers/virtuallego.png},
abstract = {In the traditional design process for a 3D environment, people usually depict a rough prototype to verify their ideas, and iteratively modify its configuration until they are satisfied with the general layout. In this activity, one of the main operations is the rearrangement of single and composite parts of a scene. With current desktop virtual reality (VR) systems, the selection and manipulation of arbitrary objects in 3D is still difficult. In this work, we present new and efficient techniques that allow even novice users to perform meaningful rearrangement tasks with traditional input devices. The results of our work show that the presented techniques can be mastered quickly and enable users to perform complex tasks on composite objects. Moreover, the system is easy to learn, supports creativity, and is fun to use.},
keywords = {3D modeling, 3D manipulation, 3D positioning, content creation, design},
}
@article{parilov2002perpixel,
title = {Per-pixel divisions},
author = {Parilov*, Sergey and Stuerzlinger, Wolfgang},
journal = {Journal of Graphics Tools},
series = {JGT},
year = {2002},
month = {Jun},
volume = {7},
number = {4},
pages = {53-59},
doi = {https://doi.org/10.1080/10867651.2002.10487572},
pdf = {papers/divisions.pdf},
abstract = {We describe a method to perform per-pixel divisions using graphics hardware, with a simple iterative algorithm. In the worst case, the number of rendering passes is 17 for approximate divisions, and 18 for accurate divisions. The algorithm can be used for 3D vector normalization, evaluating complex lighting models, and image reconstruction.},
keywords = {rendering, real-time},
}
@article{parilov2002layered,
title = {Layered Relief Textures},
author = {Parilov*, Sergey and Stuerzlinger, Wolfgang},
journal = {Journal of WSCG},
issn = {1213-6972},
year = {2002},
month = {Feb},
volume = {10},
number = {2},
pages = {357-364},
url = {http://wscg.zcu.cz/wscg2002/Papers_2002/F87.pdf},
pdf = {papers/lrt.pdf},
teaser = {teasers/lrt.png},
abstract = {In this paper we present an Image-Based Rendering method for post-warping LDI's in real-time on existing systems. The algorithm performs accurate splatting at low computational costs, reduces memory-access bottlenecks, enables us to trade-off the quality for the speed, and is simple to implement.},
keywords = {rendering, real-time, image-based},
note = {WSCG '02},
}
@article{elinas2000realtime,
title = {Real-time Rendering of {3D} Clouds},
author = {Elinas*, Pantelis and Stuerzlinger, Wolfgang},
journal = {Journal of Graphics Tools},
series = {JGT},
year = {2000},
month = {Jul},
volume = {5},
number = {4},
pages = {33-45},
doi = {https://doi.org/10.1080/10867651.2000.10487531},
pdf = {papers/clouds.pdf},
teaser = {teasers/clouds.png},
abstract = {The visual realism of a computer graphics simulation of outdoor scenery is greatly enhanced by realistic display of clouds. In this paper, we present an algorithm based on Gardner's work that can render perspectively correct 3D clouds in real-time on current graphics hardware. The use of 3D ellipsoids as primitives permits even close-ups without the viewer noticing the approximation. We describe an implementation using OpenGL.},
keywords = {rendering, real-time, image-based},
}
@article{stuerzlinger1998raytracing,
title = {Ray-Tracing Triangular Trimmed Free-Form Surfaces},
author = {Stürzlinger, Wolfgang},
journal = {Transactions on Visualization and Computer Graphics},
publisher = {IEEE},
series = {TVCG},
year = {1998},
month = {Jul},
volume = {4},
number = {3},
pages = {202-214},
doi = {https://doi.org/10.1109/2945.722295},
pdf = {papers/rtttffs.pdf},
teaser = {teasers/rtttffs.png},
abstract = {This paper presents a new approach to rendering triangular algebraic free form surfaces. A hierarchical subdivision of the surface with associated tight bounding volumes provides for quick identification of the surface regions likely to be hit by a ray. For each leaf of the hierarchy an approximation to the corresponding surface region is stored. The approximation is used to compute a good starting point for the iteration, which ensures rapid convergence.
Trimming curves are described by a tree of trimming primitives such as squares, circles, polygons and free form curves combined with Boolean operations. For trimmed surfaces an irregular adaptive subdivision is constructed to quickly eliminate all parts outside the trimming curve from consideration during rendering. Cost heuristics are introduced to optimize the rendering time further.},
keywords = {rendering, ray tracing},
}
@comment{c, c={unfortunate-dup, because paper selected by conference for journal, but conference proceedings later also reclassified as journal by publisher}}
@article{stuerzlinger1998calculating,
title = {Calculating Global Illumination for Glossy Surfaces},
author = {Stürzlinger, Wolfgang},
journal = {Computers & Graphics},
publisher = {Elsevier},
series = {C&G},
year = {1998},
month = {Mar},
volume = {22},
number = {2-3},
pages = {175-180},
doi = {https://doi.org/10.1016/S0097-8493(98)00004-1},
pdf = {papers/calcglos.pdf},
teaser = {teasers/calcglos.png},
abstract = {Photorealistic rendering is used to generate views of computer stored scenes. Global illumination algorithms take all transfers of light in the scene into account thereby creating a realistic looking image. Previously several approaches have been presented which are able to deal with global illumination for diffuse surfaces. More general surfaces are handled only by few methods.
This work presents a new algorithm for the generation of photorealistic images for scenes with arbitrary surfaces. Initially particle tracing and a reconstruction phase are used to obtain a good approximation to the directionally dependent illumination in the scene. The illumination information is stored and can be used subsequently to generate images from different viewpoints directly from the stored solution. The whole system is structured into several independent phases and is designed to allow parallel processing and incremental refinement.},
keywords = {rendering, global illumination},
}
@comment{c, c={unfortunate-dup, because conference proceedings later reclassified as journal volume by WSCG}}
@article{stuerzlinger1997optimized,
title = {Global Illumination with Glossy Surfaces},
author = {Stürzlinger, Wolfgang},
journal = {Journal of WSCG},
issn = {1213-6972},
year = {1997},
month = {Feb},
volume = {5},
number = {3},
pages = {543-551},
url = {http://wscg.zcu.cz/wscg1997/papers97/Stuerzlinger_97.pdf},
pdf = {papers/glossyill.pdf},
teaser = {teasers/glossyill.png},
abstract = {Photorealistic rendering is used to generate views of computer stored scenes. Global illumination algorithms take all transfers of light in the scene into account thereby creating a realistic looking image. Previously several approaches have been presented which are able to deal with global illumination for diffuse surfaces. More general surfaces are handled only by few methods.
This work presents a new algorithm for the generation of photorealistic images for scenes with arbitrary surfaces. Initially particle tracing and a reconstruction phase are used to obtain a good approximation to the directionally dependent illumination in the scene. The illumination information is stored and can be used subsequently to generate images from different viewpoints directly from the stored solution. The whole system is structured into several independent phases and is designed to allow parallel processing and incremental refinement.},
keywords = {rendering, global illumination},
note = {WSCG '97},
footnote = {Conference proceedings later republished as journal volume by publisher},
}
@article{schaufler_stuerzlinger1996three,
title = {Three Dimensional Image Cache for Virtual Reality},
author = {Schaufler*, Gernot and Stürzlinger, Wolfgang},
journal = {Computer Graphics Forum},
year = {1996},
month = {Aug},
volume = {15},
number = {3},
pages = {227-235},
doi = {https://doi.org/10.1111/1467-8659.1530227},
commented-url = {http://www.gup.uni-linz.ac.at:8001/staff/schaufler/papers/octimp},
pdf = {papers/octimp.pdf},
teaser = {teasers/octimp.png},
abstract = {Despite recent advances in rendering hardware, large and complex virtual environments cannot be displayed with a sufficiently high frame rate, because of limitations in the available rendering performance. This paper presents a new approach of software accelerated rendering which draws from the concepts of impostors, hierarchical scene subdivision and levels of detail. So far software optimization in real-time rendering has merely considered individual objects. This work is actually optimizing the rendering of the whole virtual environment by implementing a three dimensional image cache. It speeds up rendering for large portions of the scene by exploiting the coherence inherent in any smooth frame sequence. The implementation of the three dimensional image cache is discussed and the savings in rendering load achievable on a suitable hardware platform are presented.},
keywords = {rendering, real-time},
award = {This work received a Günther Enderle award for Best Technical Paper},
note = {Eurographics '96},
footnote = {A co-evolution with "Hierarchical image caching for accelerated walkthroughs of complex environments", https://doi.org/10.1145/237170.237209},
}
@comment{c, c={conference proceedings later reclassified as journal volume by publisher}}
@article{stuerzlinger1996optimized,
title = {Optimized Local Pass Using Importance Sampling},
author = {Stürzlinger, Wolfgang},
journal = {Journal of WSCG},
issn = {1213-6972},
year = {1996},
month = {Feb},
volume = {4},
number = {2},
pages = {342-349},
url = {http://wscg.zcu.cz/wscg1996/papers96/Stuerzlinger_96.pdf},
pdf = {papers/localpass.pdf},
teaser = {teasers/localpass.png},
abstract = {Recent approaches to realistic image synthesis split the rendering process into two passes. The first pass calculates an approximate global illumination solution, the second produces an image of high quality (from a user selected view point) using the solution obtained in the first pass by applying the local illumination model to each surface point visible through each pixel.
This paper presents two new methods to compute the local illumination quickly. Instead of recalculating form factors and visibilities the information computed by a hierarchical radiosity solution algorithm is reused. The image generation time is reduced significantly by using stochastic methods.},
keywords = {rendering, global illumination},
note = {WSCG '96},
footnote = {Conference proceedings later republished as journal volume by publisher},
}
@comment{c, c={conference proceedings later reclassified as journal volume by publisher}}
@article{stuerzlinger1994parallel,
title = {Parallel Progressive Radiosity with Parallel Visibility Computations},
author = {Stürzlinger, Wolfgang and Wild*, Christoph},
journal = {Journal of WSCG},
issn = {1213-6972},
year = {1994},
month = {Feb},
volume = {2},
number = {1},
pages = {66-74},
url = {http://wscg.zcu.cz/wscg1994/papers94/Stuerzlinger_Wild_94.pdf},
pdf = {papers/parrad.pdf},
teaser = {teasers/parrad.png},
abstract = {The radiosity method models the interaction of light between diffuse reflecting surfaces, thereby accurately predicting global illumination effects. Due to the high computational effort to calculate the transfer of light between surfaces and the memory requirements for the scene description, a distributed, parallelized version of the algorithm is needed for scenes consisting of thousands of surfaces. We present a distributed, parallel radiosity algorithm, which can subdivide the surfaces adaptively. Additionally we present a scheme for parallel visibility calculations. Adaptive load redistribution is also discussed.},
keywords = {rendering, global illumination, parallel, visibility},
note = {WSCG '94},
footnote = {Conference proceedings later republished as journal volume by publisher},
}
@comment{c, c={leave the "_stuerzlinger" in the ID to enable umlaut-free search!}}
@article{barth_stuerzlinger1993efficient,
title = {Efficient Ray Tracing for Bezier and B-Spline Surfaces},
author = {Barth, Wilhem and Stürzlinger, Wolfgang},
journal = {Computers & Graphics},
publisher = {Elsevier},
series = {C&G},
year = {1993},
month = {Jul},
volume = {17},
number = {4},
pages = {423-430},
doi = {https://doi.org/10.1016/0097-8493(93)90031-4},
pdf = {papers/rtbez.pdf},
teaser = {teasers/rtbez.png},
abstract = {Generating realistic pictures by raytracing requires intersecting the objects with many rays (1~ million or more). With Bezier or B-Spline surfaces as objects the intersections must be calculated by an iterative method. This paper describes an algorithm which performs these calculations efficiently. In a preprocessing step the surface is subdivided adaptively into parts and a tight enclosure is calculated for each part. We selected parallelepipeds (first order approximations) as enclosures, their orientation and the angles between their edges are chosen in such a way that they enclose the respective part as tightly as possible, they are not rectangular in general. A binary tree built with these enclosures allows to test very fast which parts of the surface may be hit by a given ray. The leaves of the tree contain small, almost plane parts of the surface. For each part a linear approximation is calculated, this is a parallelogram, in general not rectangular. For each ray which hits the enclosure the intersection with this approximation is calculated first, yielding an accurate starting point for the following iteration.},
keywords = {rendering, ray tracing},
}
@comment{************************articles_in_books************************}
@inbook{seetzen2023hdrdisplay,
title = {High Dynamic Range Display Systems},
author = {Seetzen*, Helge and Heidrich, Wolfgang and Stuerzlinger, Wolfgang and Ward, Greg and Whitehead, Lorne and Trentacoste*, Matthew and Ghosh*, Abhijeet and Vorozcovs*, Andrew},
booktitle = {Seminal Graphics Papers: Pushing the Boundaries},
publisher = {ACM},
year = {2023},
month = {Aug},
volume = {2},
articleno = {5},
numpages = {9},
edition = {1},
doi = {https://doi.org/10.1145/3596711.3596717},
pdf = {papers/hdrdisplays2.pdf},
teaser = {teasers/hdrdisplays.png},
abstract = {The dynamic range of many real-world environments exceeds the capabilities of current display technology by several orders of magnitude. In this paper we discuss the design of two different display systems that are capable of displaying images with a dynamic range much more similar to that encountered in the real world. The first display system is based on a combination of an LCD panel and a DLP projector, and can be built from off-the-shelf components. While this design is feasible in a lab setting, the second display system, which relies on a custom-built LED panel instead of the projector, is more suitable for usual office workspaces and commercial applications. We describe the design of both systems as well as the software issues that arise. We also discuss the advantages and disadvantages of the two designs and potential applications for both systems.},
keywords = {high dynamic range, display},
note = {Republished by ACM},
}
@inbook{batmaz2022rotposjitter,
title = {Rotational and Positional Jitter in Virtual Reality Interaction},
author = {Batmaz, Anil Ufuk and Stuerzlinger, Wolfgang},
booktitle = {Everyday Virtual Reality},
publisher = {Springer},
year = {2022},
month = {May},
pages = {89–118},
doi = {https://doi.org/10.1007/978-3-031-05804-2_4},
pdf = {papers/rotposjitter.pdf},
teaser = {teasers/rotposjitter.png},
abstract = {One of the elements that affect 3D tracking performance in Virtual Reality (VR) systems is fluctuations in the signal, called jitter, which occurs regardless of the sensor technology used. In real-life VR systems, positional and rotational jitter can be found in all tracked objects, including the headset, controllers, or other trackers. Previous work had identified that ±0.5° rotational jitter negatively affects user performance for distal pointing. Yet, they also found that even using a second controller to reduce the “Heisenberg effect” introduced by the button press does not address the problem completely. Moreover, with jitter on the position of a virtual object, user performance significantly decreases with jitter above one fourth of the size of that virtual object. Still, users preferred to have positional jitter on a virtual target rather than rotational jitter on a VR controller. In this paper, we extended the previous literature by conducting a user study on angular jitter with controllers held with two different grip styles and targets at two different depth distances. The results revealed that user performance decreases (already) with ±0.25° jitter. Thus, we suggest that practitioners/developers who design 3D user interfaces, controllers, and interaction techniques for daily 3D VR usage should focus on reducing jitter. Decreasing jitter not only improves user performance, but also decreases frustration, which improves the user experience.},
keywords = {3D pointing, mid-air, jitter},
}
@inbook{dwyer2018immersive,
title = {Immersive analytics: An Introduction},
author = {Dwyer, Tim and Marriott, Kim and Isenberg, Tobias and Klein, Karsten and Riche, Nathalie and Schreiber, Falk and Stuerzlinger, Wolfgang and Thomas, Bruce H.},
booktitle = {Immersive Analytics},
publisher = {Springer},
year = {2018},
month = {Oct},
volume = {LNCS 11190},
pages = {1-23},
doi = {https://doi.org/10.1007/978-3-030-01388-2_1},
pdf = {papers/IAchapter1_Intro.pdf},
teaser = {teasers/iabook.png},
abstract = {Immersive Analytics is a new research initiative that aims to remove barriers between people, their data and the tools they use for analysis and decision making. Here we clarify the aims of immersive analytics research, its opportunities and historical context, as well as providing a broad research agenda for the field. In addition, we review how the term immersion has been used to refer to both technological and psychological immersion, both of which are central to immersive analytics research.},
keywords = {immersive analytics, visualization, visual analytics},
}
@inbook{marriott2018immersive,
title = {Immersive Analytics: Time to Reconsider the Value of {3D} for Information Visualisation},
author = {Marriott, Kim and Chen, Jian and Hlawatsch, Marcel and Itoh, Takayuki and Nacenta, Miguel A. and Reina, Guido and Stuerzlinger, Wolfgang},
booktitle = {Immersive Analytics},
publisher = {Springer},
year = {2018},
month = {Oct},
volume = {LNCS 11190},
pages = {25-55},
doi = {https://doi.org/10.1007/978-3-030-01388-2_2},
pdf = {papers/IAchapter2_3DVis.pdf},
teaser = {teasers/iabook.png},
abstract = {Modern virtual reality display technologies engender spatial immersion by using a variety of depth cues such as perspective and head-tracked binocular presentation to create visually realistic 3D worlds. While 3D visualisations are common in scientific visualisation, they are much less common in information visualisation. In this chapter we explore whether immersive analytic applications should continue to use traditional 2D information visualisations or whether there are situations when 3D may offer benefits. We identify a number of potential applications of 3D depth cues for abstract data visualisation: using depth to show an additional data dimension, such as in 2.5D network layouts, views on non-flat surfaces and egocentric views in which the data is placed around the viewer, and visualising abstract data with a spatial embedding. Another important potential benefit is the ability to arrange multiple views in the 3D space around the user and to attach abstract visualisations to objects in the real world.},
keywords = {immersive analytics, visual analytics, 3D visualization},
}
@inbook{bueschel2018interaction,
title = {Interaction for Immersive Analytics},
author = {Büschel, Wolfgang and Chen, Jian and Dachselt, Raimund and Drucker, Steven and Dwyer, Tim and Görg, Carsten and Isenberg, Tobias and Kerren, Andreas and North, Chris and Stuerzlinger, Wolfgang},
booktitle = {Immersive Analytics},
publisher = {Springer},
year = {2018},
month = {Oct},
volume = {LNCS 11190},
pages = {95-138},
doi = {https://doi.org/10.1007/978-3-030-01388-2_4},
pdf = {papers/IAchapter4_Interaction.pdf},
teaser = {teasers/iabook.png},
abstract = {In this chapter, we briefly review the development of natural user interfaces and discuss their role in providing human-computer interaction that is immersive in various ways. Then we examine some opportunities for how these technologies might be used to better support data analysis tasks. Specifically, we review and suggest some interaction design guidelines for immersive analytics. We also review some hardware setups for data visualization that are already archetypal. Finally, we look at some emerging system designs that suggest future directions.},
keywords = {immersive analytics, visualization, visual analytics},
}
@inbook{stuerzlinger2018immersive,
title = {Immersive human-centered computational analytics},
author = {Stuerzlinger, Wolfgang and Dwyer, Tim and Drucker, Steven and Görg, Carsten and North, Chris and Scheuermann, Gerik},
booktitle = {Immersive Analytics},
publisher = {Springer},
year = {2018},
month = {Oct},
volume = {LNCS 11190},
pages = {139-163},
doi = {https://doi.org/10.1007/978-3-030-01388-2_5},
pdf = {papers/IAchapter5_humancentered.pdf},
teaser = {teasers/iabook.png},
abstract = {In this chapter we seek to elevate the role of the human in human-machine cooperative analysis through a careful consideration of immersive design principles. We consider both strategic immersion through more accessible systems as well as enhanced understanding and control through immersive interfaces that enable rapid workflows. We extend the classic sensemaking loop from visual analytics to incorporate multiple views, scenarios, people, and computational agents. We consider both sides of machine/human collaboration: allowing the human to more fluidly control the machine process; and also allowing the human to understand the results, derive insights and continue the analytic cycle. We also consider system and algorithmic implications of enabling real-time control and feedback in immersive human-centered computational analytics.},
keywords = {immersive analytics, visualization, visual analytics, collaboration},
}
@inbook{marriott2018just,
title = {Just 5 Questions: Toward a Design Framework for Immersive Analytics},
author = {Marriott, Kim and Chen, Jian and Hlawatsch, Marcel and Itoh, Takayuki and Nacenta, Miguel A. and Reina, Guido and Stuerzlinger, Wolfgang},
booktitle = {Immersive Analytics},
publisher = {Springer},
year = {2018},
month = {Oct},
volume = {LNCS 11190},
pages = {259-288},
doi = {https://doi.org/10.1007/978-3-030-01388-2_9},
pdf = {papers/IAchapter9_5Questions.pdf},
teaser = {teasers/iabook.png},
abstract = {We present an initial design framework for immersive analytics based on Brehmer and Munzner's "What-Why-How" data visualisation framework. We extend their framework to take into account Who are the people or teams of people who are going to use the system, and Where is the system to be used and what are the available devices and technology. In addition, the How component is extended to cater for collaboration, multisensory presentation, interaction with an underlying computational model, degree of fidelity and organisation of the workspace around the user. By doing so we provide a framework for understanding immersive analytics research and applications as well as clarifying how immersive analytics differs from traditional data visualisation and visual analytics.},
keywords = {immersive analytics, visualization, visual analytics},
}
@inbook{stuerzlinger2014considerations,
title = {Considerations for Targets in {3D} Pointing Experiments},
author = {Stuerzlinger, Wolfgang and Teather*, Robert J.},
booktitle = {{HCI} Korea},
series = {HCIK '15},
year = {2014},
commented-year = {2015},
month = {Dec},
commented-month = {Jan},
pages = {162–168},
url = {https://dl.acm.org/doi/abs/10.5555/2729485.2729510},
pdf = {papers/considerations.pdf},
teaser = {teasers/considerations.png},
abstract = {We identify various tradeoffs in the design of 3D pointing experiments based on Fitts' law and the ISO9241-9 methodology. The advantages and disadvantages of several approaches for such experiments are analyzed and compared against each other. Results of an experiment that investigates various visual aids are presented as evidence. We conclude with recommendations for 3D pointing experiments and avenues of future work.},
keywords = {3D pointing},
}
@inbook{stuerzlinger2011value,
title = {The Value of Constraints for {3D} User Interfaces},
author = {Stuerzlinger, Wolfgang and Wingrave*, Chad},
booktitle = {Virtual Realities},
publisher = {Springer},
year = {2011},
month = {Jan},
pages = {203-224},
doi = {https://doi.org/10.1007/978-3-211-99178-7_11},
pdf = {papers/valueconstraints.pdf},
abstract = {User interfaces to three-dimensional environments are becoming more and more popular. Today this trend is fuelled through the introduction of social communication via virtual worlds, console and computer games, as well as 3D televisions.
We present a synopsis of the relevant abilities and restrictions introduced by both input and output technologies, as well as an overview of related human capabilities and limitations, including perceptual and cognitive issues. Partially based on this, we present a set of guidelines for 3D user interfaces. These guidelines are intended for developers of interactive 3D systems, such as computer and console games, 3D modeling packages, augmented reality systems, computer aided design systems, and virtual environments. The guidelines promote techniques, such as using appropriate constraints, that have been shown to work well in these types of environments.},
keywords = {3D user interfaces, constraints},
}
@comment{************************conference_articles************************}
@inproceedings{gemici2026crossingrealities,
title = {Crossing Realities Has a Cost: Evaluating AR Second Screens for AI-Assisted Desktop Authoring},
author = {Gemici*, Mucahit and Bashar*, Mohammad Raihanul and Stuerzlinger, Wolfgang and Phadnis, Vrushank and Batmaz, Anil Ufuk},
booktitle = {Symposium on Spatial User Interaction},
publisher = {ACM},
series = {SUI '26},
year = {2026},
month = {Oct},
commented-articleno = {2},
numpages = {12},
commented-doi = {https://doi.org/10.1145/00000.00000},
commented-pdf = {papers/crossingrealities.pdf},
commented-teaser = {teasers/crossingrealities.png},
abstract = {AI-assisted authoring requires users to frequently exchange user-generated and AI-generated content between a primary workspace and a Large Language Model (LLM) assistant. Such repetitive actions can fragment attention and compete for limited display space. While Augmented Reality (AR) has been proposed as a way to extend desktop workspaces with virtual displays, just adding a spatial display area does not address the repeated attention shifts, input-focus changes, and content-transfer steps required in LLM-assisted workflows. This creates a gap in understanding whether AR second screens support such workflows or introduce cross-reality transition costs that limit their effectiveness. To investigate this gap, we designed an AR-Second-Screen system around a unified keyboard-and-mouse interaction model and evaluated it against Single-Screen and Dual-Screen desktop setups. Results show that Dual-Screen remained more efficient than AR-Second-Screen, with significantly lower task completion time and switching cost. AR-Second-Screen also produced higher task and LLM idle ratios, indicating re-engagement costs when users crossed between physical and virtual workspaces. At the same time, participants rated AR positively and preferred it significantly over Single-Screen, with no significant difference in preference compared to Dual-Screen. These findings show that spatially extending AI-assisted workflows into AR can be appealing, yet effective cross-reality interfaces must minimize transition costs rather than just simply adding a virtual display space.},
keywords = {extended reality, LLM, crossing realities},
note = {Conditionally accepted, to appear},
}
@inproceedings{noh2026drattention,
title = {Exploring Diminished Reality for Attention Support: A Co-Design Study with Students with ADHD},
author = {Noh+, Alex and Safikhani+, Audrey and Zhu*, Anjun and Stuerzlinger, Wolfgang and Kim, Lawrence},
booktitle = {Designing Interactive Systems},
publisher = {ACM},
series = {DIS '26},
year = {2026},
month = {Jun},
pages = {891-903},
doi = {https://doi.org/10.1145/3800645.3813095},
pdf = {papers/drattention.pdf},
commented-video = {videos/drattention.mp4},
teaser = {teasers/drattention.png},
abstract = {Diminished Reality (DR) modifies or removes elements of the perceived environment. We explored DR for attention support through diary studies, interviews, and speculative co-design with 15 university students with ADHD. Participants described a persistent gap between intention and attention, and the use of externalization strategies that encounter fundamental limits in physical reality. In co-design, rather than reasoning from visual operations, participants articulated which properties of stimuli they needed to perceive versus filter, revealing cases where visual diminishment does not reliably map to attentional diminishment. We contribute rich descriptive data on the attentional challenges and DR preferences of students with ADHD, and propose Attentional Diminishment, a sensitizing concept that reframes DR for attention support from visual outcomes to attentional effects.},
keywords = {diminished reality, filtered reality, adhd, attention deficit hyperactivity disorder},
}
@inproceedings{amini2026steeringthroughput3d,
title = {Improving Steering Law Throughput Calculation by Defining Effective Parameters in 3D Virtual Environments},
author = {Amini*, Mohammadreza and Stuerzlinger, Wolfgang and Yamanaka, Shota and Liang, Hai-Ning and Batmaz, Anil Ufuk},
booktitle = {Conference on Human Factors in Computing Systems},
publisher = {ACM},
series = {CHI '26},
year = {2026},
month = {Apr},
articleno = {1141},
numpages = {20},
doi = {https://doi.org/10.1145/3772318.3790579},
pdf = {papers/steeringthroughput3d.pdf},
video = {videos/steeringthroughput3d.mp4},
teaser = {teasers/steeringthroughput3d.png},
abstract = {Throughput is a widely used performance metric, combining speed and accuracy into a single measure, while reducing the effect of subjective speed–accuracy trade-offs. Despite its wide application in 2D steering tasks, its direct extension to 3D presents unique challenges since 3D trajectories exhibit higher variability, and perceptual–motor factors undermine existing formulations. Consequently, throughput has not been systematically adopted for evaluating steering in 3D virtual environments. In this paper, using a controlled virtual reality user study with a ring-and-wire task, we introduce and validate a novel throughput formulation for 3D steering based on the bivariate standard deviation of the trajectory for the effective width calculation. Our results show that this formulation provides smoother throughput values across subjective speed–accuracy differences and improves model fit compared to traditional approaches. This work advances our theoretical understanding of the Steering law in 3D contexts, provides researchers and practitioners with a robust evaluation method, and establishes a foundation for future studies of complex 3D trajectory interactions.},
keywords = {3D steering, 3D user interface, 3D interaction, trajectory-based interaction, behavior modeling},
}
@inproceedings{turkmen2026handvis,
title = {Investigating Adaptive Hand Visibilities for Accurate 3D User Interactions in Augmented Reality},
author = {Turkmen*, Rumeysa and Hatira*, Nour and Teather, Robert J and Kersten-Oertel, Marta and Stuerzlinger, Wolfgang and Batmaz, Anil Ufuk},
booktitle = {Conference on Virtual Reality and {3D} User Interfaces Abstracts and Workshops, Workshop on Novel Input Devices and Interaction Techniques at {VR}},
publisher = {IEEE},
series = {NIDIT '26},
year = {2026},
month = {Mar},
pages = {338-343},
doi = {https://doi.org/10.1109/VRW70859.2026.00067},
pdf = {papers/handvis.pdf},
teaser = {teasers/handvis.png},
commented-video = {videos/handvis.mp4},
abstract = {Augmented Reality (AR) tasks that require fine motor control often rely on visual hand representations, yet fully visible hands can introduce occlusion and reduce accuracy. In this work, we investigate adaptive hand visualization techniques that dynamically adjust hand visibility based on the current interaction phase to improve accuracy in AR. We designed an AR-based pedicle screw placement task, in which users insert virtual screws into a physical spine model. To evaluate how hand visualization affects task performance, we conducted a user study with 15 participants who performed the task under five hand visualization conditions: Opaque, Transparent, Invisible, Speed-based and Position-based visibility. Our results show that adaptive visualization techniques significantly improve screw placement accuracy compared to the commonly used opaque hand representation. These findings demonstrate the benefits of dynamically adapting hand visibility can support accuracy-critical interactions.},
keywords = {hand visibility, 3D docking},
}
@inproceedings{zhao2026hybridsthfp,
title = {A User-Friendly Accurate Bare-Handed Manipulation Technique for Distant Objects in Virtual Reality},
author = {Zhao*, Di Bill and Stuerzlinger, Wolfgang},
booktitle = {Conference on Virtual Reality and {3D} User Interfaces Abstracts and Workshops, Workshop on Novel Input Devices and Interaction Techniques at {VR}},
publisher = {IEEE},
series = {NIDIT '26},
year = {2026},
month = {Mar},
pages = {373-378},
doi = {https://doi.org/10.1109/VRW70859.2026.00073},
pdf = {papers/hybridsthfp.pdf},
teaser = {teasers/hybridsthfp.png},
video = {videos/hybridsthfp.mp4},
abstract = {Bare-hand interaction is now common in virtual reality, but does not afford accurate manipulation of distant objects. Prior approaches rely on ray-casting, motion scaling, proxies, or near-field widgets, often trading precision for speed or increasing cognitive and physical demand. We present two bare-hand techniques for distant object manipulation: Scaled Two-Hand Finger-Palm (STHFP), which uses the non-dominant hand as a control surface for precise manipulation, and HYBRID, which combines fast ray-based positioning with two-handed refinement.
Results from our user study comparing STHFP and HYBRID against scaled bare-hand HOMER show that both new techniques significantly improve positional and rotational accuracy while reducing physical workload. While STHFP requires more interaction time, HYBRID achieves a balanced trade-off between speed and precision. Qualitative findings further reveal how constraint-based control and staged workflows shape user strategies and perceived effort. Together, our results demonstrate that leveraging the hand as a control surface can enable accurate, usable, and controller-free manipulation of distant objects in VR.},
keywords = {hand interaction, bare-hand, 3D manipulation, 3D positioning, 3D rotation, 3D pose},
}
@inproceedings{liu2026scaledmouse,
title = {Scaled Mouse: An Efficient and Accurate Interaction Technique for 3D Docking in Seated VR},
author = {Liu*, Xinpeng and Zhao*, Di Bill and Stuerzlinger, Wolfgang},
booktitle = {Conference on Virtual Reality and {3D} User Interfaces},
publisher = {IEEE},
series = {VR '26},
year = {2026},
month = {Mar},
pages = {718-728},
doi = {https://doi.org/10.1109/VR67842.2026.00091},
pdf = {papers/scaledmouse.pdf},
video = {videos/scaledmouse.mp4},
teaser = {teasers/scaledmouse.png},
abstract = {This paper presents an empirical evaluation of mouse-based interaction in seated Virtual Reality (VR) scenarios as an alternative to traditional VR controllers. We introduce Scaled Mouse, an interaction technique that shows the position of the real mouse in VR and maps standard mouse actions to 3D object manipulation using velocity-based scaling. We present two user studies assessing this method. In the first study, we compared a VR controller against our mouse-based method for manipulation tasks. Results show that the mouse consistently achieved higher rotation accuracy in 3D rotation and docking tasks than the controller, while maintaining comparable task completion times. Building on prior scaled interaction techniques, our second study investigated mouse interaction in a productivity-oriented scenario where users could combine 3D manipulation with a 2D adjustment panel. Scaled Mouse interaction was significantly faster and more accurate than the controller for 3D docking tasks and was rated significantly higher in usability and workload measures. Together, these findings establish the mouse as a viable and effective input device for seated VR contexts, offering both familiarity and accuracy advantages over controllers, particularly for professional and productivity-focused applications.},
keywords = {3D pointing, 3D selection, 3D manipulation},
}
@inproceedings{amini2025tunnelsvswires,
title = {Tunnels vs. Wires: A Comparative Analysis of Two 3D Steering Tasks in Virtual Environments},
author = {Amini*, Mohammadreza and Stuerzlinger, Wolfgang and Yamanaka, Shota and Liang, Hai-Ning and Batmaz, Anil Ufuk},
booktitle = {31st Symposium on Virtual Reality Software and Technology},
publisher = {ACM},
series = {VRST '25},
year = {2025},
month = {Nov},
articleno = {15},
numpages = {11},
doi = {https://doi.org/10.1145/3756884.3766023},
pdf = {papers/tunnelsvswires.pdf},
video = {videos/tunnelsvswires.mp4},
teaser = {teasers/tunnelsvswires.png},
abstract = {Steering involves continuous movement along constrained paths, well-studied in 2D. The extensions to 3D using the Ring-and-Wire and Ball-and-Tunnel tasks were often treated as interchangeable in previous work. In this paper, we directly compare these two tasks through a within-subjects user study (n = 18) with varying 3D path orientations. The results show that Ring-and-Wire significantly outperformed Ball-and-Tunnel, with 17.17% lower task time, 21.65% higher throughput, and 21.52% faster average speed. Participants also preferred Ring-and-Wire and reported lower workload. Visual ambiguity, especially near the tunnel's rear surface, complicated spatial perception in the Ball-and-Tunnel task. We thus recommend that future studies choose 3D steering tasks carefully for experiments, as the two tasks are not interchangeable.},
keywords = {3D steering},
award = {This work was nominated for a Best Paper Award},
}
@inproceedings{panda2025evaluatingdyndash,
title = {Evaluating the Utility of Multiple Workspaces and Easy Chart Creation for Visual Analytics},
author = {Panda, Swaroop and Stuerzlinger, Wolfgang},
booktitle = {Human-Computer Interaction},
commented-publisher = {Springer},
series = {HCI International '25},
year = {2025},
month = {May},
volume = {LNCS 15766},
pages = {103-122},
doi = {https://doi.org/10.1007/978-3-031-93835-1_7},
pdf = {papers/evaluatingdyndash.pdf},
teaser = {teasers/evaluatingdyndash.png},
abstract = {Visual Analytics involves interactive visual exploration of data sets. Interaction methods allow data analysts to explore different aspects and investigate various hypotheses. This work investigates if chart creation and multiple tabs enable analysts to pursue multiple hypotheses or analysis paths better than other approaches. To evaluate this, new features were added to an existing Visual Analytics prototype with a multi-tab design. Two user studies with professional data analysts confirmed the utility of our approach within the Visual Analytics process. Analysts can easily work within multiple workspaces, enabling them to frame and track multiple hypotheses about the data and pursue different exploratory analysis paths, ultimately yielding more comprehensive analysis outcomes.},
keywords = {visual analytics},
}
@inproceedings{le2025redirectedstepper,
title = {RedirectedStepper: Exploring Walking-In-Place Locomotion in VR Using a Mini Stepper for Ascents},
author = {Le*, Quang-Tri and Nham*, Huynh-Duc and Tran, Tanh Quang and Fjeld, Morten and Stuerzlinger, Wolfgang and Zank, Markus and Tran, Minh-Triet and Le, Khanh-Duy},
booktitle = {Conference on Human Factors in Computing Systems},
publisher = {ACM},
series = {CHI '25},
year = {2025},
month = {Apr},
articleno = {614},
numpages = {17},
doi = {https://doi.org/10.1145/3706598.3713313},
pdf = {papers/redirectedstepper.pdf},
video = {videos/redirectedstepper.mp4},
teaser = {teasers/redirectedstepper.png},
abstract = {Walking on inclined surfaces is common in some Virtual Reality (VR) scenarios, for instance when moving between floors of a building, climbing a tower, or ascending a virtual mountain. Existing approaches enabling realistic walking experiences in such settings typically require the user to use bulky walking-in-place hardware or to walk in a physical area. Addressing this challenge, we present RedirectedStepper, a locomotion technique leveraging a novel device based on a mini exercise stepper to provide realistic VR staircase walking experiences by alternating the tilt of the two stepper pedals. RedirectedStepper employs a new exponential mapping function to visually morph the user’s real foot motion to a corresponding curved path in the virtual environment (VE). Combining this stepper and the visual mapping function provides an in-place locomotion technique allowing users to virtually ascend an infinite staircase or slope while walking-in-place (WIP). We conducted three within-subject user studies (n=36) comparing RedirectedStepper with a WIP locomotion technique using the Kinect. Our studies indicate that RedirectedStepper improves the users’ sense of realism in walking on staircases in VR. Based on a set of design implications derived from the user studies, we developed SnowRun, a VR exergame application, demonstrating the use of the RedirectedStepper concept.},
keywords = {locomotion, 3d navigation},
}
@inproceedings{amini2025review3dfitts,
title = {A Systematic Review of Fitts' Law in 3D Extended Reality},
author = {Amini*, Mohammadreza and Stuerzlinger, Wolfgang and Teather, Robert J and Batmaz, Anil Ufuk},
booktitle = {Conference on Human Factors in Computing Systems},
publisher = {ACM},
series = {CHI '25},
year = {2025},
month = {Apr},
articleno = {625},
numpages = {25},
doi = {https://doi.org/10.1145/3706598.3713623},
pdf = {papers/review3dfitts.pdf},
teaser = {teasers/review3dfitts.png},
abstract = {Fitts' law is widely used as an evaluation tool for pointing or selection tasks, evolving into diverse applications, including 3D extended reality (XR) environments like virtual, augmented, and mixed reality. Despite standards like ISO 9241:411, the application of Fitts' law varies significantly across studies, complicating comparisons and undermining the reliability of findings in 3D XR research. To address this, we conducted a systematic review of 1957 papers, focusing on 122 studies that used Fitts' law in 3D XR user experiments. Our analysis shows that over half of these studies referenced Fitts' law without thoroughly investigating throughput, movement time, or error rate. We performed an in-depth meta-analysis to examine how Fitts' law is incorporated into research. By highlighting trends and inconsistencies, and making recommendations this review aims to guide researchers in designing and performing more effective and consistent Fitts-based studies in 3D XR, enhancing the quality and impact of future research.},
keywords = {3d pointing, 3d selection},
}
@inproceedings{srabonee2025hexacotext,
title = {Exploring the Impacts of HEXACO Personality Traits on Text Composition and Transcription},
author = {Srabonee*, Jannatul Ferdous and Alharbi, Ohoud and Stuerzlinger, Wolfgang and Arif, Ahmed Sabbir},
booktitle = {Conference on Human Factors in Computing Systems},
publisher = {ACM},
series = {CHI '25},
year = {2025},
month = {Apr},
articleno = {577},
numpages = {24},
doi = {https://doi.org/10.1145/3706598.3714149},
pdf = {papers/hexacotext.pdf},
teaser = {teasers/hexacotext.png},
abstract = {This study investigates the relationship between the HEXACO personality traits and text entry behaviors in composition and transcription tasks. By analyzing metrics such as entry speed, accuracy, editing efforts, and readability, we identified correlations between specific traits and text entry performance. In composition, honesty-humility and agreeableness were the strongest predictors, correlating significantly with composition time, text length, and editing efforts. In transcription, openness, honesty-humility, and agreeableness influenced performance, though no single trait consistently predicted all metrics. Interestingly, extraversion did not show strong correlations in either task, despite its established link to composition performance in academic contexts. These findings suggest that personality traits affect text entry behavior differently depending on the task, with creative tasks like composition being shaped by distinct traits compared to repetitive tasks like transcription. This research provides valuable insights into the relationship between personality and text entry, opening avenues for personalizing interaction systems based on individual traits.},
keywords = {text entry, personality, text composition, transcription},
}
@inproceedings{mutasim2025gazemtd,
title = {There Is More to Dwell Than Meets the Eye: Toward Better Gaze-Based Text Entry Systems With Multi-Threshold Dwell},
author = {Mutasim*, Aunnoy K and Bashar*, Mohammad Raihanul and Lutteroth, Christof and Batmaz, Anil Ufuk and Stuerzlinger, Wolfgang},
booktitle = {Conference on Human Factors in Computing Systems},
publisher = {ACM},
series = {CHI '25},
year = {2025},
month = {Apr},
articleno = {1088},
numpages = {18},
doi = {https://doi.org/10.1145/3706598.3713781},
pdf = {papers/gazemtd.pdf},
video = {videos/gazemtd.mp4},
teaser = {teasers/gazemtd.png},
abstract = {Dwell-based text entry seems to peak at 20 words per minute (WPM). Yet, little is known about the factors contributing to this limit, except that it requires extensive training. Thus, we conducted a longitudinal study, broke the overall dwell-based selection time into six different components, and identified several design challenges and opportunities. Subsequently, we designed two novel dwell keyboards that use multiple yet much shorter dwell thresholds: Dual-Threshold Dwell (DTD) and Multi-Threshold Dwell (MTD). The performance analysis showed that MTD (18.3 WPM) outperformed both DTD (15.3 WPM) and the conventional Constant-Threshold Dwell (12.9 WPM). Notably, absolute novices achieved these speeds within just 30 phrases. Moreover, MTD’s performance is also the fastest-ever reported average text entry speed for gaze-based keyboards. Finally, we discuss how our chosen parameters can be further optimized to pave the way toward more efficient dwell-based text entry.},
keywords = {gaze, eye tracking, text entry},
}
@inproceedings{zhao2025thfp,
title = {A Novel Bare-Handed Manipulation Technique for Distant Objects in Virtual Reality},
author = {Zhao*, Di Bill and Stuerzlinger, Wolfgang},
booktitle = {Conference on Virtual Reality and {3D} User Interfaces Abstracts and Workshops, Workshop on Novel Input Devices and Interaction Techniques at {VR}},
publisher = {IEEE},
series = {NIDIT '25},
year = {2025},
month = {Mar},
pages = {353-360},
doi = {https://doi.org/10.1109/VRW66409.2025.00083},
pdf = {papers/thfp.pdf},
teaser = {teasers/thfp.png},
video = {videos/thfp.mp4},
abstract = {Advancements in bare-hand tracking technology, featured in many modern virtual reality (VR) headsets, have enabled intuitive hand interaction for proximate 3D object manipulation. However, manipulating distant 3D objects in VR with bare hands remains a challenge, and our work explores the potential of two-handed interaction in this context. Previous work highlighted the ease of using the non-dominant wrist as an interactive surface for interaction, by pointing at it with the dominant hand's index finger. Our research expands this paradigm by extending the interactive zone to the entire non-dominant hand so that the user can interact with their index finger on the non-dominant hand’s fingers and palm to adeptly and precisely manipulate a distant 3D object's position and rotation. Through a user study, we compared our Two-Hand Fingertip-Palm technique (THFP) with a bare-hand variant of HOMER (BHOMER) on efficiency, accuracy, and usability. The results demonstrate a notable accuracy improvement (at least 75% better), especially in complex tasks, such as hanging a painting on a slanted wall, albeit at the expense of efficiency (about 47% slower) compared to BHOMER. While BHOMER is faster, it also exhibits more variation in time, and at the average BHOMER end time, our new technique is still substantially more accurate than BHOMER. Further, our method received a more favorable rating on the System Usability Scale (SUS), underscoring our approach's user-centric and intuitive design. Further, the NASA Task Load Index (NASA-TLX) indicates that THFP not only improves the task completion rate and user satisfaction but also reduces the cognitive, physical, and temporal demand for users. In addition, we discuss insights into the integration of constraints, error prevention, and the facilitation of consistent interaction. Our findings lay a solid foundation for using our new method in the quickly advancing VR field.},
keywords = {hand interaction, bare-hand, 3D manipulation, 3D positioning, 3D rotation, 3D pose},
}
@inproceedings{xu2025predictingray,
title = {Predicting Ray Pointer Landing Poses in VR Using Multimodal LSTM-Based Neural Networks},
author = {Xu*, Wenxuan and Wei*, Yushi and Hu*, Xuning and Stuerzlinger, Wolfgang and Wang, Yuntao and Liang, Hai-Ning},
booktitle = {Conference on Virtual Reality and {3D} User Interfaces},
publisher = {IEEE},
series = {VR '25},
year = {2025},
month = {Mar},
pages = {93-103},
doi = {https://doi.org/10.1109/VR59515.2025.00034},
pdf = {papers/predictingray.pdf},
teaser = {teasers/predictingray.png},
abstract = {Target selection is one of the most fundamental tasks in VR interaction systems. Prediction heuristics can provide users with a smoother interaction experience in this process. Our work aims to predict the ray landing pose for hand-based raycasting selection in Virtual Reality (VR) using a Long Short-Term Memory (LSTM)-based neural network with time-series data input of speed and distance over time from three different pose channels: hand, Head-Mounted Display (HMD), and eye. We first conducted a study to collect motion data from these three input channels and analyzed these movement behaviors. Additionally, we evaluated which combination of input modalities yields the optimal result. A second study validates raycasting across a continuous range of distances, angles, and target sizes. On average, our technique's predictions were within 4.6° of the true landing pose when 50% of the way through the movement. We compared our LSTM neural network model to a kinematic information model and further validated its generalizability in two ways: by training the model on one user's data and testing on other users (cross-user) and by training on a group of users and testing on entirely new users (unseen users). Compared to the baseline and a previous kinematic method, our model increased prediction accuracy by a factor of 3.5 and 1.9, respectively, when 40% of the way through the movement.},
keywords = {3D pointing, 3D selection, ray pointing},
}
@inproceedings{gemici2024speedcontrol,
title = {Object Speed Control Based on Signed Distance Field for Mid-Air Object Manipulation in Virtual Reality},
author = {Gemici*, Mucahit and Stuerzlinger, Wolfgang and Batmaz, Anil Ufuk},
booktitle = {International Symposium on Mixed and Augmented Reality},
publisher = {IEEE},
series = {ISMAR '24},
year = {2024},
month = {Oct},
pages = {465-474},
doi = {https://doi.org/10.1109/ISMAR62088.2024.00061},
pdf = {papers/speedcontrol.pdf},
video = {videos/speedcontrol.mp4},
teaser = {teasers/speedcontrol.png},
abstract = {In Virtual Reality (VR) applications, interacting with distant objects relies heavily on mid-air object manipulation. However, the inherent distance between the user and the object often restricts precise movement capabilities. This paper introduces the Signed Distance Field (SDF) algorithm as a method for mid-air object manipulation, and combines it with the ray casting interaction technique to investigate its effect on user performance and user experience. To increase the accuracy of the movements, we leverage the speed-accuracy trade-off to dynamically adjust object manipulation speed based on the SDF algorithm's output. Our study, involving 18 participants, examines the effects of SDF across three different tasks with different complexities. Our results showed that ray casting with SDF reduces the number of errors in complex tasks without slowing down the participants. Further, our proposed method significantly improved the user experience for complex tasks. We hope that our proposed assistive system, designed for tasks and applications, can be used as an interaction technique to enable more accurate manipulation of distant objects in the fields like surgical planning, architecture, and games.},
keywords = {3D manipulation, 3D posing, wire task},
}
@inproceedings{jiang2024flexdoc,
title = {FlexDoc: Flexible Document Adaptation through Optimizing both Content and Layout},
author = {Jiang*, Yue and Lutteroth, Christof and Jain, Rajiv and Tensmeyer, Christopher and Manjunatha, Varun and Stuerzlinger, Wolfgang and Morariu, Vlad},
booktitle = {Symposium on Visual Languages and Human-Centric Computing},
publisher = {IEEE},
series = {VL/HCC '24},
year = {2024},
month = {Sep},
pages={217-222},
doi = {https://doi.org/10.1109/VL/HCC60511.2024.00032},
pdf = {papers/flexdoc.pdf},
video = {videos/flexdoc.mp4},
teaser = {teasers/flexdoc.png},
abstract = {Designing adaptive documents that are visually appealing across various devices and for diverse viewers is a challenging task. This is due to the wide variety of devices and different viewer requirements and preferences. Alterations to a document’s content, style, or layout often necessitate numerous adjustments, potentially leading to a complete layout redesign. We introduce FLEXDOC, a framework for creating and consuming documents that seamlessly adapt to different devices, author, and viewer preferences and interactions. It eliminates the need for manually creating multiple document layouts, as FLEXDOC enables authors to define desired document properties using templates and employs both discrete and continuous optimization in a novel comprehensive optimization process, which leverages automatic text summarization and image carving techniques to adapt both layout and content during consumption dynamically. Further, we demonstrate FLEXDOC in real-world scenarios.},
keywords = {document layout, flexible documents, adaptive documents, responsive documents},
}
@inproceedings{kasahara2024steeringthroughput,
title = {Better Definition and Calculation of Throughput and Effective Parameters for Steering to Account for Subjective Speed-accuracy Tradeoffs},
author = {Kasahara*, Nobuhito and Oba*, Yosuke and Yamanaka, Shota and Batmaz, Anil Ufuk and Stuerzlinger, Wolfgang and Miyashita, Homei},
booktitle = {Conference on Human Factors in Computing Systems},
publisher = {ACM},
series = {CHI '24},
year = {2024},
month = {May},
articleno = {722},
pages = {1-18},
doi = {https://doi.org/10.1145/3613904.3642084},
pdf = {papers/steeringthroughput.pdf},
video = {videos/steeringthroughput.mp4},
teaser = {teasers/steeringthroughput.png},
abstract = {In Fitts' law studies to investigate pointing, throughput is used to characterize the performance of input devices and users, which is claimed to be independent of task difficulty or the user's subjective speed-accuracy bias.
While throughput has been recognized as a useful metric for target-pointing tasks, the corresponding formulation for path-steering tasks and its evaluation have not been thoroughly examined in the past. In this paper, we conducted three experiments using linear, circular, and sine-wave path shapes to propose and investigate a novel formulation for the effective parameters and the throughput of steering tasks. Our results show that the effective width substantially improves the fit to data with mixed speed-accuracy biases for all task shapes. Effective width also smoothed out the throughput across all biases, while the usefulness of the effective amplitude depended on the task shape. Our study thus advances the understanding of user performance in trajectory-based tasks.},
keywords = {steering, throughput},
}
@inproceedings{dash2024me911,
title = {Multimedia-Enabled 911: Exploring 911 Callers’ Experience of Call Taker Controlled Video Calling in Simulated Emergencies},
author = {Dash*, Punyashlok and Axtell, Benett and Geiskkovitch, Denise Y. and Neustaedter, Carman and Stuerzlinger, Wolfgang},
booktitle = {Conference on Human Factors in Computing Systems},
publisher = {ACM},
series = {CHI '24},
year = {2024},
month = {May},
articleno = {500},
pages = {1-15},
doi = {https://doi.org/10.1145/3613904.3643055},
pdf = {papers/me911.pdf},
video = {videos/me911.mp4},
teaser = {teasers/me911.png},
abstract = {Emergency response to large-scale disasters is often supported with multimedia from social media. However, while these features are common in everyday video calls, the complex needs of 911 and other systems make it difficult to directly incorporate these features. We assess an ME911 (Multimedia-Enabled 911) app to understand how the design will need to deviate from common norms and how callers will respond to those non-standard choices. We expand the role of 911 call taker control over emergency situations to the calling interface while incorporating key features like map-based location finding. Participants’ experiences in mock emergencies show the non-standard design helps callers in the unfamiliar setting of emergency calling yet it also causes confusion and delays. We find the need for emergency-specific deviations from design norms is supported by participant feedback. We discuss how broader system changes will support callers to use these non-standard designs during emergencies.},
keywords = {emergency, 911, video calling, teleconference, V4Space},
}
@inproceedings{yamanaka2024latencysteering,
title = {The Effect of Latency on Movement Time in Path-steering},
author = {Yamanaka, Shota and Stuerzlinger, Wolfgang},
booktitle = {Conference on Human Factors in Computing Systems},
publisher = {ACM},
series = {CHI '24},
year = {2024},
month = {May},
articleno = {622},
pages = {1-19},
doi = {https://doi.org/10.1145/3613904.3642316},
pdf = {papers/latencysteering.pdf},
video = {videos/latencysteering_application.mp4},
teaser = {teasers/latencysteering.png},
abstract = {In current graphical user interfaces, there exists a (typically unavoidable) end-to-end latency from each pointing-device movement to its corresponding cursor response on the screen, which is known to affect user performance in target selection, e.g., in terms of movement time (MTs). Previous work also reported that a long latency increases MTs in path-steering tasks, but the quantitative relationship between latency and MT had not been previously investigated for path-steering. In this work, we derive models to predict MTs for path-steering and evaluate them with five tasks: goal crossing as a preliminary task for model derivation, linear-path steering, circular-path steering, narrowing-path steering, and steering with target pointing. The results show that the proposed models yielded an adjusted R^2 > 0.94, with lower AICs and smaller cross-validation RMSEs than the baseline models, enabling more accurate prediction of MTs.},
keywords = {steering, latency},
}
@inproceedings{turkmen2024eyeconguide,
title = {EyeGuide & EyeConGuide: Gaze-based Visual Guides to Improve 3D Sketching Systems},
author = {Turkmen+, Rumeysa and Gelmez+, Zeynep Ecem and Batmaz, Anil Ufuk and Stuerzlinger, Wolfgang and Asente, Paul and Sarac, Mine and Pfeuffer, Ken and Barrera Machuca, Mayra Donaji},
booktitle = {Conference on Human Factors in Computing Systems},
publisher = {ACM},
series = {CHI '24},
year = {2024},
month = {May},
articleno = {178},
pages = {1-14},
doi = {https://doi.org/10.1145/3613904.3641947},
pdf = {papers/eyeconguide.pdf},
video = {videos/eyeconguide.mp4},
teaser = {teasers/eyeconguide.png},
abstract = {Visual guides in Virtual Reality sketching systems help to align strokes and raise accuracy. Guides that appear dynamically where one wants to draw have the potential to both lower the reliance on manual guide activation and improve the sketching experience. We propose novel guide techniques for sketching that exploit eye-tracking to modulate where a grid fragment appears. EyeGuide and EyeConGuide cause this grid fragment to appear spatially close to the user's intended sketches, with one relying on the user's eyes and the other on both the eyes and the hand location. In two user studies, we evaluated the techniques in basic and complex sketching tasks. The results show that gaze-based guides increased sketching accuracy compared to no guides, improved the system usability over manual activation, and were preferred by most users. Our research contributes highly usable techniques to assist accurate sketching and insights into multimodal gaze-contingent sketching.},
keywords = {eye tracking, gaze tracking, 3D sketching, 3D drawing},
}
@inproceedings{rind2024longitudinalehct,
title = {Eye-Hand Coordination Training: A Systematic Comparison of 2D, VR, and AR Screen Technologies and Task Motives},
author = {Rind*, Aliza and Zaugg+, Irene and Celik+, Elif and Stuerzlinger, Wolfgang and Ortega, Francisco and Batmaz, Anil Ufuk and Sarac, Mine},
booktitle = {Conference on Virtual Reality and {3D} User Interfaces},
publisher = {IEEE},
series = {VR '24},
year = {2024},
month = {Mar},
pages = {200-210},
doi = {https://doi.org/10.1109/VR58804.2024.00043},
pdf = {papers/longitudinalehct.pdf},
teaser = {teasers/longitudinalehct.png},
video = {videos/longitudinalehct.mp4},
abstract = {This study compares Augmented Reality (AR), Virtual Reality (VR), and 2D touchscreen approaches for eye-hand coordination training. We thoroughly analyze the motor performance of twenty participants throughout the course of a ten-session longitudinal study. Our study includes five different assessment criteria: speed, error rate, accuracy, precision, and none. We also analyze the participants' performance in terms of effective throughput as a novel evaluation criterion. The results showed that each task execution strategy has a different effect on one or more psychomotor characteristics of the trainee, which highlights the importance of the training program. We also showed that effective throughput is a candidate for monitoring the overall motor performance progress in eye-hand coordination training systems.},
keywords = {3D pointing, vergence-accomodation conflict, virtual hand},
}
@inproceedings{wagner2024taxivis,
title = {Reimagining TaxiVis through an Immersive Space-Time Cube Metaphor and Reflecting on Potential Benefits of Immersive Analytics for Urban Data Exploration},
author = {Wagner Filho*, Jorge and Silva, Claudio and Stuerzlinger, Wolfgang and Nedel, Luciana},
booktitle = {Conference on Virtual Reality and {3D} User Interfaces},
publisher = {IEEE},
series = {VR '24},
year = {2024},
month = {Mar},
pages = {827-838},
doi = {https://doi.org/10.1109/VR58804.2024.00102},
pdf = {papers/immersivetaxivis.pdf},
teaser = {teasers/immersivetaxivis.png},
video = {videos/immersivetaxivis.mp4},
url = {https://arxiv.org/abs/2402.00344},
abstract = {Recent studies suggest that immersion into 3D environments could increase the usability of 3D visualizations by facilitating 3D perception and easier interaction, and also better support collaboration between local or remote analysts. This is particularly relevant for domains with an obvious three-dimensional mapping, such as urban space-time data. To explore how a traditional visualization system could be adapted into an immersive framework, and how it could benefit from this, we decided to revisit a landmark paper presented ten years ago at IEEE VIS. TaxiVis, by Ferreira et al., enabled interactive spatial-temporal querying of a large dataset of taxi trips in New York City. Here, we reimagine how TaxiVis’ functionalities could be implemented and extended in a 3D immersive environment. Among the unique features we identify as being enabled by the Immersive TaxiVis prototype are alternative uses of the additional visual dimension, a fully-visual 3D spatio-temporal query framework, and the opportunity to explore the data at different scales and frames of reference. The intent behind our work is to complement and enhance established forms of visualization, not to replace them. Through reporting on our findings, and on the vision and reasoning behind our design decisions, we hope to contribute to the debate on how conventional and immersive visualization paradigms can help each other and also how the exploration of urban datasets can be facilitated in the coming years.},
keywords = {visual analytics, immersive analytics, space-time cube, 3D visualization, 3D interaction},
}
@inproceedings{batmaz2023gripstyle,
title = {Effect of Grip Style on Pointing in Head Mounted Displays},
author = {Batmaz, Anil Ufuk and Turkmen+, Rumeysa and Sarac, Mine and Barrera Machuca, Mayra Donaji and Stuerzlinger, Wolfgang},
booktitle = {International Symposium on Mixed and Augmented Reality},
publisher = {IEEE},
series = {ISMAR '23},
year = {2023},
month = {Oct},
pages = {425-433},
doi = {https://doi.org/10.1109/ISMAR59233.2023.00057},
pdf = {papers/gripstyle.pdf},
teaser = {teasers/gripstyle.png},
abstract = {When working in Virtual Reality (VR), the user's performance is affected by how the user holds the input device (e.g., controller), typically using either a precision or a power grip. Previous work examined these grip styles for 3D pointing at targets at different depths in peripersonal space. They found that participants had a lower error rate with the precision grip but no difference in movement speed, throughput, or interaction with target depth, but their experiment was potentially affected by tracking differences between devices. This paper reports an experiment that partially replicates and extends this study by evaluating the effect of grip style on the 3D selection of nearby targets with the same device. Furthermore, our experiment investigates the effect of the vergence-accommodation conflict (VAC) present in current stereo displays on 3D pointing in peripersonal space. Our results show that grip style significantly affects user performance. We hope that our results can guide developers, researchers, and designers when creating virtual environments.},
keywords = {3D pointing, vergence-accomodation conflict},
}
@inproceedings{batmaz2023reinvestigatingvac,
title = {Re-investigating the Effect of the Vergence-Accommodation Conflict on 3D Pointing},
author = {Batmaz, Anil Ufuk and Turkmen+, Rumeysa and Sarac, Mine and Barrera Machuca, Mayra Donaji and Stuerzlinger, Wolfgang},
booktitle = {29th Symposium on Virtual Reality Software and Technology},
publisher = {ACM},
series = {VRST '23},
year = {2023},
month = {Oct},
articleno = {8},
numpages = {10},
doi = {https://doi.org/10.1145/3611659.3615686},
pdf = {papers/reinvestigatingvac.pdf},
teaser = {teasers/reinvestigatingvac.png},
abstract = {The vergence-accommodation conflict (VAC) limits user performance in current Virtual Reality (VR) systems. In this paper, we investigate the effects of the VAC in a single focal VR system using three experimental conditions: with no VAC, with a constant VAC, and with a varying VAC. Previous work had yielded conflicting results, so we decided to re-investigate this issue. Eighteen participants performed an ISO 9241:411 task in a study that closely replicates previous work, except that the angle of the task space was rotated 20 degrees downward, to make the task less fatiguing to perform, which addresses a potential confound in previous work. We found that the varying VAC condition had worse performance than the other conditions, which indicates that the contrasting results in previous work were very likely due to biomechanical factors. We hope that our work contributes to the understanding of the influence of the VAC in VR systems and potential strategies for improving user experience and performance in immersive virtual environments.},
keywords = {3D pointing, vergence-accomodation conflict},
}
@inproceedings{han2023drseye,
title = {Dr.’s Eye: The Design and Evaluation of a Video Conferencing System to Support Doctor Appointments in Home Settings},
author = {Han*, Dongqi and Geiskkovitch, Denise Y. and Yuan, Ye and Mills*, Chelsea and Zhong*, Ce and Chen*, Amy Yo Sue and Stuerzlinger, Wolfgang and Neustaedter, Carman},
booktitle = {Conference on Human Factors in Computing Systems},
publisher = {ACM},
series = {CHI '23},
year = {2023},
month = {Apr},
articleno = {343},
numpages = {18},
doi = {https://doi.org/10.1145/3544548.3581350},
pdf = {papers/drseye.pdf},
video = {videos/drseye.mp4},
teaser = {teasers/drseye.png},
abstract = {The spread of COVID-19 has encouraged the practice of using video conferencing for family doctor appointments. Existing applications and devices face challenges in capturing the correct view of patients' bodies and supporting ease of use. We created Dr.’s Eye, a video conferencing prototype to support varying types of body exams in home settings. An exploratory study was conducted with patients in mock appointments to explore the use of our video system. Results show the benefits of providing more flexibility with a decoupled camera and display, and privacy protection by limiting the camera view. Yet, challenges remain in maneuvering two devices, presenting feedback of the camera view, coordinating camera work between the doctor and patient, and coping with discomfort in showing private body regions. This inspires future research on how to design a video system for doctor appointments.},
keywords = {teleconference, doctor},
}
@inproceedings{lee2023multiscaletransitions,
title = {Designing Viewpoint Transition Techniques in Multiscale Virtual Environments},
author = {Lee*, Jong-In and Asente, Paul and Stuerzlinger, Wolfgang},
booktitle = {Conference on Virtual Reality and {3D} User Interfaces},
publisher = {IEEE},
series = {VR '23},
year = {2023},
month = {Mar},
pages = {680-690},
doi = {https://doi.org/10.1109/VR55154.2023.00083},
pdf = {papers/multiscaletransitions.pdf},
video = {videos/multiscaletransitions.mp4},
teaser = {teasers/multiscaletransitions.png},
abstract = {Viewpoint transitions have been shown to improve users' spatial orientation and help them build a cognitive map when they are navigating an unfamiliar virtual environment. Previous work has investigated transitions in single-scale virtual environments, focusing on trajectories and continuity. We extend this work with an in-depth investigation of transition techniques in multiscale virtual environments (MVEs). We identify challenges in navigating MVEs with nested structures and assess how different transition techniques affect spatial understanding and usability. Through two user studies, we investigated transition trajectories, interactive control of transition movement, and speed modulation in a nested MVE. We show that some types of viewpoint transitions enhance users' spatial awareness and confidence in their spatial orientation and reduce the need to revisit a target point of interest multiple times.},
keywords = {3D navigation, multiscale virtual environment, transitions, speed control},
}
@inproceedings{batmaz2023virtualhandvac,
title = {Measuring the Effect of Stereo Deficiencies on Peripersonal Space Pointing},
author = {Batmaz, Anil Ufuk and Hudhud Mughrabi+, Moaaz and Sarac, Mine and Barrera Machuca, Mayra Donaji and Stuerzlinger, Wolfgang},
booktitle = {Conference on Virtual Reality and {3D} User Interfaces},
publisher = {IEEE},
series = {VR '23},
year = {2023},
month = {Mar},
pages = {1-11},
doi = {https://doi.org/10.1109/VR55154.2023.00063},
pdf = {papers/virtualhandvac.pdf},
teaser = {teasers/virtualhandvac.png},
abstract = {State-of-the-art Virtual Reality (VR) and Augmented Reality (AR) headsets rely on singlefocal stereo displays. For objects away from the focal plane, such displays create a vergence-accommodation conflict (VAC), potentially degrading user interaction performance. In this paper, we study how the VAC affects pointing at targets within arm's reach with virtual hand and raycasting interaction in current stereo display systems. We use a previously proposed experimental methodology that extends the ISO 9241-411:2015 multi-directional selection task to enable fair comparisons between selecting targets in different display conditions. We conducted a user study with eighteen participants and the results indicate that participants were faster and had higher throughput in the constant VAC condition with the virtual hand. We hope that our results enable designers to choose more efficient interaction methods in virtual environments.},
keywords = {3D pointing, vergence-accomodation conflict, virtual hand},
}
@inproceedings{shi2022groupalignment,
title = {Group-based Object Alignment in Virtual Reality Environments},
author = {Shi*, Rongkai and Zhang*, Jialin and Stuerzlinger, Wolfgang and Liang, Hai-Ning},
booktitle = {Symposium on Spatial User Interaction},
publisher = {ACM},
series = {SUI '22},
year = {2022},
month = {Dec},
articleno = {2},
numpages = {11},
doi = {https://doi.org/10.1145/3565970.3567682},
pdf = {papers/groupalign3D.pdf},
teaser = {teasers/groupalign3D.png},
abstract = {Group-based object alignment is an essential manipulation task, particularly for complex scenes. In conventional 2D user interfaces, such alignment tasks are generally achieved via a command/menu-based interface. Virtual reality (VR) head-mounted displays (HMDs) provide a rich immersive interaction experience, which opens more design options for group-based object alignment interaction techniques. However, object alignment techniques in immersive environments are underexplored. In this paper, we present four interaction techniques for 3 degrees-of-freedom translational alignments: AlignPanel, AlignWidget, AlignPin, and AlignGesture. We evaluated their performance, workload, and usability in a user study with 20 participants. Our results indicate different benefits and drawbacks of these techniques for group-based alignment in immersive systems. Based on the findings, we distill a set of design choices and recommendations for these techniques in various application scenarios.},
keywords = {3D positioning, 3D manipulation, alignment, 3D user interfaces},
}
@inproceedings{batmaz2022improvingperformance,
title = {Improving Effective Throughput Performance using Auditory Feedback in Virtual Reality Training Systems},
author = {Batmaz, Anil Ufuk and Yu*, Kangyou and Liang, Hai-Ning and Stuerzlinger, Wolfgang},
booktitle = {Symposium on Spatial User Interaction},
publisher = {ACM},
series = {SUI '22},
year = {2022},
month = {Dec},
articleno = {18},
numpages = {11},
doi = {https://doi.org/10.1145/3565970.3567702},
pdf = {papers/audiothroughput.pdf},
teaser = {teasers/audiothroughput.png},
abstract = {During the complex process of motor skill acquisition, novices might focus on different criteria, such as speed or accuracy, in their training. Previous research on virtual reality (VR) training systems has shown that effective throughput could also be used as such an assessment criterion. Effective throughput combines speed, accuracy, and precision into one measure, and can be influenced by auditory feedback. This paper investigates through a user study how to improve participants' effective throughput performance using auditory feedback. In the study, we mapped the speed and accuracy of the participants to the pitch of the auditory error feedback in an ISO 9241-411 multidirectional pointing task and evaluated participants' performance. The results showed it is possible to regulate the time or accuracy performance of the participants and thus the effective throughput. Based on the findings of our work, we also identify that effective throughput is an appropriate assessment criterion for VR training systems. We hope that our results can be used for VR training applications.},
keywords = {3D pointing, auditory feedback, training},
}
@inproceedings{batmaz2022stereodistal,
title = {Effect of Stereo Deficiencies on Virtual Distal Pointing},
author = {Batmaz, Anil Ufuk and Hudhud Mughrabi+, Moaaz and Barrera Machuca, Mayra Donaji and Stuerzlinger, Wolfgang},
booktitle = {28th Symposium on Virtual Reality Software and Technology},
publisher = {ACM},
series = {VRST '22},
year = {2022},
month = {Nov},
articleno = {12},
numpages = {8},
doi = {https://doi.org/10.1145/3562939.3565621},
pdf = {papers/vac_distal.pdf},
teaser = {teasers/vac_distal.png},
abstract = {Previous work has shown that the mismatch between disparity and optical focus cues, i.e., the vergence and accommodation conflict (VAC), affects virtual hand selection in immersive systems. To investigate if the VAC also affects distal pointing with ray casting, we ran a user study with an ISO 9241:411 multidirectional selection task where participants selected 3D targets with three different VAC conditions, no VAC, i.e., targets placed roughly at 75 cm, which matches the focal plane of the VR headset, constant VAC, i.e., at 400 cm from the user, and varying VAC, where the depth distance of targets changed between 75 cm and 400 cm. According to our results, the varying VAC condition requires the most time and decreases the throughput performance of the participants. It also takes longer for users to select targets in the constant VAC condition than without the VAC. Our results show that in distal pointing placing objects at different depth planes has detrimental effect on the user performance.},
keywords = {3D pointing, vergence-accomodation conflict, ray casting},
}
@inproceedings{mutasim2022performance,
title = {Performance Analysis of Saccades for Primary and Confirmatory Target Selection},
author = {Mutasim*, Aunnoy K and Batmaz, Anil Ufuk and Hudhud Mughrabi+, Moaaz and Stuerzlinger, Wolfgang},
booktitle = {28th Symposium on Virtual Reality Software and Technology},
publisher = {ACM},
series = {VRST '22},
year = {2022},
month = {Nov},
articleno = {18},
numpages = {12},
doi = {https://doi.org/10.1145/3562939.3565619},
pdf = {papers/saccadeconfirm.pdf},
video = {videos/saccadeconfirm.mp4},
teaser = {teasers/saccadeconfirm.png},
abstract = {In eye-gaze-based selection, dwell suffers from several issues, e.g., the Midas Touch problem. Here we investigate saccade-based selection techniques as an alternative to dwell. First, we designed a novel user interface (UI) for Actigaze and used it with (goal-crossing) saccades for confirming the selection of small targets (i.e., < 1.5-2°). We compared it with three other variants of Actigaze (with button press, dwell, and target reverse crossing) and two variants of target magnification (with button press and dwell). Magnification-dwell exhibited the most promising performance. Among Actigaze, goal-crossing was the fastest and achieved the highest throughput but suffered the most errors. We then evaluated goal-crossing as a primary selection technique for targets ≥ 2° and implemented a novel UI for such interaction. Results revealed that dwell achieved the best performance. Yet, we identified goal-crossing as a good compromise between dwell and button press. Our findings thus identify novel options for gaze-only interaction.},
keywords = {eye tracking, pointing, saccades},
}
@inproceedings{chidambaram2022editar,
title = {EditAR: A Digital Twin Authoring and Editing Environment for Creation of AR/VR and Video Instructions from a Single Demonstration},
author = {Chidambaram*, Subramanian and Reddy*, Sai Swarup and Rumple*, Matthew David and Ipsita*, Ananya and Villanueva*, Ana M and Redick, Thomas S and Stuerzlinger, Wolfgang and Ramani, Karthik},
booktitle = {International Symposium on Mixed and Augmented Reality},
publisher = {IEEE},
series = {ISMAR '22},
year = {2022},
month = {Oct},
pages = {326-335},
doi = {https://doi.org/10.1109/ISMAR55827.2022.00048},
pdf = {papers/editar.pdf},
video = {videos/editar.mp4},
teaser = {teasers/editar.png},
abstract = {Augmented/Virtual reality and video-based media play a vital role in the digital learning revolution to train novices in spatial tasks. However, creating content for these different media requires expertise in several fields. We present EditAR, a unified authoring and editing workflow to create content for AR, VR, and video with a single demonstration. EditAR captures the user’s interaction within an environment and creates a digital twin enabling users with no prior programming background to develop content. We conducted formative interviews with both subject and media experts to design the system. The prototype then developed was reviewed by experts. We also performed a comparative study on 2D video creation from 3D recordings, via a 3D editor, which uses freehand interaction for in-headset editing vs. traditional video creation. Users took 5x less time to record instructions and preferred EditAR in a qualitative survey, along with giving significantly higher usability scores.},
keywords = {augmented reality, 3d user interfaces, authoring, digital twin},
}
@inproceedings{alharbi2022autocucumber,
title = {Auto-Cucumber: The Impact of Autocorrection Failures on Users' Frustration},
author = {Alharbi*, Ohoud and Stuerzlinger, Wolfgang},
booktitle = {Graphics Interface},
series = {GI '22},
year = {2022},
month = {May},
articleno = {16},
pages = {148-160},
doi = {https://doi.org/10.20380/GI2022.16},
pdf = {papers/autocucumber.pdf},
commented-url = {https://openreview.net/forum?id=dcbsb4qTmnt},
teaser = {teasers/autocucumber.png},
abstract = {Many mobile users rely on autocorrection mechanisms during text entry on their smartphone. Previous studies investigated the effects of autocorrection mechanisms on typing speed and accuracy but did not explore the level of frustration and perceived mental workload often associated with autocorrection. In this paper, we investigate the effect of autocorrection failures on the user’s frustration, mental and physical demand, performance, and effort using a mixed-methods user study. We identified that perceived mental and physical demand, and frustration are directly affected by autocorrection.},
keywords = {text entry, autocorrect, errors, frustration},
}
@inproceedings{batmaz2022vacpointing,
title = {The Effect of the Vergence-Accommodation Conflict on Virtual Hand Pointing in Immersive Displays},
author = {Batmaz, Anil Ufuk and Barrera Machuca, Mayra D. and Sun, Junwei and Stuerzlinger, Wolfgang},
booktitle = {Conference on Human Factors in Computing Systems},
publisher = {ACM},
series = {CHI '22},
year = {2022},
month = {May},
articleno = {633},
numpages = {15},
doi = {https://doi.org/10.1145/3491102.3502067},
pdf = {papers/vacpointing.pdf},
video = {videos/vacpointing.mp4},
teaser = {teasers/vacpointing.png},
abstract = {Previous work hypothesized that for Virtual Reality (VR) and Augmented Reality (AR) displays a mismatch between disparities and optical focus cues, known as the vergence and accommodation conflict (VAC), affects depth perception and thus limits user performance in 3D selection tasks within arm’s reach (peri-personal space). To investigate this question, we built a multifocal stereo display, which can eliminate the influence of the VAC for pointing within the investigated distances. In a user study, participants performed a virtual hand 3D selection task with targets arranged laterally or along the line of sight, with and without a change in visual depth, in display conditions with and without the VAC. Our results show that the VAC influences 3D selection performance in common VR and AR stereo displays and that multifocal displays have a positive effect on 3D selection performance with a virtual hand.},
keywords = {3D pointing, vergence-accomodation conflict, immersive display system, multifocal display},
}
@inproceedings{hudhud2022jitter,
title = {My Eyes Hurt: Effects of Jitter in 3D Gaze Tracking},
author = {Hudhud Mughrabi+, Moaaz and Mutasim*, Aunnoy K and Stuerzlinger, Wolfgang and Batmaz, Anil Ufuk},
booktitle = {Conference on Virtual Reality and {3D} User Interfaces Abstracts and Workshops, Workshop on Novel Input Devices and Interaction Techniques at {VR}},
publisher = {IEEE},
series = {NIDIT '22},
year = {2022},
month = {Mar},
pages = {310-315},
doi = {https://doi.org/10.1109/VRW55335.2022.00070},
pdf = {papers/gazejitter.pdf},
abstract = {Jitter, small fluctuations in the signal, is one of the major sources for a decrease of motor performance and a negative user experience in virtual reality (VR) systems. Current technologies still cannot eliminate jitter in VR systems, especially in the eye-gaze tracking systems embedded in many head-mounted displays. In this work, we used an HTC Vive Pro Eye, artificially added 0.5°, 1°, and 1.5° jitter to the eye-tracking data, and analyzed user performance in a ISO 9241:411 pointing task with targets at 1 or 2 meters visual distance using angular Fitts’ law. The results showed that the user’s error rate significantly increases with increased jitter levels. No significant difference was observed for time and throughput. Additionally, we observed a significant decrease in terms of time, error rate, and throughput for the more distant targets. We hope that our results guide researcher, practitioners, and developers towards better gaze-tracking-based VR applications.},
keywords = {3D pointing, jitter, virtual reality},
}
@inproceedings{batmaz2021anchoring,
title = {When Anchoring Fails: Interactive Alignment of Large Virtual Objects in Occasionally Failing AR Systems},
author = {Batmaz, Anil Ufuk and Stuerzlinger, Wolfgang},
booktitle = {Future Technologies Conference},
publisher = {Springer},
series = {FTC '21},
year = {2021},
month = {Oct},
volume = {LNNS 358},
numpages = {13},
doi = {https://doi.org/10.1007/978-3-030-89906-6_4},
pdf = {papers/aranchoring.pdf},
teaser = {teasers/aranchoring.png},
abstract = {Augmented reality systems show virtual object models overlaid over real ones, which is helpful in many contexts, e.g., during maintenance. Assuming all geometry is known, misalignments in 3D poses will still occur without perfectly robust viewer and object 3D tracking. Such misalignments can impact the user experience and reduce the potential benefits associated with AR systems. In this paper, we implemented several interactive algorithms to make manual virtual object alignment easier, based on previously presented methods, such as HoverCam, SHOCam, and a Signed Distance Field. Our approach also simplifies the user interface for manual 3D pose alignment. The results of our work indicate that our approach can reduce the time needed for interactive 3D pose alignment, which improves the user experience.},
keywords = {augmented reality, 3D navigation, 3D orbiting, 3D tracking, anchoring},
}
@inproceedings{chakraborty2021vizinteract,
title = {VizInteract: Rapid Data Exploration through Multi-Touch Interaction with Multi-Dimensional Visualizations},
author = {Chakraborty*, Supratim and Stuerzlinger, Wolfgang},
booktitle = {Human-Computer Interaction},
publisher = {Springer},
series = {INTERACT '21},
year = {2021},
month = {Aug},
volume = {LNCS 12934},
pages = {610–632},
doi = {https://doi.org/10.1007/978-3-030-85613-7_39},
pdf = {papers/vizinteract.pdf},
url = {https://heysupratim.com/projects/vizinteract},
video = {videos/vizinteract.mp4},
teaser = {teasers/vizinteract.png},
abstract = {Creating and editing multi-dimensional data visualizations with current tools typically involves complex interactions. We present VizInteract, an interactive data visualization tool for touch-enabled displays. VizInteract supports efficient multi-touch data exploration through rapid construction of and interaction with multi-dimensional data visualizations. Building on primitive visualization idioms like histograms, VizInteract addresses the need for easy data exploration by facilitating the construction of multi-dimensional visualizations, such as scatter plots, parallel coordinate plots, radar charts, and scatter plot matrices, through simple multi-touch actions. Touch-based brushing-and-linking as well as attribute-based filter bubbles support “diving into the data” during analysis. We present the results of two explorative studies, one on a tablet and another on a large touchscreen and analyze the usage patterns that emerge while participants conducted visual analytics data exploration tasks in both conditions.},
keywords = {visual analytics, visualization, touch},
}
@inproceedings{chidambaram2021processar,
title = {ProcessAR: An augmented reality-based tool to create in-situ procedural 2D/3D AR Instructions},
author = {Chidambaram*, Subramanian and Huang*, Hank and He*, Fengming and Qian*, Xun and Villanueva*, Ana M and Redick, Thomas S and Stuerzlinger, Wolfgang and Ramani, Karthik},
booktitle = {Designing Interactive Systems},
publisher = {ACM},
series = {DIS '21},
year = {2021},
month = {Jun},
pages = {234-249},
doi = {https://doi.org/10.1145/3461778.3462126},
pdf = {papers/processar.pdf},
video = {videos/processar.mp4},
teaser = {teasers/processar.png},
abstract = {Augmented reality (AR) is an efficient form of delivering spatial information and has great potential for training workers. However, AR is still not widely used due to the technical skills, expertise, required to develop appropriate and interactive AR content. We developed ProcessAR, an AR-based system to develop 2D/3D content by capturing subject matter expert (SME) environment-object interactions, in situ. To enable smooth workflows, ProcessAR locates and identifies different tools/objects in the workspace where the author looks at them, by utilizing a computer vision algorithm. We explored additional features such as embedding 2D videos to detected objects and user-adaptive triggers. The design space for ProcessAR was identified from formative interviews with AR programming experts and SMEs, alongside a comparative design study with SMEs and novice users. A final user evaluation comparing ProcessAR and a baseline AR authoring environment studied, users rated ProcessAR as the better form on qualitative perceptional surveys.},
keywords = {augmented reality, mixed reality, AR authoring},
}
@inproceedings{mutasim2021pinchclickdwell,
title = {Pinch, Click, or Dwell: Comparing Different Selection Techniques for Eye-Gaze-Based Pointing in Virtual Reality},
author = {Mutasim*, Aunnoy K. and Batmaz, Anil Ufuk and Stuerzlinger, Wolfgang},
booktitle = {Symposium on Eye Tracking Research and Applications},
publisher = {ACM},
series = {ETRA '21},
year = {2021},
month = {May},
articleno = {15},
numpages = {7},
doi = {https://doi.org/10.1145/3448018.3457998},
pdf = {papers/pinchclickdwell.pdf},
teaser = {teasers/pinchclickdwell.png},
abstract = {While a pinch action is gaining popularity for selection/activation of virtual objects in eye-gaze-based systems, it is still unknown how well it performs compared to other popular alternatives, e.g., a button click or a dwell action. To determine pinch's performance in terms of execution time, error rate, and throughput, we implemented a Fitts' law task in Virtual Reality (VR) where the subjects pointed with their eye-gaze and selected/activated the targets by either pinch, clicking a button, or dwell. Results revealed that although pinch was slower, resulted in more errors, and had less throughput compared to button clicks, none of these differences between the two conditions were significant. Dwell exhibited the least errors but was significantly slower and achieved less throughput compared to the other conditions. Based on these findings, we conclude that the pinch gesture is a reasonable alternative to button clicks for eye-gaze-based VR systems.},
keywords = {eye tracking, selection, pointing},
}
@inproceedings{jiang2021reverseorc,
title = {{ReverseORC}: Reverse Engineering of Resizable User Interface Layouts with {OR}-Constraints},
author = {Jiang*, Yue and Stuerzlinger, Wolfgang and Lutteroth, Christof},
booktitle = {Conference on Human Factors in Computing Systems},
publisher = {ACM},
series = {CHI '21},
year = {2021},
month = {May},
articleno = {316},
numpages = {18},
doi = {https://doi.org/10.1145/3411764.3445043},
pdf = {papers/reverseorc.pdf},
url = {https://github.com/YueJiang-nj/ReverseORC-CHI2021},
video = {https://youtu.be/uBVRtUvLFSk},
teaser = {teasers/reverseorc.png},
abstract = {Reverse engineering (RE) of user interfaces (UIs) plays an important role in software evolution. However, the large diversity of UI technologies and the need for UIs to be resizable make this challenging.
We propose ReverseORC, a novel RE approach able to discover diverse layout types and their dynamic resizing behaviours independently of their implementation, and to specify them by using OR constraints. Unlike previous RE approaches, ReverseORC infers flexible layout constraint specifications by sampling UIs at different sizes and analyzing the differences between them. It can create specifications that replicate even some non-standard layout managers with complex dynamic layout behaviours. We demonstrate that ReverseORC works across different platforms with very different layout approaches, e.g., for GUIs as well as for the Web. Furthermore, it can be used to detect and fix problems in legacy UIs, extend UIs with enhanced layout behaviours, and support the creation of flexible UI layouts.},
keywords = {GUI, layout, constraints},
}
@inproceedings{batmaz2021pitch,
title = {The Effect of Pitch in Auditory Error Feedback for Fitts' Tasks in Virtual Reality Training Systems},
author = {Batmaz, Anil Ufuk and Stuerzlinger, Wolfgang},
booktitle = {Conference on Virtual Reality and {3D} User Interfaces},
publisher = {IEEE},
series = {VR '21},
year = {2021},
month = {Mar},
pages = {85-94},
doi = {https://doi.org/10.1109/VR50410.2021.00029},
pdf = {papers/pitchfeedback.pdf},
teaser = {teasers/pitchfeedback.png},
abstract = {Fitts' law and the associated throughput measure characterize user pointing performance in virtual reality (VR) training systems and simulators well. Yet, pointing performance can be affected by the feedback users receive from a VR application. This work examines the effect of the pitch of auditory error feedback on user performance in a Fitts' task through a distributed experiment. In our first study, we used middle- and high-frequency sound feedback and demonstrated that high-pitch error feedback significantly decreases user performance in terms of time and throughput. In the second study, we used adaptive sound feedback, where we increased the frequency with the error rate, while asking subjects to execute the task "as fast/as precise/as fast and precise as possible". Results showed that adaptive sound feedback decreases the error rate for "as fast as possible" task execution without affecting the time. The results can be used to enhance and design various VR systems.},
keywords = {3D pointing, feedback, augmented reality, touch},
}
@inproceedings{batmaz2021auditory,
title = {Effects of Different Auditory Feedback Frequencies in Virtual Reality {3D} Pointing Tasks},
author = {Batmaz, Anil Ufuk and Stuerzlinger, Wolfgang},
booktitle = {Conference on Virtual Reality and {3D} User Interfaces, Abstracts and Workshops, Workshop on Novel Input Devices and Interaction Techniques at {VR}},
publisher = {IEEE},
series = {NIDIT '21},
year = {2021},
month = {Mar},
pages = {189-194},
doi = {https://doi.org/10.1109/VRW52623.2021.00042},
pdf = {papers/auditoryfeedback.pdf},
abstract = {Auditory error feedback is commonly used in 3D Virtual Reality (VR) pointing experiments to increase participants' awareness of their misses. However, few papers describe the parameters of the auditory feedback, such as the frequency. In this study, we asked 15 participants to perform an ISO 9241-411 pointing task in a distributed remote experiment. In our study, we used three forms of auditory feedback, i.e., C4 (262 Hz), C8 (4186 Hz) and none. According to the results, we observed a speed-accuracy trade-off for the C8 tones compared to C4 ones: subjects were slower, and their throughput performance decreased with the C8 while their error rate decreased. Still, for larger targets there was no speed-accuracy trade-off, and subjects were only slower with C8 tones. Overall, the frequency of the feedback had a significant impact on the user's performance. We thus suggest that practitioners, developers, and designers report the frequency they used in their VR applications.},
keywords = {3D pointing, feedback, virtual reality},
}
@inproceedings{batmaz2020nojitter,
title = {No Jitter Please: Effects of Rotational and Positional Jitter on {3D} Mid-Air Interaction},
author = {Batmaz, Anil Ufuk and Rajabi Seraji*, Mohammad and Kneifel*, Johanna and Stuerzlinger, Wolfgang},
booktitle = {Future Technologies Conference},
publisher = {Springer},
series = {FTC '20},
year = {2020},
month = {Nov},
volume = {AISC 1289},
commented-volume = {2},
numpages = {16},
doi = {https://doi.org/10.1007/978-3-030-63089-8_52},
pdf = {papers/nojitter.pdf},
teaser = {teasers/nojitter.png},
abstract = {Virtual Reality (VR) 3D tracking systems are susceptible to minor fluctuations in signal (jitter). In this study, we explored how different levels of jitter affect user performance for 3D pointing. We designed a Fitts' Law experiment investigating target positional jitter and cursor rotational jitter at 3 different depth distances. Performance was negatively affected when up to ± 0.5° rotational jitter was applied to the controller and up to ± 0.375 cm positional jitter was applied to the target. At 2.25 m distance, user performance did not improve with decreasing positional jitter or rotational jitter compared to the no jitter condition. Our results can inform the design of 3D user interfaces, controllers, and interaction techniques in VR. Specifically, we suggest a focus on counteracting controller rotational jitter as this would globally increase performance for ray-based selection tasks.},
keywords = {3D pointing, mid-air, jitter},
}
@inproceedings{lee2020automatic,
title = {Evaluating Automatic Parameter Control Methods for Locomotion in Multiscale Virtual Environments},
author = {Lee*, Jong-In and Asente, Paul and Kim, Byungmoon and Kim, Yeojin and Stuerzlinger, Wolfgang},
booktitle = {26th Symposium on Virtual Reality Software and Technology},
publisher = {ACM},
series = {VRST '20},
year = {2020},
month = {Nov},
articleno = {11},
numpages = {10},
doi = {https://doi.org/10.1145/3385956.3418961},
pdf = {papers/navmultiscaleve.pdf},
video = {videos/navmultiscaleve.mp4},
teaser = {teasers/navmultiscaleve.png},
abstract = {Virtual environments with a wide range of scales are becoming commonplace in Virtual Reality applications. Methods to control locomotion parameters can help users explore such environments more easily. For multi-scale virtual environments, point-and-teleport locomotion with a well-designed distance control method can enable mid-air teleportation, which makes it competitive to flying interfaces. Yet, automatic distance control for point-and-teleport has not been studied in such environments. We present a new method to automatically control the distance for point-and-teleport. In our first user study, we used a solar system environment to compare three methods: automatic distance control for point-and-teleport, manual distance control for point-and-teleport, and automatic speed control for flying. Results showed that automatic control significantly reduces overshoot compared with manual control for point-and-teleport, but the discontinuous nature of teleportation made users prefer flying with automatic speed control. We conducted a second study to compare automatic-speed-controlled flying and two versions of our teleportation method with automatic distance control, one incorporating optical flow cues. We found that point-and-teleport with optical flow cues and automatic distance control was more accurate than flying with automatic speed control, and both were equally preferred to point-and-teleport without the cues.},
keywords = {3D navigation, multiscale virtual environment, teleportation, automatic distance, speed control},
}
@inproceedings{batmaz2020eyehand,
title = {Eye-Hand Coordination Training for Sports with Mid-air {VR}},
author = {Batmaz, Anil Ufuk and Sun*, Xintian and Taskiran, Dogu and Stuerzlinger, Wolfgang},
booktitle = {26th Symposium on Virtual Reality Software and Technology},
publisher = {ACM},
series = {VRST '20},
year = {2020},
month = {Nov},
articleno = {19},
numpages = {10},
doi = {https://doi.org/10.1145/3385956.3418971},
pdf = {papers/eyehandsports.pdf},
video = {videos/eyehandsports.mp4},
teaser = {teasers/eyehandsports.png},
abstract = {A relatively recent application area for Virtual Reality (VR) systems is sports training and user performance assessment. One of these applications is eye-hand coordination training systems (EHCTSs). Previous research identified that VR-based training systems have great potential for EHCTSs. While previous work investigated 3D targets on a 2D plane, here we aim to study full 3D movements and extend the application of throughput analysis to EHCTSs. We conducted two user studies to investigate how user performance is affected by different target arrangements, feedback conditions, and handedness in VR-based EHCTSs. In the first study, we explored handedness as well as vertical and horizontal target arrangements, and showed that user performance increases with the dominant hand and a vertical target plane. In the second study, we investigated different combinations of visual and haptic feedback and how they affect user performance with different target and cursor sizes. Results illustrate that haptic feedback did not increase user performance when it is added to visual feedback. Our results inform the creation of better EHCTSs with mid-air VR systems.},
keywords = {3D pointing, eye-hand coordination, sports training},
}
@inproceedings{jiang2020orcsolver,
title = {{ORCSolver}: An Efficient Solver for Adaptive {GUI} Layout with {OR}-Constraints},
author = {Jiang*, Yue and Stuerzlinger, Wolfgang and Zwicker, Matthias and Lutteroth, Christof},
booktitle = {Conference on Human Factors in Computing Systems},
publisher = {ACM},
series = {CHI '20},
year = {2020},
month = {Apr},
articleno = {483},
numpages = {14},
doi = {https://doi.org/10.1145/3313831.3376610},
url = {https://yuejiang-nj.github.io/papers/CHI2020_ORCSolver/project_page.html},
pdf = {papers/orcsolver.pdf},
video = {https://youtu.be/0S77vVG8btE},
teaser = {teasers/orcsolver.png},
abstract = {OR-constrained (ORC) graphical user interface layouts unify conventional constraint-based layouts with flow layouts, which enables the definition of flexible layouts that adapt to screens with different sizes, orientations, or aspect ratios with only a single layout specification. Unfortunately, solving ORC layouts with current solvers is time-consuming and the needed time increases exponentially with the number of widgets and constraints. To address this challenge, we propose ORCSolver, a novel solving technique for adaptive ORC layouts, based on a branch-and-bound approach with heuristic preprocessing. We demonstrate that ORCSolver simplifies ORC specifications at runtime and our approach can solve ORC layout specifications efficiently at near-interactive rates.},
keywords = {GUI, layout, constraints},
}
@inproceedings{putze2020eegautocorrect,
title = {Platform for Studying Self-Repairing Auto-Corrections in Mobile Text Entry Based on Brain Activity, Gaze, and Context},
author = {Putze, Felix and Ihrig*, Tilman and Schultz, Tanja and Stuerzlinger, Wolfgang},
booktitle = {Conference on Human Factors in Computing Systems},
publisher = {ACM},
series = {CHI '20},
year = {2020},
month = {Apr},
numpages = {13},
doi = {https://doi.org/10.1145/3313831.3376815},
pdf = {papers/eegautocorrect.pdf},
teaser = {teasers/eegautocorrect.png},
abstract = {Auto-correction is a standard feature of mobile text entry. While the performance of state-of-the-art auto-correct methods is usually relatively high, any errors that occur are cumbersome to repair, interrupt the flow of text entry, and challenge the user's agency over the process. In this paper, we describe a system that aims to automatically identify and repair auto-correction errors. This system comprises a multi-modal classifier for detecting auto-correction errors from brain activity, eye gaze, and context information, as well as a strategy to repair such errors by replacing the erroneous correction or suggesting alternatives. We integrated both parts in a generic Android component and thus present a research platform for studying self-repairing end-to-end systems. To demonstrate its feasibility, we performed a user study to evaluate the classification performance and usability of our approach.},
keywords = {autocorrect, EEG, errors, text entry},
}
@inproceedings{batmaz2020grip,
title = {Precision vs. Power Grip: A Comparison of Pen Grip Styles for Selection in Virtual Reality},
author = {Batmaz, Anil Ufuk and Mutasim*, Aunnoy K. and Stuerzlinger, Wolfgang},
booktitle = {Conference on Virtual Reality and {3D} User Interfaces, Abstracts and Workshops, Workshop on Novel Input Devices and Interaction Techniques at {VR}},
publisher = {IEEE},
series = {NIDIT '20},
year = {2020},
month = {Mar},
pages = {23-28},
doi = {https://doi.org/10.1109/VRW50115.2020.00012},
pdf = {papers/precisiongrip.pdf},
abstract = {While commercial Virtual Reality (VR) controllers are mostly designed to be held in a power grip, previous research showed that using pen-like devices with a precision grip can improve user performance for selection in VR, potentially even matching that achievable with a mouse. However, it is not known if the improvement is due to the grip style. In this work, 12 subjects performed a Fitts' task at 3 different depth conditions with a pen-like input device used in both a precision and power grip. Our results identify that the precision grip significantly improves user performance in VR through a significant reduction in error rate, but we did not observe a significant effect of the distance of targets from the user. We believe that our results are useful for designers and researchers to improve the usability of and user performance in VR systems.},
keywords = {3D pointing, grip},
}
@inproceedings{batmaz2020touch,
title = {Touch the Wall: Comparison of Virtual and Augmented Reality with Conventional {2D} Screen Eye-hand Coordination Training Systems},
author = {Batmaz, Anil Ufuk and Mutasim*, Aunnoy K. and Malekmakan*, Morteza and Sadr*, Elham and Stuerzlinger, Wolfgang},
booktitle = {Conference on Virtual Reality and {3D} User Interfaces},
publisher = {IEEE},
series = {VR '20},
year = {2020},
month = {Mar},
pages = {184-193},
doi = {https://doi.org/10.1109/VR46266.2020.1581205539914},
pdf = {papers/touchthewall.pdf},
teaser = {teasers/touchthewall.png},
abstract = {Previous research on eye-hand coordination training systems has investigated user performance on a wall, 2D touchscreens, and in Virtual Reality (VR). In this paper, we designed an eye-hand coordination reaction test to investigate and compare user performance in three different virtual environments (VEs) – VR, Augmented Reality (AR), and a 2D touchscreen. VR and AR conditions also included two feedback conditions – mid-air and passive haptics. Results showed that compared to AR, participants were significantly faster and made fewer errors both in 2D and VR. However, compared to VR and AR, throughput performance of the participants was significantly higher in the 2D touchscreen condition. No significant differences were found between the two feedback conditions. The results show the importance of assessing precision and accuracy in eye-hand coordination training and suggest that it is currently not advisable to use AR headsets in such systems.},
keywords = {3D pointing, eye-hand coordination, mid-air, passive haptics, augmented reality, touch},
}
@inproceedings{pham2019mightypen,
title = {Is the Pen Mightier than the Controller? A Comparison of Input Devices for Selection in Virtual and Augmented Reality},
author = {Pham*, Duc-Minh and Stuerzlinger, Wolfgang},
booktitle = {25th Symposium on Virtual Reality Software and Technology},
publisher = {ACM},
series = {VRST '19},
year = {2019},
month = {Nov},
articleno = {35},
numpages = {11},
doi = {https://doi.org/10.1145/3359996.3364264},
pdf = {papers/mightypen.pdf},
teaser = {teasers/mightypen.png},
abstract = {Controllers are currently the typical input device for commercial Virtual Reality (VR) systems. Yet, such controllers are not as efficient as other devices, including the mouse. This motivates us to investigate devices that substantially exceed the controller's performance, for both VR and Augmented Reality (AR) systems. We performed a user study to compare several input devices, including a mouse, controller, and a 3D pen-like device on a VR and AR pointing task. Our results show that the 3D pen significantly outperforms modern VR controllers in all evaluated measures and that it is comparable to the mouse. Participants also liked the 3D pen more than the controller. Finally, we show how 3D pen devices could be integrated into today's VR and AR systems.},
keywords = {3D pointing, input device},
}
@inproceedings{batmaz2019hittingwall,
title = {Hitting the Wall: Mid-Air Interaction for Eye-Hand Coordination},
author = {Batmaz, Anil Ufuk and Sun*, Xintian and Taskiran, Dogu and Stuerzlinger, Wolfgang},
booktitle = {25th Symposium on Virtual Reality Software and Technology},
publisher = {ACM},
series = {VRST '19},
year = {2019},
month = {Nov},
articleno = {30},
numpages = {5},
doi = {https://doi.org/10.1145/3359996.3364249},
pdf = {papers/hittingthewall.pdf},
video = {videos/hittingthewall.mp4},
teaser = {teasers/hittingthewall.png},
abstract = {Reaction time training systems are used to improve user performance. Until now, such setups use physical 2D flat surfaces, e.g., a 2D touch screen or buttons mounted on a wall. We designed and investigated a mid-air reaction time training system with an immersive virtual reality (VR) headset. 12 participants performed an eye-hand coordination reaction test in three conditions: both in mid-air with or without VR controller as well as with passive haptic feedback through hitting a soft-surface wall. We also altered target and cursor sizes and used a Fitts' law task to analyze user performance. According to the results, subjects were slower and their throughput was lower when they hit a solid surface to interact with virtual targets. Our results show that Fitts's model can be applied to these systems to measure and assess participant training.},
keywords = {3D pointing, mid-air, passive haptics, eye-hand coordination, augmented reality},
}
@inproceedings{machuca2019smart3dguides,
title = {{Smart3DGuides}: Making Unconstrained Immersive {3D} Drawing More Accurate},
author = {Barrera Machuca*, Mayra D. and Stuerzlinger, Wolfgang and Asente, Paul},
booktitle = {25th Symposium on Virtual Reality Software and Technology},
publisher = {ACM},
series = {VRST '19},
year = {2019},
month = {Nov},
articleno = {37},
numpages = {13},
doi = {https://doi.org/10.1145/3359996.3364254},
pdf = {papers/smart3dguides.pdf},
video = {videos/smart3dguides.mp4},
teaser = {teasers/smart3dguides.png},
abstract = {Most current commercial Virtual Reality (VR) drawing applications for creativity rely on freehand 3D drawing as their main interaction paradigm. However, the presence of the additional third dimension makes accurate freehand drawing challenging. Some systems address this problem by constraining or beautifying user strokes, which can be intrusive and can limit the expressivity of freehand drawing. In this paper, we evaluate the effectiveness of relying solely on visual guidance to increase overall drawing shape-likeness. We identified a set of common mistakes that users make while creating freehand strokes in VR and then designed a set of visual guides, the Smart3DGuides, which help users avoid these mistakes. We evaluated Smart3DGuides in two user studies, and our results show that non-constraining visual guides help users draw more accurately.},
keywords = {3D drawing, 3D sketching, 3D user interfaces, 3D modeling},
}
@inproceedings{pham2019hawkey,
title = {{HawKEY}: Efficient and Versatile Text Entry for Virtual Reality},
author = {Pham*, Duc-Minh and Stuerzlinger, Wolfgang},
booktitle = {25th Symposium on Virtual Reality Software and Technology},
publisher = {ACM},
series = {VRST '19},
year = {2019},
month = {Nov},
articleno = {21},
numpages = {11},
doi = {https://doi.org/10.1145/3359996.3364265},
pdf = {papers/hawkey.pdf},
teaser = {teasers/hawkey.png},
abstract = {Text entry is still a challenging task in modern Virtual Reality (VR) systems. The lack of efficient text entry methods limits the applications that can be used productively in VR. Previous work has addressed this issue through virtual keyboards or showing the physical keyboard in VR. While physical keyboards afford faster text entry, they usually require a seated user and an instrumented environment. We introduce a new keyboard, worn on a hawker's tray in front of the user, which affords a compact, simple, flexible, and efficient text entry solution for VR, without restricting physical movement. In our new video condition, we also show the keyboard only when the user is looking down at it. To evaluate our novel solution and to identify good keyboard visualizations, we ran a user study where we asked participants to enter both lowercase sentences as well as complex text while standing. The results show that text entry rates are affected negatively by simplistic keyboard visualization conditions and that our solution affords desktop text entry rates, even when standing.},
keywords = {3D user interfaces, text entry, augmented reality},
}
@inproceedings{sun2019sliding,
title = {Extended Sliding in Virtual Reality},
author = {Sun*, Junwei and Stuerzlinger, Wolfgang},
booktitle = {25th Symposium on Virtual Reality Software and Technology},
publisher = {ACM},
series = {VRST '19},
year = {2019},
month = {Nov},
articleno = {38},
numpages = {5},
doi = {https://doi.org/10.1145/3359996.3364251},
pdf = {papers/extendedsliding.pdf},
video = {videos/extendedsliding.mp4},
teaser = {teasers/extendedsliding.png},
abstract = {Although precise 3D positioning is not always necessary in virtual environments, it is still an important task for current and future applications of Virtual Reality (VR), including 3D modelling, engineering, and scientific applications. We focus on 3D positioning techniques in immersive environments that use a 6DOF controller as input device and present a new technique that improves 3D positioning performance in VR, in both speed and accuracy. Towards this goal, we adapted an extended sliding technique to VR systems with a controller as input device and compared it with previously presented 3DOF positioning techniques. The results showed that our new Extended VR Sliding technique significantly improved the accuracy for 3D positioning tasks, especially for targets in contact with the scene.},
keywords = {3D manipulation, 3D positioning, sliding},
}
@inproceedings{hayatpur2019planeraypoint,
title = {Plane, Ray, and Point: Enabling Precise Spatial Manipulations with Shape Constraints},
author = {Hayatpur+, Devamardeep and Heo, Seongkook and Xia, Haijun and Stuerzlinger, Wolfgang and Wigdor, Daniel},
booktitle = {32nd Annual Symposium on User Interface Software and Technology},
publisher = {ACM},
series = {UIST '19},
year = {2019},
month = {Oct},
pages = {1185–1195},
doi = {https://doi.org/10.1145/3332165.3347916},
pdf = {papers/planeraypoint.pdf},
video = {videos/planeraypoint.mp4},
teaser = {teasers/planeraypoint.png},
abstract = {We present Plane, Ray, and Point, a set of interaction techniques that utilizes shape constraints to enable quick and precise object alignment and manipulation in virtual reality. Users create the three types of shape constraints, Plane, Ray, and Point, by using symbolic gestures. The shape constraints are used like scaffoldings and limit and guide the movement of virtual objects that collide or intersect with them. The same set of gestures can be performed with the other hand, which allow users to further control the degrees of freedom for precise and constrained manipulation. The combination of shape constraints and bimanual gestures yield a rich set of interaction techniques to support object transformation. An exploratory study conducted with 3D design experts and novice users found the techniques to be useful in 3D scene design workflows and easy to learn and use.},
keywords = {3D manipulation},
}
@inproceedings{machuca2019spatial,
title = {The Effect of Spatial Ability on Immersive {3D} Drawing},
author = {Barrera Machuca*, Mayra D. and Stuerzlinger, Wolfgang and Asente, Paul},
booktitle = {Conference on Creativity and Cognition},
publisher = {ACM},
series = {C&C '19},
year = {2019},
month = {Jun},
pages = {173–186},
doi = {https://doi.org/10.1145/3325480.3325489},
pdf = {papers/drawingspatialability.pdf},
teaser = {teasers/drawingspatialability.png},
abstract = {Virtual Reality (VR) headsets have made immersive 3D drawing available to the general public. However, compared to 2D drawing, the presence of an additional dimension makes sketching in VR challenging, since creating precise strokes that are positioned as intended in all three dimensions imposes higher demands on the users' perception, motor and spatial skills. Another challenge users face is creating accurate shapes in which strokes are positioned correctly relative to previous ones, as they may need to use different views to plan their next hand movement. In this paper, we analyze the behaviours of users with different spatial abilities while drawing in VR. Our results indicate that there are different types of behaviours that affect different aspects of the sketches. We also found that the user's spatial ability affects the shape of the drawing, but not the line precision. Finally, we give recommendations for designing 3D drawing interfaces.},
keywords = {virtual reality, 3D sketching, 3D drawing, 3D modeling, spatial cognition},
}
@inproceedings{papoi20193dspeedcontrol,
title = {Improved Automatic Speed Control for {3D} Navigation},
author = {Papoi*, Domi and Stuerzlinger, Wolfgang},
booktitle = {Advances in Computer Graphics},
publisher = {Springer},
series = {CGI '19},
year = {2019},
month = {Jun},
volume = {LNCS 11542},
pages = {278-290},
doi = {https://doi.org/10.1007/978-3-030-22514-8_23},
pdf = {papers/navspeed.pdf},
video = {videos/navspeed.mp4},
teaser = {teasers/navspeed.png},
abstract = {As technology progresses, it is possible to increase the size and complexity of 3D virtual environments. Thus, we need deal with multiscale virtual environments today. Ideally, the user should be able to navigate such environments efficiently and robustly, which requires control of the user speed during navigation. Manual speed control across multiple scales of magnitude suffers from issues such as overshooting behaviors and introduces additional complexity. Most previously presented methods to automatically control the speed of navigation do not generalize well to environments with varying scales. We present an improved method to automatically control the speed of the user in 3D virtual environment navigation. The main benefit of our approach is that it automatically adapts the navigation speed in a manner that enables efficient navigation with maximum freedom, while still avoiding collisions. The results of a usability test show a significant reduction in completion time for a multi-scale navigation task.},
keywords = {3D navigation, speed control},
note = {Computer Graphics International},
}
@inproceedings{blum2019immersiveanalytics,
title = {Immersive Analytics Sensemaking on Different Platforms},
author = {Blum*, Sebastian and Cetin*, Gokhan and Stuerzlinger, Wolfgang},
booktitle = {Winter School of Computer Graphics},
series = {WSCG '19, CSRN 2902},
issn = {2464-4617},
year = {2019},
month = {Jan},
pages = {69-80},
url = {http://wscg.zcu.cz/DL/wscg_DL.htm},
doi = {https://doi.org/10.24132/CSRN.2019.2902.2.9},
pdf = {papers/VAonLHRD+VR.pdf},
teaser = {teasers/VAonLHRD+VR.png},
abstract = {In this work we investigated sensemaking activities on different immersive platforms. We observed user behaviours during a classification task on a very large wall-display system (experiment I) and in a modern Virtual Reality headset (experiment II). In experiment II, we also evaluated a condition with a VR headset with an extended field of view, through a sparse peripheral display. We evaluated the results across the two studies by analyzing quantitative and qualitative data, such as task completion time, number of classifications, followed strategies, and shape of clusters. The results showed differences in user behaviours between the different immersive platforms, i.e., the very large display wall and the VR headset. Even though quantitative data showed no significant differences, qualitatively, users used additional strategies on the wall-display, which hints at a deeper level of sensemaking compared to a VR Headset. The qualitative and quantitative results of the comparison between VR Headsets do not indicate that users perform differently with a VR Headset with an extended field of view.},
keywords = {immersive analytics, virtual reality, large display system, immersive display system, large display interaction, V4Space},
}
@inproceedings{alharbi2019wisetype,
title = {{WiseType}: A Tablet Keyboard with Color-Coded Visualization and Various Editing Options for Error Correction},
author = {Alharbi*, Ohoud and Arif, Ahmed Sabbir and Stuerzlinger, Wolfgang and Dunlop, Mark D. and Komninos, Andreas},
booktitle = {Graphics Interface},
series = {GI '19},
year = {2019},
month = {May},
articleno = {4},
numpages = {10},
doi = {https://doi.org/10.20380/GI2019.04},
pdf = {papers/wisetype.pdf},
video = {videos/wisetype.mp4},
teaser = {teasers/wisetype.png},
abstract = {To address the problem of improving text entry accuracy in mobile devices, we present a new tablet keyboard that offers both immediate and delayed feedback on language quality through auto-correction, prediction, and grammar checking. We combine different visual representations for grammar and spelling errors, accepted predictions, and auto-corrections. and also support interactive swiping/tapping features and improved interaction with previous errors, predictions, and auto-corrections. Additionally, we added smart error correction features to the system to decrease the overhead of correcting errors and to decrease the number of operations. We designed our new input method with an iterative user-centered approach through multiple pilots. We conducted a lab-based study with a refined experimental methodology and found that WiseType outperforms a standard keyboard in terms of text entry speed and error rate. The study shows that color-coded text background highlighting and underlining of potential mistakes in combination with fast correction methods can improve both writing speed and accuracy.},
keywords = {text entry, autocorrect, errors},
award = {This work received a Michael J Sweeney Best HCI Student Paper Award},
}
@inproceedings{sun2019selecting,
title = {Selecting and Sliding Hidden Objects in {3D} Desktop Environments},
author = {Sun*, Junwei and Stuerzlinger, Wolfgang},
booktitle = {Graphics Interface},
series = {GI '19},
year = {2019},
month = {May},
articleno = {8},
numpages = {8},
doi = {https://doi.org/10.20380/GI2019.08},
pdf = {papers/transparency.pdf},
video = {videos/transparency.mp4},
teaser = {teasers/transparency.png},
abstract = {Selecting and positioning objects in 3D space are fundamental tasks in 3D user interfaces. We present two new techniques to improve 3D selection and positioning. We first augment 3D user interfaces with a new technique that enables users to select objects that are hidden from the current viewpoint. This layer-based technique for selecting hidden objects works for arbitrary objects and scenes. We then also extend a mouse-based sliding technique to work even if the manipulated object is hidden behind other objects, by making the manipulated object always fully visible through a transparency mask during drag-and-drop positioning. Our user study shows that with the new techniques, users can easily select hidden objects and that sliding with transparency performs faster than the common 3D widgets technique.},
keywords = {3D manipulation, 3D positioning, sliding, transparency},
}
@inproceedings{machuca2019stereo,
title = {The Effect of Stereo Display Deficiencies on Virtual Hand Pointing},
author = {Barrera Machuca*, Mayra D. and Stuerzlinger, Wolfgang},
booktitle = {Conference on Human Factors in Computing Systems},
publisher = {ACM},
series = {CHI '19},
year = {2019},
month = {May},
articleno = {207},
numpages = {14},
doi = {https://doi.org/10.1145/3290605.3300437},
pdf = {papers/virtualhandfitts.pdf},
video = {videos/virtualhandfitts.mp4},
teaser = {teasers/virtualhandfitts.png},
abstract = {The limitations of stereo display systems affect depth perception, e.g., due to the vergence-accommodation conflict or diplopia. We performed three studies to understand how stereo display deficiencies impact 3D pointing for targets in front of a screen and close to the user, i.e., in peripersonal space. Our first two experiments compare movements with and without a change in visual depth for virtual respectively physical targets. Results indicate that selecting targets along the depth axis is slower and has less throughput for virtual targets, while physical pointing demonstrates the opposite result. We then propose a new 3D extension for Fitts' law that models the effect of stereo display deficiencies. Next, our third experiment verifies the model and measures more broadly how the change in visual depth between targets affects pointing performance in peripersonal space and confirms significant effects on time and throughput. Finally, we discuss implications for 3D user interface design.},
keywords = {3D pointing, mid-air, stereo},
}
@inproceedings{yamanaka2019lassomodel,
title = {Modeling Fully and Partially Constrained Lasso Movements in a Grid of Icons},
author = {Yamanaka, Shota and Stuerzlinger, Wolfgang},
booktitle = {Conference on Human Factors in Computing Systems},
publisher = {ACM},
series = {CHI '19},
year = {2019},
month = {May},
articleno = {120},
numpages = {12},
doi = {https://doi.org/10.1145/3290605.3300350},
pdf = {papers/gridlassomodel.pdf},
teaser = {teasers/gridlassomodel.png},
abstract = {Lassoing objects is a basic function in illustration software and presentation tools. Yet, for many common object arrangements lassoing is sometimes time-consuming to perform and requires precise pen operation. In this work, we studied lassoing movements in a grid of objects similar to icons. We propose a quantitative model to predict the time to lasso such objects depending on the margins between icons, their sizes, and layout, which all affect the number of stopping and crossing movements. Results of two experiments showed that our models predict fully and partially constrained movements with high accuracy. We also analyzed the speed profiles and pen stroke trajectories and identified deeper insights into user behaviors, such as that an unconstrained area can induce higher movement speeds even in preceding path segments.},
keywords = {lasso, steering, group selection},
}
@inproceedings{jiang2019orclayout,
title = {{ORC} Layout: Adaptive {GUI} Layout with {OR}-Constraints},
author = {Jiang*, Yue and Du*, Ruofei and Lutteroth, Christof and Stuerzlinger, Wolfgang},
booktitle = {Conference on Human Factors in Computing Systems},
publisher = {ACM},
series = {CHI '19},
year = {2019},
month = {May},
articleno = {413},
numpages = {12},
doi = {https://doi.org/10.1145/3290605.3300643},
pdf = {papers/orclayout.pdf},
video = {videos/orclayout.mp4},
teaser = {teasers/orclayout.png},
abstract = {We propose a novel approach for constraint-based graphical user interface (GUI) layout based on OR-constraints (ORC) in standard soft/hard linear constraint systems. ORC layout unifies grid layout and flow layout, supporting both their features as well as cases where grid and flow layouts individually fail. We describe ORC design patterns that enable designers to safely create flexible layouts that work across different screen sizes and orientations. We also present the ORC Editor, a GUI editor that enables designers to apply ORC in a safe and effective manner, mixing grid, flow and new ORC layout features as appropriate. We demonstrate that our prototype can adapt layouts to screens with different aspect ratios with only a single layout specification, easing the burden of GUI maintenance. Finally, we show that ORC specifications can be modified interactively and solved efficiently at runtime.},
keywords = {GUI, layout, constraints},
}
@inproceedings{kruijff2019flexurface,
title = {Multilayer Haptic Feedback for Pen-Based Tablet Interaction},
author = {Kruijff, Ernst and Biswas*, Saugata and Trepkowski*, Christina and Maiero*, Jens and Ghinea, George and Stuerzlinger, Wolfgang},
booktitle = {Conference on Human Factors in Computing Systems},
publisher = {ACM},
series = {CHI '19},
year = {2019},
month = {May},
articleno = {143},
numpages = {14},
doi = {https://doi.org/10.1145/3290605.3300373},
pdf = {papers/flexurface.pdf},
video = {videos/flexurface.mp4},
teaser = {teasers/flexurface.png},
abstract = {We present a novel, multilayer interaction approach that enables state transitions between spatially above-screen and 2D on-screen feedback layers. This approach supports the exploration of haptic features that are hard to simulate using rigid 2D screens. We accomplish this by adding a haptic layer above the screen that can be actuated and interacted with (pressed on) while the user interacts with on-screen content using pen input. The haptic layer provides variable firmness and contour feedback, while its membrane functionality affords additional tactile cues like texture feedback. Through two user studies, we look at how users can use the layer in haptic exploration tasks, showing that users can discriminate well between different firmness levels, and can perceive object contour characteristics. Demonstrated also through an art application, the results show the potential of multilayer feedback to extend on-screen feedback with additional widget, tool and surface properties, and for user guidance.},
keywords = {haptics, multilayer, pen},
}
@inproceedings{batmaz2019nidit,
title = {Effects of {3D} Rotational Jitter and Selection Methods on {3D} Pointing Tasks},
author = {Batmaz, Anil Ufuk and Stuerzlinger, Wolfgang},
booktitle = {Workshop on Novel Input Devices and Interaction Techniques at {VR}},
publisher = {IEEE},
series = {NIDIT '19},
year = {2019},
month = {Mar},
pages = {1687-1692},
doi = {https://doi.org/10.1109/VR.2019.8798038},
pdf = {papers/rotjitterselection.pdf},
abstract = {3D pointing is an integral part of Virtual Reality interaction. Typical pointing devices rely on 3D trackers and are thus subject to fluctuations in the reported pose, i.e., jitter. In this work, we explored how different levels of rotational jitter affect pointing performance and if different selection methods can mitigate the effects of jitter. Towards this, we designed a Fitts' Law experiment with three selection methods. In the first method, subjects used a single controller to position and select the object. In the second method, subjects used the controller in their dominant hand to point at objects and the trigger button of a second controller, held in their non-dominant hand, to select objects. Finally, subjects used the controller in their dominant hand to point the objects and pressed the space bar on a keyboard to select the object in the third condition. During the pointing task we added five different levels of jitter: no jitter, ±0.5°, ±1°, and ±2° uniform noise, as well as White Gaussian noise with 1° standard deviation. Results showed that the Gaussian noise and ±2° of jitters significantly reduced the throughput of the participants. Moreover, subjects made fewer errors when they performed the experiment with two controllers. Our results inform the design of 3D user interfaces, input devices and interaction techniques.},
keywords = {3D pointing, jitter},
}
@inproceedings{batmaz2019stereo,
title = {Do Head-Mounted Display Stereo Deficiencies Affect {3D} Pointing Tasks in {AR} and {VR}?},
author = {Batmaz, Anil Ufuk and Barrera Machuca*, Mayra D. and Pham*, Duc-Minh and Stuerzlinger, Wolfgang},
booktitle = {Conference on Virtual Reality and {3D} User Interfaces},
publisher = {IEEE},
series = {VR '19},
year = {2019},
month = {Mar},
pages = {585-592},
doi = {https://doi.org/10.1109/VR.2019.8797975},
pdf = {papers/virtualhandARVR.pdf},
video = {videos/virtualhandARVR.mp4},
teaser = {teasers/virtualhandARVR.png},
abstract = {Most AR and VR headsets use stereoscopic displays to show virtual objects in 3D. However, the limitations of current stereo display systems affect depth perception through conflicting depth cues, which then also affect virtual hand interaction in peri-personal space, i.e., within arm's reach. We performed a Fitts' law experiment to better understand the impact of stereo display deficiencies of AR and VR headsets on pointing at close-by targets arranged laterally or along the line of sight. According to our results, the movement direction and the corresponding change in target depth affect pointing time and throughput; subjects' movements towards/away from their head were slower and less accurate than their lateral movements (left/right). However, even though subjects moved faster in AR, we did not observe a significant difference for pointing performance between AR and VR headsets, which means that previously identified differences in depth perception between these platforms seem to have no strong effect on interaction. Our results also help 3D user interface designers understand how changes in target depth affect users' performance in different movement directions in AR and VR.},
keywords = {3D pointing, mid-air, stereo},
}
@inproceedings{marquardt2018audiotactile,
title = {Audio-Tactile Proximity Feedback for Enhancing {3D} Manipulation},
author = {Marquardt*, Alexander and Kruijff, Ernst and Trepkowski*, Christina and Maiero*, Jens and Schwandt, Andrea and Hinkenjann, André and Stuerzlinger, Wolfgang and Schöning, Johannes},
booktitle = {24th Symposium on Virtual Reality Software and Technology},
publisher = {ACM},
series = {VRST '18},
year = {2018},
month = {Nov},
articleno = {2},
numpages = {10},
doi = {https://doi.org/10.1145/3281505.3281525},
pdf = {papers/tactaproximity.pdf},
teaser = {teasers/tactaproximity.png},
abstract = {In presence of conflicting or ambiguous visual cues in complex scenes, performing 3D selection and manipulation tasks can be challenging. To improve motor planning and coordination, we explore audio-tactile cues to inform the user about the presence of objects in hand proximity, e.g., to avoid unwanted object penetrations. We do so through a novel glove-based tactile interface, enhanced by audio cues. Through two user studies, we illustrate that proximity guidance cues improve spatial awareness, hand motions, and collision avoidance behaviors, and show how proximity cues in combination with collision and friction cues can significantly improve performance.},
keywords = {haptics, tactile feedback, 3D manipulation},
}
@inproceedings{marquardt2018guidance,
title = {Tactile Hand Motion and Pose Guidance for {3D} Interaction},
author = {Marquardt*, Alexander and Maiero*, Jens and Kruijff, Ernst and Trepkowski*, Christina and Schwandt, Andrea and Hinkenjann, André and Schöning, Johannes and Stuerzlinger, Wolfgang},
booktitle = {24th Symposium on Virtual Reality Software and Technology},
publisher = {ACM},
series = {VRST '18},
year = {2018},
month = {Nov},
articleno = {3},
numpages = {10},
doi = {https://doi.org/10.1145/3281505.3281526},
pdf = {papers/tactaguide.pdf},
video = {videos/tactaguide.mp4},
teaser = {teasers/tactaguide.png},
abstract = {We present a novel forearm-and-glove tactile interface that can enhance 3D interaction by guiding hand motor planning and coordination. In particular, we aim to improve hand motion and pose actions related to selection and manipulation tasks. Through our user studies, we illustrate how tactile patterns can guide the user, by triggering hand pose and motion changes, for example to grasp (select) and manipulate (move) an object. We discuss the potential and limitations of the interface, and outline future work.},
keywords = {haptics, guidance, tactile feedback, 3D manipulation},
}
@inproceedings{cetin2018valarge,
title = {Visual Analytics on Large Displays: Exploring User Spatialization and How Size and Resolution Affect Task Performance},
author = {Cetin*, Gokhan and Stuerzlinger, Wolfgang and Dill, John},
booktitle = {Symposium on Big Data Visual Analytics},
publisher = {IEEE},
series = {BDVA '18},
year = {2018},
month = {Oct},
pages = {21-30},
doi = {https://doi.org/10.1109/BDVA.2018.8534027},
pdf = {papers/space2VA.pdf},
teaser = {teasers/space2VA.png},
abstract = {Large, high-resolution displays (LHRDs) have been shown to enable increased productivity over conventional monitors. Previous work has identified the benefits of LHRDs for Visual Analytics tasks, where the user is analyzing complex data sets. However, LHRDs are fundamentally different from desktop and mobile computing environments, presenting some unique usability challenges and opportunities, and need to be better understood. There is thus a need for additional studies to analyze the impact of LHRD size and display resolution on content spatialization strategies and Visual Analytics task performance. We present the results of two studies of the effects of physical display size and resolution on analytical task successes and also analyze how participants spatially cluster visual content in different display conditions. Overall, we found that navigation technique preferences differ significantly among users, that the wide range of observed spatialization types suggest several different analysis techniques are adopted, and that display size affects clustering task performance whereas display resolution does not.},
keywords = {visual analytics, visualization, large display system, large display interaction, V4Space},
}
@inproceedings{elmeseery2018dynspace,
title = {Multiple Workspaces in Visual Analytics},
author = {El Meseery*, Maha and Wu*, Yuyao and Stuerzlinger, Wolfgang},
booktitle = {Symposium on Big Data Visual Analytics},
publisher = {IEEE},
series = {BDVA '18},
year = {2018},
month = {Oct},
pages = {70-81},
doi = {https://doi.org/10.1109/BDVA.2018.8534019},
pdf = {papers/dynspace.pdf},
video = {videos/dynspace.mp4},
teaser = {teasers/dynspace.png},
abstract = {Exploratory visual analysis is an iterative process, where analysts often start from an overview of the data. Subsequently, they often pursue different hypotheses through multiple rounds of interaction and analysis. Commercial visualization packages support mostly a model with a single analysis path, where the system view represents only the final state of the users' current analysis. In this paper, we investigate the benefit of using multiple workspaces to support alternative analyses, enabling users to create different workspaces to pursue multiple analysis paths at the same time. We implemented a prototype for multiple workspaces using a multi-tab design in a visual analytics system. The results of our user studies show that multiple workspaces: enable analysts to work on concurrent tasks, work well for organizing an analysis, and make it easy to revisit previous parts of their work.},
keywords = {visual analytics, visualization, alternatives, scenarios},
}
@inproceedings{machuca2018multiplanes,
title = {Multiplanes: Assisted Freehand VR Sketching},
author = {Barrera Machuca*, Mayra D. and Asente, Paul and Lu*, Jingwan and Kim, Byungmoon and Stuerzlinger, Wolfgang},
booktitle = {Symposium on Spatial User Interaction},
publisher = {ACM},
series = {SUI '18},
year = {2018},
month = {Oct},
pages = {36-47},
doi = {https://doi.org/10.1145/3267782.3267786},
pdf = {papers/multiplanes.pdf},
video = {videos/multiplanes.mp4},
teaser = {teasers/multiplanes.png},
abstract = {The presence of a third dimension makes accurate drawing in virtual reality (VR) more challenging than 2D drawing. These challenges include higher demands on spatial cognition and motor skills, as well as the potential for mistakes caused by depth perception errors. We present Multiplanes, a VR drawing system that supports both the flexibility of freehand drawing and the ability to draw accurate shapes in 3D by affording both planar and beautified drawing. The system was designed to address the above-mentioned challenges. Multiplanes generates snapping planes and beautification trigger points based on previous and current strokes and the current controller pose. Based on geometrical relationships to previous strokes, beautification trigger points serve to guide the user to reach specific positions in space. The system also beautifies user's strokes based on the most probable intended shape while the user is drawing them. With Multiplanes, in contrast to other systems, users do not need to manually activate such guides, allowing them to focus on the creative process.},
keywords = {3D sketching, 3D drawing, 3D modeling, 3D user interfaces},
}
@inproceedings{sun2018comparing,
title = {Comparing Input Methods and Cursors for {3D} Positioning with Head-Mounted Displays},
author = {Sun*, Junwei and Stuerzlinger, Wolfgang and Riecke, Bernhard E.},
booktitle = {15th Symposium on Applied Perception},
publisher = {ACM},
series = {SAP '18},
year = {2018},
month = {Aug},
articleno = {8},
numpages = {8},
doi = {https://doi.org/10.1145/3225153.3225167},
pdf = {papers/input4VR.pdf},
teaser = {teasers/input4VR.png},
abstract = {Moving objects is an important task in 3D user interfaces. In this work, we focus on (precise) 3D object positioning in immersive virtual reality systems, especially head-mounted displays (HMDs). To evaluate input method performance for 3D positioning, we focus on an existing sliding algorithm, in which objects slide on any contact surface. Sliding enables rapid positioning of objects in 3D scenes on a desktop system but is yet to be evaluated in an immersive system. We performed a user study that compared the efficiency and accuracy of different input methods (mouse, hand-tracking, and trackpad) and cursor display conditions (stereo cursor and one-eyed cursor) for 3D positioning tasks with the HTC Vive. The results showed that the mouse outperformed hand-tracking and the trackpad, in terms of efficiency and accuracy. Stereo cursor and one-eyed cursor did not demonstrate a significant difference in performance, yet the stereo cursor condition was rated more favourable. For situations where the user is seated in immersive VR, the mouse is thus still the best input device for precise 3D positioning.},
keywords = {3D positioning, input device},
}
@inproceedings{yamanaka2018steering,
title = {Steering Through Successive Objects},
author = {Yamanaka*, Shota and Stuerzlinger, Wolfgang and Miyashita, Homei},
booktitle = {Conference on Human Factors in Computing Systems},
publisher = {ACM},
series = {CHI '18},
year = {2018},
month = {Apr},
articleno = {603},
numpages = {13},
doi = {https://doi.org/10.1145/3173574.3174177},
pdf = {papers/steervscross.pdf},
teaser = {teasers/steervscross.png},
abstract = {We investigate stroking motions through successive objects with styli. There are several promising models for stroking motions, such as crossing tasks, which require endpoint accuracy of a stroke, or steering tasks, which require continuous accuracy throughout the trajectory. However, a task requiring users to repeatedly steer through constrained path segments has never been studied, although such operations are needed in GUIs, e.g., for selecting icons or objects on illustration software through lassoing. We empirically confirmed that the interval, trajectory width, and obstacle size significantly affect the movement speed. Existing models can not accurately predict user performance in such tasks. We found several unexpected results such as that steering through denser objects sometimes required less times than expected. Speed profile analysis showed the reasons behind such behaviors, such as participants' anticipation strategies. We also discuss the applicability of exiting performance models and revisions.},
keywords = {steering, lasso, group selection},
}
@inproceedings{ortega2018wiggle,
title = {Pointing at Wiggle {3D} Displays},
author = {Ortega, Michael and Stuerzlinger, Wolfgang},
booktitle = {Conference on Virtual Reality and {3D} User Interfaces},
publisher = {IEEE},
series = {VR '18},
year = {2018},
month = {Mar},
pages = {335-340},
doi = {https://doi.org/10.1109/VR.2018.8447552},
pdf = {papers/wigglepoint.pdf},
video = {videos/wigglepoint.m4v},
teaser = {teasers/wigglepoint.png},
abstract = {This paper presents two new pointing techniques for wiggle 3D displays, which present the 2D projection of 3D content with automatic (rotatory) motion parallax. Standard pointing at targets in wiggle 3D displays is challenging as the content is constantly in motion. The two pointing techniques presented here take advantage of the cursor's current position or the user's gaze direction for collocating the wiggle rotation center and potential targets. We evaluate the performance of the pointing techniques with a novel methodology that integrates 3D distractors into the ISO-9241-9 standard task. The experimental results indicate that the new techniques are significantly more efficient than standard pointing techniques in wiggle 3D displays. Given that we observed no performance variation for different targets, our new techniques seem to negate any interaction performance penalties of wiggle 3D displays.},
keywords = {3D pointing},
}
@inproceedings{nguyenvo2018referenceframe,
title = {Simulated Reference Frame: A Cost-Effective Solution to Improve Spatial Orientation in {VR}},
author = {Nguyen-Vo*, Thinh and Riecke, Bernhard E. and Stuerzlinger, Wolfgang},
booktitle = {Conference on Virtual Reality and {3D} User Interfaces},
publisher = {IEEE},
series = {VR '18},
year = {2018},
month = {Mar},
pages = {415-422},
doi = {https://doi.org/10.1109/VR.2018.8446383},
pdf = {papers/spatialreferenceframe.pdf},
teaser = {teasers/spatialreferenceframe.png},
abstract = {Virtual Reality (VR) is increasingly used in spatial cognition research, as it offers high experimental control in naturalistic multimodal environments, which is hard to achieve in real-world settings. Although recent technological advances offer a high level of photorealism, locomotion in VR is still restricted because people might not perceive their self-motion as they would in the real world. This might be related to the inability to use embodied spatial orientation processes, which support automatic and obligatory updating of our spatial awareness. Previous research has identified the roles reference frames play in retaining spatial orientation. Here, we propose using visually overlaid rectangular boxes, simulating reference frames in VR, to provide users with a better insight into spatial direction in landmark-free virtual environments. The current mixed-method study investigated how different variations of the visually simulated reference frames might support people in a navigational search task. Performance results showed that the existence of a simulated reference frame yields significant effects on participants completion time and travel distance. Though a simulated CAVE translating with the navigator (one of the simulated reference frames) did not provide significant benefits, the simulated room (another simulated reference frame depicting a rest frame) significantly boosted user performance in the task as well as improved participants preference in the post-experiment evaluation. Results suggest that adding a visually simulated reference frame to VR applications might be a cost-effective solution to the spatial disorientation problem in VR.},
keywords = {3D navigation},
}
@inproceedings{tran2017virtualarm,
title = {Effects of Virtual Arm Representations on Interaction in Virtual Environments},
author = {Tran+, Tanh Quang and Shin*, HyunJu and Stuerzlinger, Wolfgang and Han, JungHyun},
booktitle = {23rd Symposium on Virtual Reality Software and Technology},
publisher = {ACM},
series = {VRST '17},
year = {2017},
month = {Nov},
articleno = {40},
numpages = {9},
doi = {https://doi.org/10.1145/3139131.3139149},
pdf = {papers/armrepresentation.pdf},
teaser = {teasers/armrepresentation.png},
abstract = {Many techniques for visualization and interaction that potentially increase user performance have been studied in the growing field of virtual reality. However, the effects of virtual-arm representations on users' performance and perception in selection tasks have not been studied before. This paper presents the results of a user study of three different representations of the virtual arm: "hand only," "hand+forearm," and "whole arm" which includes the upper arm. In addition to the representations' effects on performance and perception in selection tasks, we investigate how the users' performance changes depending on whether collisions with objects are allowed or not. The relationship between the virtual-arm representations and the senses of agency and ownership are also explored. Overall, we found that the "whole arm" condition performed worst.},
keywords = {3D pointing, presence},
}
@inproceedings{putze2017eeg,
title = {Automatic Classification of Auto-Correction Errors in Predictive Text Entry Based on {EEG} and Context Information},
author = {Putze, Felix and Schünemann*, Maik and Schultz, Tanja and Stuerzlinger, Wolfgang},
booktitle = {19th Conference on Multimodal Interaction},
publisher = {ACM},
series = {ICMI '17},
year = {2017},
month = {Nov},
pages = {137–145},
doi = {https://doi.org/10.1145/3136755.3136784},
pdf = {papers/classifyAutoCorrectEEG.pdf},
teaser = {teasers/classifyAutoCorrectEEG.png},
abstract = {State-of-the-art auto-correction methods for predictive text entry systems work reasonably well, but can never be perfect due to the properties of human language. We present an approach for the automatic detection of erroneous auto-corrections based on brain activity and text-entry-based context features. We describe an experiment and a new system for the classification of human reactions to auto-correction errors. We show how auto-correction errors can be detected with an average accuracy of 85%.},
keywords = {EEG, text entry, autocorrect, errors},
}
@inproceedings{zaman2017mace,
title = {{MACE}: A New Interface for Comparing and Editing of Multiple Alternative Documents for Generative Design},
author = {Zaman, Loutfouz and Stuerzlinger, Wolfgang and Neugebauer+, Christian},
booktitle = {Symposium on Document Engineering},
publisher = {ACM},
series = {DocEng '17},
year = {2017},
month = {Sep},
pages = {67–76},
doi = {https://doi.org/10.1145/3103010.3103013},
pdf = {papers/mace.pdf},
teaser = {teasers/mace.png},
abstract = {We present a new interface for interactive comparisons of more than two alternative documents in the context of a generative design system that uses generative data-flow networks defined via directed acyclic graphs. To better show differences between such networks, we emphasize added, deleted, (un)changed nodes and edges. We emphasize differences in the output as well as parameters using highlighting and enable post-hoc merging of the state of a parameter across a selected set of alternatives. To minimize visual clutter, we introduce new difference visualizations for selected nodes and alternatives using additive and subtractive encodings, which improve readability and keep visual clutter low. We analyzed similarities in networks from a set of alternative designs produced by architecture students and found that the number of similarities outweighs the differences, which motivates use of subtractive encoding. We ran a user study to evaluate the two main proposed difference visualization encodings and found that they are equally effective.},
keywords = {alternatives, difference visualization, design},
}
@inproceedings{zeidler2017automatic,
title = {Automatic Generation of User Interface Layouts for Alternative Screen Orientations},
author = {Zeidler*, Clemens and Weber, Gerald and Stuerzlinger, Wolfgang and Lutteroth, Christof},
booktitle = {Human-Computer Interaction},
publisher = {Springer},
series = {INTERACT '17},
year = {2017},
month = {Sep},
volume = {LNCS 10513},
pages = {13-35},
doi = {https://doi.org/10.1007/978-3-319-67744-6_2},
pdf = {papers/autoorientlayout.pdf},
video = {videos/autoorientlayout.mp4},
teaser = {teasers/autoorientlayout.png},
abstract = {Creating multiple layout alternatives for graphical user interfaces to accommodate different screen orientations for mobile devices is labor intensive. Here, we investigate how such layout alternatives can be generated automatically from an initial layout. Providing good layout alternatives can inspire developers in their design work and support them to create adaptive layouts. We performed an analysis of layout alternatives in existing apps and identified common real-world layout transformation patterns. Based on these patterns we developed a prototype that generates landscape and portrait layout alternatives for an initial layout. In general, there is a very large number of possibilities of how widgets can be rearranged. For this reason we developed a classification method to identify and evaluate "good" layout alternatives automatically. From this set of "good" layout alternatives, designers can choose suitable layouts for their applications. In a questionnaire study we verified that our method generates layout alternatives that appear well structured and are easy to use.},
keywords = {GUI, layout},
award = {This work received a Reviewer's Choice Award},
}
@inproceedings{bjerre2017predictive,
title = {Predictive Model for Group Selection Performance on Touch Devices},
author = {Bjerre+, Per and Christensen+, Allan and Pedersen+, Andreas Køllund and Pedersen+, Simon André and Stuerzlinger, Wolfgang and Stenholt, Rasmus},
booktitle = {Human-Computer Interaction, Interaction Contexts},
publisher = {Springer},
series = {HCI International '17},
year = {2017},
month = {Jul},
volume = {LNCS 10272},
pages = {142-161},
doi = {https://doi.org/10.1007/978-3-319-58077-7_12},
pdf = {papers/lazytouch.pdf},
teaser = {teasers/lazytouch.png},
abstract = {Users spend hours making selections with ineffective tools, we therefore examine selection methods for efficiency in various touch trials. In a preliminary study three alternative selection methods were identified, we compared these to a smart selection tool. The study showed that a single selection method was the fastest; however, when the amount of targets increased, a multiple selection tool became more efficient. A secondary study with more targets revealed similar results. We therefore examined the single selection method against traditional selection methods in a user study. The results reveal a model of the average action and time cost for all methods within the parameters of mental preparation and target addition. The study revealed that the most favored selection methods were a lasso and brush selection tool. The study provides evidence towards a predictive model of selection performance for multiple target selection trials.},
keywords = {group selection, touch},
}
@inproceedings{yamanaka2017steering,
title = {Steering Through Sequential Linear Path Segments},
author = {Yamanaka*, Shota and Stuerzlinger, Wolfgang and Miyashita, Homei},
booktitle = {Conference on Human Factors in Computing Systems},
publisher = {ACM},
series = {CHI '17},
year = {2017},
month = {May},
pages = {232–243},
doi = {https://doi.org/10.1145/3025453.3025836},
pdf = {papers/pathsequencesteering.pdf},
teaser = {teasers/pathsequencesteering.png},
abstract = {The steering law models human motor performance and has been verified to hold for a single linear and/or circular path. Some extensions investigated steering around corners. Yet, little is known about human performance in navigating joined linear paths, i.e., successions of path segments with different widths. Such operations appear in graphical user interface tasks, including lasso operations in illustration software. In this work, we conducted several experiments involving joined paths. The results show that users significantly changed their behavior, and that this strategy change can be predicted beforehand. A simple model summing the two indexes of difficulty (IDs) for each path predicts movement time well, but more sophisticated models were also evaluated. The best model in terms of both of R2 and AIC values includes the ID of the crossing operation to enter the second path.},
keywords = {steering, lasso, group selection},
}
@inproceedings{jang2017fatigue,
title = {Modeling Cumulative Arm Fatigue in Mid-Air Interaction Based on Perceived Exertion and Kinetics of Arm Motion},
author = {Jang*, Sujin and Stuerzlinger, Wolfgang and Ambike, Satyajit and Ramani, Karthik},
booktitle = {Conference on Human Factors in Computing Systems},
publisher = {ACM},
series = {CHI '17},
year = {2017},
month = {May},
pages = {3328–3339},
doi = {https://doi.org/10.1145/3025453.3025523},
url = {https://github.com/CDesignGitHub/Cumulative-Arm-Fatigue_CHI-2017},
pdf = {papers/cumulativearmfatigue.pdf},
teaser = {teasers/cumulativearmfatigue.png},
abstract = {Quantifying cumulative arm muscle fatigue is a critical factor in understanding, evaluating, and optimizing user experience during prolonged mid-air interaction. A reasonably accurate estimation of fatigue requires an estimate of an individual's strength. However, there is no easy-to-access method to measure individual strength to accommodate inter-individual differences. Furthermore, fatigue is influenced by both psychological and physiological factors, but no current HCI model provides good estimates of cumulative subjective fatigue. We present a new, simple method to estimate the maximum shoulder torque through a mid-air pointing task, which agrees with direct strength measurements. We then introduce a cumulative fatigue model informed by subjective and biomechanical measures. We evaluate the performance of the model in estimating cumulative subjective fatigue in mid-air interaction by performing multiple cross-validations and a comparison with an existing fatigue metric. Finally, we discuss the potential of our approach for real-time evaluation of subjective fatigue as well as future challenges.},
keywords = {fatigue, mid-air, model},
}
@inproceedings{yamanaka2017analysis,
title = {Analysis and Modeling of Steering Behavior of Connected Straight Paths},
author = {Yamanaka*, Shota and Stuerzlinger, Wolfgang and Miyashita, Homei},
booktitle = {Interaction},
year = {2017},
month = {Mar},
pages = {17-26},
url = {http://www.interaction-ipsj.org/proceedings/2017},
pdf = {papers/steeringanalysis.pdf},
teaser = {teasers/steeringanalysis.png},
commented-title = {Analysis and Modeling of the Operation of Steering a Connected Linear Route},
abstract = {The steering law models human motor performance and has been verified to hold for a single linear and/or circular path. Some extensions investigated steering around corners. Yet, little is known about human performance in navigating joined linear paths, i.e., successions of path segments with different widths, although such operations appear in our graphical user interface tasks, including lasso operations in illustration software. In this work, we conducted three experiments involving joined paths. The results showed that users significantly changed their behavior, and that that strategy change can be determined beforehand. A simple model summing the two indexes of difficulty (IDs) for each path was efficient to predict the time (R2 > 0.96), but more sophisticated models were also evaluated. The best model includes the ID of the crossing operation to enter the second path, in terms of both of R2 and AIC values.},
keywords = {steering, lasso, group selection},
award = {This work received a Best Paper Award},
note = {In Japanese},
}
@inproceedings{kim2016holostation,
title = {{HoloStation}: Augmented Visualization and Presentation},
author = {Kim*, Minju and Lee*, Jungjin and Stuerzlinger, Wolfgang and Wohn, Kwangyun},
booktitle = {{SIGGRAPH} {ASIA} Symposium on Visualization},
publisher = {ACM},
series = {SA Vis '16},
year = {2016},
month = {Dec},
articleno = {12},
numpages = {9},
doi = {https://doi.org/10.1145/3002151.3002161},
pdf = {papers/holostation.pdf},
teaser = {teasers/holostation.png},
abstract = {As much as stories need to be told, images need to be presented. Although visualizations are meant to be self-explanatory, often enhancing their expressive power by incorporating a certain degree of interactivity, visualized images today often fail to encourage the active engagement of the user/audience. In many cases, interactive interventions by a human presenter have the potential to drastically improve the engagement with visualization. Rather than just showing the content, the presenter then enhances information delivery, e.g., by providing the context of the visualization. In this paper, we propose a novel concept called augmented presentation in which the human presenter occupies the same physical space as the visualized information, thereby presenting and interacting with the visualized images seamlessly. Depending on the level of engagement the presenter's role may vary: from a simple storyteller to an augmented presenter who may be regarded as a part of the visualized entity. To further the development of the new idea of augmented presentation, we have designed, implemented, and user-tested a visualization system named HoloStation. The presenter is placed between two projection screens: the front one is half-mirrored and the rear one is a conventional wall screen. The 3D stereoscopic images are rendered to appear in-between, thereby creating a coherent 3D visualization space filled with digital information and the human presenter. We have conducted a controlled experiment to investigate the subjective level of immersion and engagement of the audience with HoloStation compared to the traditional presentation. Our results suggest that our new form of augmented presentation has a potential not only to enhance the quality of information presentation but also to enrich the user experience on visualizations.},
keywords = {stereo, display, augmented reality},
}
@inproceedings{waese2016rsvp,
title = {An Evaluation of Interaction Methods for Controlling RSVP Displays in Visual Search Tasks},
author = {Waese*, Jamie and Stuerzlinger, Wolfgang and Provart, Nicholas},
booktitle = {Symposium on Big Data Visual Analytics},
publisher = {IEEE},
series = {BDVA '16},
year = {2016},
month = {Nov},
pages = {1-8},
doi = {https://doi.org/10.1109/BDVA.2016.7787041},
pdf = {papers/rsvp.pdf},
teaser = {teasers/rsvp.png},
abstract = {Accurately identifying images with subtly varying features from a large set of similar images can be a challenging task. To succeed, viewers must perceive subtle differences between multiple nearly identical images and react appropriately. The Rapid Serial Visual Presentation (RSVP) display technique has the potential to improve performance as it exploits our ability to preattentively recognize differences between images when they are flashed on a screen in a rapid and serial manner. We compared the speed and accuracy of three RSVP interface methods ("Hover", "Slide Show" and "Velocity") against a traditional "Point & Click" non-RSVP interface to test whether an RSVP display improves performance in visual search tasks. In a follow-up study we compared "Hover" and "Velocity" RSVP interface methods against a "Small Multiples" non-RSVP interface to explore the interaction of interface type and target size on visual search tasks. We found the "Hover" RSVP interface to significantly reduce the time it takes to perform visual search tasks with no reduction in accuracy, regardless of the size of the search targets. Beyond the gene identification task tested here, these experiments inform the design of user interfaces for many other visual search tasks.},
keywords = {visual analytics, rsvp, visualization, search},
}
@inproceedings{sun2016depthpop,
title = {Shift-Sliding and Depth-Pop for {3D} Positioning},
author = {Sun*, Junwei and Stuerzlinger, Wolfgang and Shuralyov*, Dmitri},
booktitle = {Symposium on Spatial User Interaction},
publisher = {ACM},
series = {SUI '16},
year = {2016},
month = {Oct},
pages = {69-78},
doi = {https://doi.org/10.1145/2983310.2985748},
pdf = {papers/depthpop.pdf},
video = {videos/depthpop.mp4},
teaser = {teasers/depthpop.png},
abstract = {Moving objects is an important task in 3D user interfaces. We describe two new techniques for 3D positioning, designed for a mouse, but usable with other input devices. The techniques enable rapid, yet easy-to-use positioning of objects in 3D scenes. With sliding, the object follows the cursor and moves on the surfaces of the scene. Our techniques enable precise positioning of constrained objects. Sliding assumes that by default objects stay in contact with the scene's front surfaces, are always at least partially visible, and do not interpenetrate other objects. With our new Shift-Sliding method the user can override these default assumptions and lift objects into the air or make them collide with other objects. Shift-Sliding uses the local coordinate system of the surface that the object was last in contact with, which is a new form of context-dependent manipulation. We also present Depth-Pop, which maps mouse wheel actions to all object positions along the mouse ray, where the object meets the default assumptions for sliding. For efficiency, both methods use frame buffer techniques. Two user studies show that the new techniques significantly speed up common 3D positioning tasks.},
keywords = {3D manipulation, sliding, 3D positioning},
award = {This work received a Best Demonstration Award},
}
@inproceedings{brown2016inair,
title = {Exploring the Throughput Potential of In-Air Pointing},
author = {Brown*, Michelle A. and Stuerzlinger, Wolfgang},
booktitle = {18th International Conference on Human-Computer Interaction. Interaction Platforms and Techniques, Part {II}},
publisher = {Springer},
series = {HCI International '16},
year = {2016},
month = {Jul},
volume = {LNCS 9732},
pages = {13–24},
doi = {https://doi.org/10.1007/978-3-319-39516-6_2},
pdf = {papers/fingercast.pdf},
teaser = {teasers/fingercast.png},
abstract = {We present an analysis of how pointing performance in in-air un-instrumented pointing can be improved, towards throughput equal to the mouse. Pointing using a chopstick is found to achieve the highest average throughput, with 3.89 bps. This is a substantial improvement over using the finger to point at the screen. Two potential reasons for the throughput gap between chopstick and finger operation were explored: the natural curvature of human fingers and tracking issues that occurs when fingers bend toward the device. Yet, neither one of these factors seems to significantly affect throughput. Thus other, yet unexplored factors must be the cause. Lastly, the effect of unreliable click detection was also explored, as this also affects un-instrumented performance, and was found to have a linear effect.},
keywords = {mid-air, 3D pointing, errors},
}
@inproceedings{bjerre2016transition,
title = {Transition Times for Manipulation Tasks in Hybrid Interfaces},
author = {Christensen+, Allan and Pedersen+, Simon André and Bjerre+, Per and Pedersen+, Andreas Køllund and Stuerzlinger, Wolfgang},
booktitle = {18th International Conference on Human-Computer Interaction. Interaction Platforms and Techniques, Part {II}},
publisher = {Springer},
series = {HCI International '16},
year = {2016},
month = {Jul},
volume = {LNCS 9732},
pages = {138-150},
doi = {https://doi.org/10.1007/978-3-319-39516-6_13},
pdf = {papers/transitions.pdf},
teaser = {teasers/transitions.png},
abstract = {Compared to the mouse, uninstrumented in-air interaction has been shown to be slower and less precise for pointing. Yet, in-air input is preferable or advantageous in some interaction scenarios. Thus, we examine a three-device hybrid setup involving the mouse, keyboard, and a Leap Motion. We performed a user study to quantify the costs associated with transitioning between these interaction devices, while performing simple 2D manipulation tasks using the mouse and Leap Motion. We found that transitioning to and from the Leap Motion takes on average 0.87 s longer than those between the mouse and keyboard.},
keywords = {mid-air, 3D manipulation, 3D positioning},
}
@inproceedings{arif2016smartbackspace,
title = {Evaluation of a Smart-Restorable Backspace Technique to Facilitate Text Entry Error Correction},
author = {Arif, Ahmed Sabbir and Kim, Sunjun and Stuerzlinger, Wolfgang and Lee, Geehyuk and Mazalek, Ali},
booktitle = {Conference on Human Factors in Computing Systems},
publisher = {ACM},
series = {CHI '16},
year = {2016},
month = {Apr},
pages = {5151–5162},
doi = {https://doi.org/10.1145/2858036.2858407},
pdf = {papers/smartrestorablebackspace.pdf},
video = {videos/SmartRestorableBackspace.mp4},
teaser = {teasers/smartrestorablebackspace.png},
abstract = {We present a new smart-restorable backspace technique to facilitate correction of "overlooked" errors on touchscreen-based tablets. We conducted an empirical study to compare the new backspace technique with the conventional one. Results of the study revealed that the new technique improves the overall text entry performance, both in terms of speed and operations per character, by significantly reducing error correction efforts. In addition, results showed that most users preferred the new technique to the one they use on their tablets, and found it easy to learn and use. Most of them also felt that it improved their overall text entry performance, thus wanted to keep using it.},
keywords = {text entry, errors},
}
@inproceedings{chan2016microgestures,
title = {User Elicitation on Single-Hand Microgestures},
author = {Chan*, Edwin and Seyed*, Teddy and Stuerzlinger, Wolfgang and Yang, Xing-Dong and Maurer, Frank},
booktitle = {Conference on Human Factors in Computing Systems},
publisher = {ACM},
series = {CHI '16},
year = {2016},
month = {Apr},
pages = {3403–3414},
doi = {https://doi.org/10.1145/2858036.2858589},
pdf = {papers/singlehandmicrogestureelicitation.pdf},
teaser = {teasers/singlehandmicrogestureelicitation.png},
abstract = {Gestural interaction has become increasingly popular, as enabling technologies continue to transition from research to retail. The mobility of miniaturized (and invisible) technologies introduces new uses for gesture recognition. This paper investigates single-hand microgestures (SHMGs), detailed gestures in a small interaction space. SHMGs are suitable for the mobile and discrete nature of interactions for ubiquitous computing. However, there has been a lack of end-user input in the design of such gestures. We performed a user-elicitation study with 16 participants to determine their preferred gestures for a set of referents. We contribute an analysis of 1,632 gestures, the resulting gesture set, and prevalent conceptual themes amongst the elicited gestures. These themes provide a set of guidelines for gesture designers, while informing the designs of future studies. With the increase in hand-tracking and electronic devices in our surroundings, we see this as a starting point for designing gestures suitable to portable ubiquitous computing.},
keywords = {gesture recognition, gestures, elicitation, mid-air},
award = {This work received a Best Paper Honorable Mention Award},
}
@inproceedings{perteneder2016ambientlight,
title = {Glowworms and Fireflies: Ambient Light on Large Interactive Surfaces},
author = {Perteneder*, Florian and Grossauer*, Eva-Maria Beatrix and Leong*, Joanne and Stuerzlinger, Wolfgang and Haller, Michael},
booktitle = {Conference on Human Factors in Computing Systems},
publisher = {ACM},
series = {CHI '16},
year = {2016},
month = {Apr},
pages = {5849–5861},
doi = {https://doi.org/10.1145/2858036.2858524},
pdf = {papers/glowwormsfireflies.pdf},
video = {videos/glowworms.mp4},
teaser = {teasers/glowworms.png},
abstract = {Ambient light is starting to be commercially used to enhance the viewing experience for watching TV. We believe that ambient light can add value in meeting and control rooms that use large vertical interactive surfaces. Therefore, we equipped a large interactive whiteboard with a peripheral ambient light display and explored its utility for different scenarios by conducting two controlled experiments. In the first experiment, we investigated how ambient light can be used for peripheral notifications, and how perception is influenced by the user's position and the type of work they are engaged in. The second experiment investigated the utility of ambient light for off-screen visualization. We condense our findings into several design recommendations that we then applied to application scenarios to show the versatility and usefulness of ambient light for large surfaces.},
keywords = {ambient light, large display system},
}
@inproceedings{makonin2016mixedinitiative,
title = {Mixed-Initiative for Big Data: The Intersection of Human + Visual Analytics + Prediction},
author = {Makonin, Stephen and {McVeigh}+, Daniel and Stuerzlinger, Wolfgang and Tran*, Khoa and Popowich, Fred},
booktitle = {Hawaii International Conference on System Sciences},
publisher = {IEEE},
series = {HICSS '16},
year = {2016},
month = {Jan},
pages = {1427-1436},
doi = {https://doi.org/10.1109/HICSS.2016.181},
pdf = {papers/mixedinitiativesurvey.pdf},
teaser = {teasers/mixedinitiativesurvey.png},
abstract = {Existing surveys in visual analytics focus on the importance of the topic. However, many do not discuss the increasingly critical area of mixed-initiative systems. In this survey we discuss the importance of research in mixed-initiative systems and how it is different from visual analytics and other research fields. We present the conceptual architecture of a mixed-initiative visual analytics system (MIVAS) and the five key components that make up MIVASs (data wrangling, alternative discovery and comparison, parametric interaction, history tracking and exploration, and system agency and adaptation), which forms our main contribution. We compare and contrast different research that claims to be mixed-initiative against MIVASs and show how there is still a considerable amount of work that needs to be accomplished before any system can truly be mixed-initiative.},
keywords = {visual analytics, visualization, mixed initiative},
}
@inproceedings{strothoff2015pinsntouches,
title = {Pins 'n' Touches: An Interface for Tagging and Editing Complex Groups},
author = {Strothoff*, Sven and Stuerzlinger, Wolfgang and Hinrichs, Klaus},
booktitle = {Conference on Interactive Tabletops & Surfaces},
publisher = {ACM},
series = {ITS '15},
year = {2015},
month = {Nov},
pages = {191–200},
doi = {https://doi.org/10.1145/2817721.2817731},
pdf = {papers/pinsntouches.pdf},
video = {videos/pinsntouches.mp4},
teaser = {teasers/pinsntouches.png},
abstract = {Influenced by mouse/pen-based user interfaces, most touch-based object tagging techniques rely mostly on a single interaction point. Once objects are tagged, typically only individual object inclusions/exclusions are possible. Yet, for tagging larger groups with complex spatial layouts, more refinement may be necessary to achieve the desired result. We apply visual tag markers to objects to visualize their group association. Through a new multi-touch pin gesture that "pins" one or more objects "down" while tagging, our new interface is capable of efficiently grouping objects, as identified in our user studies.},
keywords = {touch, group selection},
}
@inproceedings{ortega2015shocam,
title = {{SHOCam}: A {3D} Orbiting Algorithm},
author = {Ortega, Michael and Stuerzlinger, Wolfgang and Scheurich*, Doug},
booktitle = {28th Annual Symposium on User Interface Software & Technology},
publisher = {ACM},
series = {UIST '15},
year = {2015},
month = {Nov},
pages = {119–128},
doi = {https://doi.org/10.1145/2807442.2807496},
pdf = {papers/shocam.pdf},
video = {videos/SHOcam.mp4},
teaser = {teasers/shocam.png},
abstract = {In this paper we describe a new orbiting algorithm, called SHOCam, which enables simple, safe and visually attractive control of a camera moving around 3D objects. Compared with existing methods, SHOCam provides a more consistent mapping between the user's interaction and the path of the camera by substantially reducing variability in both camera motion and look direction. Also, we present a new orbiting method that prevents the camera from penetrating object(s), making the visual feedback - and with it the user experience - more pleasing and also less error prone. Finally, we present new solutions for orbiting around multiple objects and multi-scale environments.},
keywords = {3D navigation, 3D orbiting},
}
@inproceedings{vuibert2015docking,
title = {Evaluation of Docking Task Performance Using Mid-Air Interaction Techniques},
author = {Vuibert*, Vanessa and Stuerzlinger, Wolfgang and Cooperstock, Jeremy R.},
booktitle = {3rd Symposium on Spatial User Interaction},
publisher = {ACM},
series = {SUI '15},
year = {2015},
month = {Aug},
pages = {44–52},
doi = {https://doi.org/10.1145/2788940.2788950},
pdf = {papers/midairdock.pdf},
teaser = {teasers/midairdock.png},
abstract = {Mid-air interaction has the potential to manipulate objects in 3D with more natural input mappings. We compared the performance attainable using various mid-air interaction methods with a mechanically constrained input device in a 6 degrees-of-freedom (DoF) docking task in both accuracy and completion time. We found that tangible mid-air input devices supported faster docking performance, while exhibiting accuracy close to that of constrained devices. Interaction with bare hands in mid-air achieved similar time performance and accuracy compared to the constrained device.},
keywords = {3D manipulation, 3D positioning, docking, mid-air},
}
@inproceedings{teather2015factors,
title = {Factors Affecting Mouse-Based {3D} Selection in Desktop {VR} Systems},
author = {Teather, Robert J. and Stuerzlinger, Wolfgang},
booktitle = {3rd Symposium on Spatial User Interaction},
publisher = {ACM},
series = {SUI '15},
year = {2015},
month = {Aug},
pages = {10–19},
doi = {https://doi.org/10.1145/2788940.2788946},
pdf = {papers/mousestereo.pdf},
video = {videos/mousestereo.mp4},
teaser = {teasers/mousestereo.png},
abstract = {We present two experiments on mouse-based point selection in a desktop virtual reality system using stereo display and head-tracking. To address potential issues of using a mouse cursor with stereo display, we also evaluate the impact of using a one-eyed (mono) cursor. While a one-eyed cursor visualization eliminates depth conflicts, recent work suggests it offers worse performance than stereo cursors, possibly due to eye discomfort. Our results indicate that presenting the cursor in stereo significantly reduces performance for targets at different depths. The one-eyed cursor eliminates this effect, offering better performance than both screen-plane and geometry-sliding cursors visualized in stereo. However, it also performed slightly worse than stereo cursors in situations without depth conflicts. Our study suggests that this difference is not due exclusively to the relative transparency of such a cursor, hence eye fatigue or similar may be responsible.},
keywords = {3D positioning, stereo},
}
@inproceedings{zaman2015gemni,
title = {{GEM-NI}: A System for Creating and Managing Alternatives In Generative Design},
author = {Zaman*, Loutfouz and Stuerzlinger, Wolfgang and Neugebauer+, Christian and Woodbury, Robert and Elkhaldi*, Maher and Shireen*, Naghmi and Terry, Michael},
booktitle = {33rd Annual ACM Conference on Human Factors in Computing Systems},
publisher = {ACM},
series = {CHI '15},
year = {2015},
month = {Apr},
pages = {1201–1210},
doi = {https://doi.org/10.1145/2702123.2702398},
pdf = {papers/gem-ni.pdf},
video = {videos/GEM-NI.m4v},
teaser = {teasers/gem-ni.png},
abstract = {We present GEM-NI - a graph-based generative-design tool that supports parallel exploration of alternative designs. Producing alternatives is a key feature of creative work, yet it is not strongly supported in most extant tools. GEM-NI enables various forms of exploration with alternatives such as parallel editing, recalling history, branching, merging, comparing, and Cartesian products of and for alternatives. Further, GEM-NI provides a modal graphical user interface and a design gallery, which both allow designers to control and manage their design exploration. We conducted an exploratory user study followed by in-depth one-on-one interviews with moderately and highly skills participants and obtained positive feedback for the system features, showing that GEM-NI supports creative design work well.},
keywords = {alternatives, design},
}
@inproceedings{pfeiffer2015emsfeedback,
title = {{3D} Virtual Hand Pointing with {EMS} and Vibration Feedback},
author = {Pfeiffer*, Max and Stuerzlinger, Wolfgang},
booktitle = {Symposium on {3D} User Interfaces},
publisher = {IEEE},
series = {3DUI '15},
year = {2015},
month = {Mar},
pages = {117-120},
doi = {https://doi.org/10.1109/3DUI.2015.7131735},
pdf = {papers/EMSfeedback.pdf},
teaser = {teasers/EMSfeedback.png},
abstract = {Pointing is one of the most basic interaction methods for 3D user interfaces. Previous work has shown that visual feedback improves such actions. Here we investigate if electrical muscle stimulation (EMS) and vibration is beneficial for 3D virtual hand pointing. In our experiment we used a 3D version of a Fitts' task to compare visual feedback, EMS, vibration, with no feedback. The results demonstrate that both EMS and vibration provide reasonable addition to visual feedback. We also found good user acceptance for both technologies.},
keywords = {3D pointing, haptics},
}
@inproceedings{arif2014pseudopressure,
title = {The Use of Pseudo Pressure in Authenticating Smartphone Users},
author = {Arif*, Ahmed Sabbir and Ali, Mazalek and Stuerzlinger, Wolfgang},
booktitle = {11th International Conference on Mobile and Ubiquitous Systems: Computing, Networking and Services},
publisher = {ICST},
series = {MOBIQUITOUS '14},
year = {2014},
month = {Dec},
pages = {151–160},
doi = {https://doi.org/10.4108/icst.mobiquitous.2014.257919},
pdf = {papers/pressureauthentication.pdf},
teaser = {teasers/pressureauthentication.png},
abstract = {In this article, we present a new user authentication technique for touchscreen-based smartphone users that augments pseudo touch pressure as an extra security measure to the conventional digit-lock technique. The new technique enhances security by offering more unique password combinations than the most popular ones, by making each password specific to its owner, and by reducing the threat of smudge attacks. A study comparing the new technique with the digit-lock technique showed that overall it is slower and more error-prone, but performs substantially better in short term. Also, most users felt more secure using it and wanted to use it dominantly on their smartphones. A second study confirmed that it does enhance security by making it relatively more resistant to smudge attacks and less vulnerable to situations where attackers are already in possession of users' passwords.},
keywords = {authentication, password, mobile device},
}
@inproceedings{teather2014visualaids,
title = {Visual Aids in {3D} Point Selection Experiments},
author = {Teather*, Robert J. and Stuerzlinger, Wolfgang},
booktitle = {2nd Symposium on Spatial User Interaction},
publisher = {ACM},
series = {SUI '14},
year = {2014},
month = {Oct},
pages = {127–136},
doi = {https://doi.org/10.1145/2659766.2659770},
pdf = {papers/visualaidspointing.pdf},
video = {videos/3DvisualAids.mp4},
teaser = {teasers/visualaidspointing.png},
abstract = {We present a study investigating the influence of visual aids on 3D point selection tasks. In a Fitts' law pointing experiment, we compared the effects of texturing, highlighting targets upon being touched, and the presence of support cylinders intended to eliminate floating targets. Results of the study indicate that texturing and support cylinders did not significantly influence performance. Enabling target highlighting increased movement speed, while decreasing error rate. Pointing throughput was unaffected by this speed-accuracy tradeoff. Highlighting also eliminated significant differences between selection coordinate depth deviation and the deviation in the two orthogonal axes.},
keywords = {3D pointing, stereo},
}
@inproceedings{brown2014performance,
title = {The Performance of Un-Instrumented in-Air Pointing},
author = {Brown*, Michelle A. and Stuerzlinger, Wolfgang and de Mendonça Filho+, Euclides José},
booktitle = {Graphics Interface},
series = {GI '14},
year = {2014},
month = {May},
pages = {59–66},
url = {https://dl.acm.org/doi/10.5555/2619648.2619659},
footnote = {https://graphicsinterface.org/proceedings/gi2014/gi2014-8},
pdf = {papers/inairpointing.pdf},
teaser = {teasers/inairpointing.png},
abstract = {We present an analysis of in-air finger and hand controlled object pointing and selection. The study used a tracking system that required no instrumentation on the user. We compared the performance of the two pointing methods with and without elbow stabilization and found that the method that yielded the best performance varied for each participant, such that there was no method that performed significantly better than all others. We also directly compared user performance between un-instrumented in-air pointing and the mouse. We found that the un-instrumented in-air pointing performed significantly worse, at less than 75% of mouse throughput. Yet, the larger range of applications for un-instrumented 3D hand tracking makes this technology still an attractive option for user interfaces.},
keywords = {3D pointing, mid-air},
}
@inproceedings{arif2014adaptation,
title = {User Adaptation to a Faulty Unistroke-Based Text Entry Technique by Switching to an Alternative Gesture Set},
author = {Arif*, Ahmed Sabbir and Stuerzlinger, Wolfgang},
booktitle = {Graphics Interface},
series = {GI '14},
year = {2014},
month = {May},
pages = {183–192},
url = {https://dl.acm.org/doi/10.5555/2619648.2619679},
footnote = {https://graphicsinterface.org/proceedings/gi2014/gi2014-24},
pdf = {papers/faultygestures.pdf},
teaser = {teasers/faultygestures.png},
abstract = {This article presents results of two user studies to investigate user adaptation to a faulty unistroke gesture recognizer of a text entry technique. The intent was to verify the hypothesis that users gradually adapt to a faulty gesture recognition technique' s misrecognition errors and that this adaptation rate is dependent on how frequently they occur. Results confirmed that users gradually adapt to misrecognition errors by replacing the error prone gestures with alternative ones, as available. Also, users adapt to a particular misrecognition error faster if it occurs more frequently than others.},
keywords = {errors, gesture recognition, adaptation},
}
@inproceedings{latoschik2014evaluation,
title = {On the Art of the Evaluation and Presentation of RIS-Engineering},
author = {Latoschik, Marc Erich and Stuerzlinger, Wolfgang},
booktitle = {Software Engineering and Architectures for Realtime Interactive Systems},
publisher = {IEEE},
series = {SEARIS '14},
year = {2014},
month = {Mar},
pages = {9-17},
doi = {https://doi.org/10.1109/SEARIS.2014.7152796},
pdf = {papers/rispresent.pdf},
teaser = {teasers/rispresent.png},
abstract = {This article analyses the tasks of presenting and evaluating relevant scientific research in the field of Real-time Interactive Systems (RIS), i.e., in areas such as Virtual, Mixed, and Augmented Reality (VR, MR, and AR) and advanced Human-Computer Interaction. It identifies different methods for a structured approach to the description and evaluation of systems and their properties, including commonly found best practices as well as dos and don'ts. The article is targeted at authors as well as reviewers to guide both groups in the presentation as well as the appraisal of system engineering work.},
keywords = {systems, evaluation, virtual reality, augmented reality},
}
@inproceedings{arif2013pseudopressure,
title = {Pseudo-Pressure Detection and Its Use in Predictive Text Entry on Touchscreens},
author = {Arif*, Ahmed Sabbir and Stuerzlinger, Wolfgang},
booktitle = {Australian Computer-Human Interaction Conference: Augmentation, Application, Innovation, Collaboration},
series = {OzCHI '13},
year = {2013},
month = {Nov},
pages = {383-392},
doi = {https://doi.org/10.1145/2541016.2541024},
pdf = {papers/pseudopressure.pdf},
teaser = {teasers/pseudopressure.png},
abstract = {In this article we first present a new hybrid technique that combines existing time- and touch-point-based approaches to simulate pressure detection on standard touchscreens. Results of two user studies show that the new hybrid technique can distinguish (at least) two pressure levels, where the first requires on average 1.04 N and the second 3.24 N force on the surface. Then, we present a novel pressure-based predictive text entry technique that utilizes our hybrid pressure detection to enable users to bypass incorrect predictions by applying extra pressure on the next key. For inputting short English phrases with 10% non-dictionary words a comparison with conventional text entry in a study showed that the new technique increases entry speed by 9% and decreases error rates by 25%. Also, most users (83%) favour the new technique.},
keywords = {text entry, pressure, touch},
award = {This work received a Best Paper Award},
}
@inproceedings{arif2013evaluation,
title = {Evaluation of a New Error Prevention Technique for Mobile Touchscreen Text Entry},
author = {Arif*, Ahmed Sabbir and Stuerzlinger, Wolfgang},
booktitle = {Australian Computer-Human Interaction Conference: Augmentation, Application, Innovation, Collaboration},
series = {OzCHI '13},
year = {2013},
month = {Nov},
pages = {397-400},
doi = {https://doi.org/10.1145/2541016.2541063},
pdf = {papers/textpressure.pdf},
teaser = {teasers/textpressure.png},
abstract = {This paper presents a new pressure-based error prevention technique for mobile touchscreen text entry. Two user studies were conducted to compare the new technique with a conventional virtual keyboard, one with novice and another with expert users. Results of the first user study showed that with practice the new technique significantly improves accuracy. Yet, no such indication was observed during the second study.},
keywords = {text entry, errors, pressure, touch},
}
@inproceedings{lindlbauer2013perceptual,
title = {Perceptual Grouping: Selection Assistance for Digital Sketching},
author = {Lindlbauer*, David and Haller, Michael and Hancock, Mark and Scott, Stacey and Stuerzlinger, Wolfgang},
booktitle = {Conference on Interactive Tabletops and Surfaces},
publisher = {ACM},
series = {ITS '13},
year = {2013},
month = {Oct},
pages = {51-60},
doi = {https://doi.org/10.1145/2512349.2512801},
pdf = {papers/suggero.pdf},
video = {videos/Suggero.mp4},
teaser = {teasers/suggero.png},
abstract = {Modifying a digital sketch may require multiple selections before a particular editing tool can be applied. Especially on large interactive surfaces, such interactions can be fatiguing. Accordingly, we propose a method, called Suggero, to facilitate the selection process of digital ink. Suggero identifies groups of perceptually related drawing objects. These "perceptual groups" are used to suggest possible extensions in response to a person's initial selection. Two studies were conducted. First, a background study investigated participant's expectations of such a selection assistance tool. Then, an empirical study compared the effectiveness of Suggero with an existing manual technique. The results revealed that Suggero required fewer pen interactions and less pen movement, suggesting that Suggero minimizes fatigue during digital sketching.},
keywords = {group selection},
}
@inproceedings{zeidler2013ale,
title = {The Auckland Layout Editor: An Improved {GUI} Layout Specification Process},
author = {Zeidler*, Clemens and Lutteroth, Christof and Stuerzlinger, Wolfgang and Weber, Gerald},
booktitle = {26th Annual Symposium on User Interface Software and Technology},
publisher = {ACM},
series = {UIST '13},
year = {2013},
month = {Oct},
pages = {343-352},
doi = {https://doi.org/10.1145/2501988.2502007},
pdf = {papers/layoutALE.pdf},
video = {videos/ALE.mp4},
teaser = {teasers/layoutALE.png},
abstract = {Layout managers are used to control the placement of widgets in graphical user interfaces (GUIs). Constraint-based layout managers are among the most powerful. However, they are also more complex and their layouts are prone to problems such as over-constrained specifications and widget overlap. This poses challenges for GUI builder tools, which ideally should address these issues automatically. We present a new GUI builder - the Auckland Layout Editor (ALE) - that addresses these challenges by enabling GUI designers to specify constraint-based layouts using simple, mouse-based operations. We give a detailed description of ALE's edit operations, which do not require direct constraint editing. ALE guarantees that all edit operations lead to sound specifications, ensuring solvable and non-overlapping layouts. To achieve that, we present a new algorithm that automatically generates the constraints necessary to keep a layout non-overlapping. Furthermore, we discuss how our innovations can be combined with manual constraint editing in a sound way. Finally, to aid designers in creating layouts with good resize behavior, we propose a novel automatic layout preview. This displays the layout at its minimum and in an enlarged size, which allows visualizing potential resize issues directly. All these features permit GUI developers to focus more on the overall UI design.},
keywords = {GUI, layout, constraints, GUI builder},
}
@inproceedings{zabramski2013easy,
title = {Easy vs Tricky: The Shape Effect in Tracing, Selecting, and Steering With Mouse, Stylus, and Touch},
author = {Zabramski*, Stanislaw and Shrestha*, Suman and Stuerzlinger, Wolfgang},
booktitle = {International Conference on Making Sense of Converging Media},
series = {MindTrek '13},
year = {2013},
month = {Oct},
pages = {99-103},
doi = {https://doi.org/10.1145/2523429.2523444},
pdf = {papers/shapeeffect.pdf},
teaser = {teasers/shapeeffect.png},
abstract = {This short paper is a work-in-progress report on an experimental comparison and evaluation of users' performance in four line-tracing tasks based on two shapes and performed with three input methods (mouse, stylus, and touch-input). The shapes' properties used in the study created the two classes of shapes: easy and hard to replicate. As expected these two classes had different impact on user's performance in each task tested (tracing, lasso selection, steering through narrow and wide tunnel). The results show that participants replicating the shapes using touch-input were the least accurate but were the fastest in comparison to the remaining input methods. The stylus was the least error-prone method and the mouse was the slowest device in drawing tasks (tracing and selection). The differences in error distances between the input methods were less pronounced in steering tasks but timing data showed that mouse was still the slowest one. While the time of replication did not differ between the two shapes tested, the differences between the errors participants made were significant for all tasks and input devices, and patterns of these differences were consistent between the shapes. These results confirm predictions from a previous study and show which shapes' properties can make their replication more difficult. The results can be used to design shapes that are easy to replicate, e.g., in surface-based gestural interaction.},
keywords = {steering, tracing, drawing},
}
@inproceedings{agarwal2013widgetlens,
title = {{WidgetLens}: A System for Adaptive Content Magnification of Widgets},
author = {Agarwal*, Bhavna and Stuerzlinger, Wolfgang},
booktitle = {27th International BCS Human Computer Interaction Conference},
series = {BCS-HCI '13},
year = {2013},
month = {Sep},
articleno = {2},
numpages = {10},
doi = {https://doi.org/10.14236/ewic/HCI2013.4},
pdf = {papers/widgetlens.pdf},
video = {videos/WidgetLensOLD.mp4},
teaser = {teasers/widgetlens.png},
abstract = {On displays with high pixel densities or on mobile devices and due to limitations in current graphical user interface toolkits, content can appear (too) small and be hard to interact with. We present WidgetLens, a novel adaptive widget magnification system, which improves access to and interaction with graphical user interfaces. It is designed for usage of unmodified applications on screens with high pixel densities, remote desktop scenarios, and may also address some situations with visual impairments. It includes a comprehensive set of adaptive magnification lenses for standard widgets, each adjusted to the properties of that type of widget. These lenses enable full interaction with content that appears too small. We also present several extensions.},
keywords = {GUI, widget, magnification, layout},
}
@inproceedings{zabramski2013didwemiss,
title = {Did We Miss Something? Correspondence Analysis of Usability Data},
author = {Zabramski*, Stanislaw and Stuerzlinger, Wolfgang},
booktitle = {Human-Computer Interaction},
publisher = {Springer},
series = {INTERACT '13},
year = {2013},
month = {Sep},
volume = {LNCS 8120},
pages = {272-279},
doi = {https://doi.org/10.1007/978-3-642-40498-6_20},
pdf = {papers/correspondenceanalysisshort.pdf},
teaser = {teasers/correspondenceanalysisshort.png},
abstract = {We have applied a multivariate exploratory technique called Correspondence Analysis (CA) to create and analyze a model of the dataset of experiment results. The dataset originates from a comparative usability study of tracing with the use of mouse, pen, and touch input and contains both categorical and continuous data – i.e. results of questionnaires and task measurements. CA allowed to visually and numerically assess the main variables in the dataset and how they interact with each other. In our study, pen input had the best measured performance and was preferred by the users. Touch input was the least accurate of all input methods tested but it was preferred by users over mouse especially in the conditions lacking of visual feedback of drawing. CA helped to detect that secondary effect even though it cannot be explained by the performance results alone. The importance of the influence of user's previous experience is also noted. We conclude that CA helped to identify all major phenomena known from previous studies but also was sensitive to minor and secondary effects, what makes it a well suited method to quickly evaluate usability data.},
keywords = {steering, drawing, steering},
}
@inproceedings{zeidler2013evaluating,
title = {Evaluating Direct Manipulation Operations for Constraint-based Layout},
author = {Zeidler*, Clemens and Lutteroth, Christof and Stuerzlinger, Wolfgang and Weber, Gerald},
booktitle = {Human-Computer Interaction},
publisher = {Springer},
series = {INTERACT '13},
year = {2013},
month = {Sep},
volume = {LNCS 8118},
pages = {513-529},
doi = {https://doi.org/10.1007/978-3-642-40480-1_35},
pdf = {papers/layoutALEstudy.pdf},
teaser = {teasers/layoutALEstudy.png},
abstract = {Layout managers are used to control the placement of widgets in graphical user interfaces (GUIs). Constraint-based layout managers are more powerful than other ones. However, they are also more complex and their layouts are prone to problems that usually require direct editing of constraints. Today, designers commonly use GUI builders to specify GUIs. The complexities of traditional approaches to constraint-based layouts pose challenges for GUI builders.We evaluate a novel GUI builder, the Auckland Layout Editor (ALE), which addresses these challenges by enabling GUI designers to specify constraint-based layouts via direct manipulation using simple, mouse-based operations. These operations hide the complexity of the constraint-based layout model, while giving designers access to its benefits.In a user evaluation we compared ALE with two other mainstream layout builders, a grid-based and a constraint-based one. The time taken to create realistic sample layouts with our builder was significantly shorter, and most participants preferred ALE's approach. The evaluation demonstrates that good usability for authoring constraint-based layouts is possible.},
keywords = {GUI, layout, constraints},
}
@inproceedings{bruder2013touching,
title = {Touching the Void Revisited: Analyses of Touch Behavior On and Above Tabletop Surfaces},
author = {Bruder*, Gerd and Steinicke, Frank and Stuerzlinger, Wolfgang},
booktitle = {Human-Computer Interaction},
publisher = {Springer},
series = {INTERACT '13},
year = {2013},
month = {Sep},
volume = {LNCS 8117},
pages = {278-296},
doi = {https://doi.org/10.1007/978-3-642-40483-2_19},
pdf = {papers/stereotouchobserv.pdf},
teaser = {teasers/stereotouchobserv.png},
abstract = {Recent developments in touch and display technologies made it possible to integrate touch-sensitive surfaces into stereoscopic three-dimensional (3D) displays. Although this combination provides a compelling user experience, interaction with stereoscopically displayed objects poses some fundamental challenges. If a user aims to select a 3D object, each eye sees a different perspective of the same scene. This results in two distinct projections on the display surface, which raises the question where users would touch in 3D or on the two-dimensional (2D) surface to indicate the selection. In this paper we analyze the relation between the 3D positions of stereoscopically displayed objects and the on- as well as off-surface touch areas. The results show that 2D touch interaction works better close to the screen but also that 3D interaction is more suitable beyond 10cm from the screen. Finally, we discuss implications for the development of future touch-sensitive interfaces with stereoscopic display.},
keywords = {3D pointing, mid-air, touch},
}
@inproceedings{scheurich2013onehanded,
title = {A One-Handed Multi-Touch Method for {3D} Rotations},
author = {Scheurich*, Doug and Stuerzlinger, Wolfgang},
booktitle = {Human-Computer Interaction},
publisher = {Springer},
series = {INTERACT '13},
year = {2013},
month = {Sep},
volume = {LNCS 8117},
pages = {56-69},
doi = {https://doi.org/10.1007/978-3-642-40483-2_4},
pdf = {papers/touchrot.pdf},
video = {videos/touchRot.mp4},
teaser = {teasers/touchrot.png},
abstract = {Rotating 3D objects is a difficult task. We present a new rotation technique based on collision-free "mating" to expedite 3D rotations. It is specifically designed for one-handed interaction on tablets or touchscreens. A user study found that our new technique decreased the time to rotate objects in 3D by more than 60% in situations where objects align. We found similar results when users translated and rotated objects in a 3D scene. Also, angle errors were 35% less with mating. In essence, our new rotation technique improves both the speed and accuracy of common 3D rotation tasks.},
keywords = {3D manipulation, touch},
}
@inproceedings{das2013unified,
title = {Unified Modeling of Proactive Interference and Memorization Effort: A New Mathematical Perspective Within {ACT-R} Theory},
author = {Das*, Arindam and Stuerzlinger, Wolfgang},
booktitle = {Annual Meeting of the Cognitive Science Society},
series = {CogSci '13},
isbn = {978-097683189-1},
year = {2013},
month = {Jul},
pages = {358-363},
url = {https://escholarship.org/uc/item/1p05s7db},
pdf = {papers/proactivememorymodel.pdf},
teaser = {teasers/proactivememorymodel.png},
abstract = {We parsimoniously model the effect of proactive interference and memorization effort in learning stable graphical layouts. We model the visual search cost, i.e. the number of distractors visually encoded while looking for a target item, as a reasonable surrogate of onscreen proactive interference. Further, we show that a novel quantity that we term "effort factor" is an acceptable estimate for comparing the memorization effort across different access cost of onscreen information during the early stages of practice.},
keywords = {text entry, learning},
}
@inproceedings{zabramski2013activity,
title = {Activity or Product? - Drawing and {HCI}},
author = {Zabramski*, Stanislaw and Stuerzlinger, Wolfgang},
booktitle = {International Conference on Multimedia, Interaction, Design and Innovation},
series = {MIDI '13},
year = {2013},
month = {Jun},
pages = {29-38},
doi = {https://doi.org/10.1145/2500342.2500346},
pdf = {papers/drawingactivity.pdf},
teaser = {teasers/drawingactivity.png},
abstract = {Drawing tasks are rarely addressed experimentally by the HCI community, and even then pointing, steering, or gesturing is promoted as an approach towards drawing. We critically analyze the status quo, propose an improved framework for task analysis, and give suggestions on how to perceive drawing task at a meta-level.},
keywords = {drawing, steering},
}
@comment{c, c={leave the "_stuerzlinger" in the ID to enable umlaut-free search!}}
@inproceedings{bruder_stuerzlinger2013totouch,
title = {To Touch or not to Touch? Comparing {2D} Touch and {3D} Mid-Air Interaction on Stereoscopic Tabletop Surfaces},
author = {Bruder*, Gerd and Steinicke, Frank and Stürzlinger, Wolfgang},
booktitle = {Symposium on Spatial User Interaction},
publisher = {ACM},
series = {SUI '13},
year = {2013},
month = {Jul},
pages = {9-16},
doi = {https://doi.org/10.1145/2491367.2491369},
pdf = {papers/2D3Dtouch.pdf},
video = {videos/stereoTouch.mp4},
teaser = {teasers/2D3Dtouch.png},
abstract = {Recent developments in touch and display technologies have laid the groundwork to combine touch-sensitive display systems with stereoscopic three-dimensional (3D) display. Although this combination provides a compelling user experience, interaction with objects stereoscopically displayed in front of the screen poses some fundamental challenges: Traditionally, touch-sensitive surfaces capture only direct contacts such that the user has to penetrate the visually perceived object to touch the 2D surface behind the object. Conversely, recent technologies support capturing finger positions in front of the display, enabling users to interact with intangible objects in mid-air 3D space. In this paper we perform a comparison between such 2D touch and 3D mid-air interactions in a Fitts' Law experiment for objects with varying stereoscopical parallax. The results show that the 2D touch technique is more efficient close to the screen, whereas for targets further away from the screen, 3D selection outperforms 2D touch. Based on the results, we present implications for the design and development of future touch-sensitive interfaces for stereoscopic displays.},
keywords = {3D pointing, touch, mid-air},
}
@inproceedings{teather2013pointing,
title = {Pointing at {3D} Target Projections with One-Eyed and Stereo Cursors},
author = {Teather*, Robert J. and Stuerzlinger, Wolfgang},
booktitle = {{SIGCHI} Conference on Human Factors in Computing Systems},
publisher = {ACM},
series = {CHI '13},
year = {2013},
month = {Apr},
pages = {159-168},
doi = {https://doi.org/10.1145/2470654.2470677},
pdf = {papers/stereocursor.pdf},
video = {videos/3DoneEyedCursor.mp4},
teaser = {teasers/stereocursor.png},
abstract = {We present a study of cursors for selecting 2D-projected 3D targets. We compared a stereo- and mono-rendered (one-eyed) cursor using two mouse-based and two remote pointing techniques in a 3D Fitts' law pointing experiment. The first experiment used targets at fixed depths. Results indicate that one-eyed cursors only improve screen-plane pointing techniques, and that constant target depth does not influence pointing throughput. A second experiment included pointing between targets at varying depths and used only "screen-plane" pointing techniques. Our results suggest that in the absence of stereo cue conflicts, screen-space projections of Fitts' law parameters (target size and distance) yield constant throughput despite target depth differences and produce better models of performance.},
keywords = {3D pointing, stereo},
}
@inproceedings{bruder2013effects,
title = {Effects of Visual Conflicts on {3D} Selection Task Performance in Stereoscopic Display Environments},
author = {Bruder*, Gerd and Steinicke, Frank and Stuerzlinger, Wolfgang},
booktitle = {Symposium on {3D} User Interfaces},
publisher = {IEEE},
series = {3DUI '13},
year = {2013},
month = {Mar},
pages = {115-118},
doi = {https://doi.org/10.1109/3DUI.2013.6550207},
pdf = {papers/offsettouch.pdf},
teaser = {teasers/offsettouch.png},
abstract = {Mid-air direct-touch interaction in stereoscopic display environments poses challenges to the design of 3D user interfaces. Not only is passive haptic feedback usually absent when selecting a virtual object displayed with positive or negative parallax relative to a display surface, but such setups also suffer from inherent visual conflicts, such as vergence/accommodation mismatches and double vision. In particular, if the user tries to select a virtual object with a finger or input device, either the virtual object or the user's finger will appear blurred, resulting in an ambiguity for selections that may significantly impact the user's performance. In this paper we evaluate the effect of visual conflicts for mid-air 3D selection performance within arm's reach on a stereoscopic table with a Fitts' Law experiment. We compare three different techniques with different levels of visual conflicts for selecting a virtual object: real hand, virtual offset cursor, and virtual offset hand. Our results show that the error rate is highest for the real hand condition and less for the virtual offset-based techniques. However, our results indicate that selections with the real hand resulted in the highest effective throughput of all conditions. This suggests that virtual offset-based techniques do not improve overall performance.},
keywords = {3D pointing, stereo},
}
@inproceedings{zabramski2012effect,
title = {The Effect of Shape Properties on Ad-hoc Shape Replication with Mouse, Pen, and Touch Input},
author = {Zabramski*, Stanislaw and Stuerzlinger, Wolfgang},
booktitle = {Proceeding of the 16th International Academic {MindTrek} Conference},
series = {MindTrek '12},
year = {2012},
month = {Oct},
pages = {275-278},
doi = {https://doi.org/10.1145/2393132.2393192},
pdf = {papers/shapereplication.pdf},
teaser = {teasers/shapereplication.png},
abstract = {This paper summarizes observations from four empirical studies focusing on shape replication with three input methods. The aim was to identify and assess how the components of several semi-randomly generated shapes influence how accurately untrained users can replicate each of these components. We found that the pen is the least and touch the most error-prone method when used for drawing. Additionally, the distribution of errors was analyzed. The results may be used to predict which shape properties make shape replication more difficult. Additionally, the results may be used to design shapes that are easy to replicate.},
keywords = {steering, drawing},
}
@inproceedings{liang20123dmanipulation,
title = {User-defined Surface+Motion Gestures for {3D} Manipulation of Objects at a Distance Through a Mobile Device},
author = {Liang, Hai-Ning and Williams*, Cary and Semegen, Myron and Stuerzlinger, Wolfgang and Irani, Pourang},
booktitle = {10th Asia Pacific Conference on Computer Human Unteraction},
series = {APCHI '12},
year = {2012},
month = {Aug},
pages = {299-308},
doi = {https://doi.org/10.1145/2350046.2350098},
pdf = {papers/dualsurface.pdf},
teaser = {teasers/dualsurface.png},
abstract = {One form of input for interacting with large shared surfaces is through mobile devices. These personal devices provide interactive displays as well as numerous sensors to effectuate gestures for input. We examine the possibility of using surface and motion gestures on mobile devices for interacting with 3D objects on large surfaces. If effective use of such devices is possible over large displays, then users can collaborate and carry out complex 3D manipulation tasks, which are not trivial to do. In an attempt to generate design guidelines for this type of interaction, we conducted a guessability study with a dual-surface concept device, which provides users access to information through both its front and back. We elicited a set of end-user surface- and motion-based gestures. Based on our results, we demonstrate reasonably good agreement between gestures for choice of sensory (i.e. tilt), multi-touch and dual-surface input. In this paper we report the results of the guessability study and the design of the gesture-based interface for 3D manipulation.},
keywords = {3D manipulation, touch},
}
@inproceedings{arif2011extending,
title = {Extending Mobile User Ambient Awareness for Nomadic Text Entry},
author = {Arif*, Ahmed Sabbir and Iltisberger+, Benedikt and Stuerzlinger, Wolfgang},
booktitle = {Australian Computer-Human Interaction Conference},
series = {OzCHI '11},
year = {2011},
month = {Nov},
pages = {21-30},
doi = {https://doi.org/10.1145/2071536.2071539},
pdf = {papers/nomadictextentry.pdf},
teaser = {teasers/nomadictextentry.png},
abstract = {Nowadays, we input text not only on stationary devices, but also on handheld devices while walking, driving, or commuting. Text entry on the move, which we term as nomadic text entry, is generally slower. This is partially due to the need for users to move their visual focus from the device to their surroundings for navigational purposes and back. To investigate if better feedback about users' surroundings on the device can improve performance, we present a number of new and existing feedback systems: textual, visual, textual & visual, and textual & visual via translucent keyboard. Experimental comparisons between the conventional and these techniques established that increased ambient awareness for mobile users enhances nomadic text entry performance. Results showed that the textual and the textual & visual via translucent keyboard conditions increased text entry speed by 14% and 11%, respectively, and reduced the error rate by 13% compared to the regular technique. The two methods also significantly reduced the number of collisions with obstacles.},
keywords = {text entry, mobile device, awareness},
}
@inproceedings{patel2011simulation,
title = {Simulation of a Virtual Reality Tracking System},
author = {Patel+, Kapil and Stuerzlinger, Wolfgang},
booktitle = {International Conference on Virtual Environments, Human-Computer Interfaces and Measurement Systems Proceedings},
publisher = {IEEE},
series = {VECIMS '11},
year = {2011},
month = {Sep},
pages = {78-83},
doi = {https://doi.org/10.1109/VECIMS.2011.6053849},
pdf = {papers/hedgesim.pdf},
teaser = {teasers/hedgesim.png},
abstract = {Virtual reality tracking systems are used to detect the position and orientation of a user inside spatially immersive systems. In this paper, we simulate a laser-based tracking system that was originally developed for a six-sided spatially immersive system in environments with one and five walls to evaluate its performance for other installations. As expected, the results show that performance degrades with the number of walls, but they also show that tracking with even one wall is still very feasible.},
keywords = {3D tracking, simulation, virtual reality},
}
@inproceedings{zhao2011comparison,
title = {Comparison of Multiple {3D} Rotation Methods},
author = {Zhao*, Yao Jun and Shuralyov*, Dmitri and Stuerzlinger, Wolfgang},
booktitle = {International Conference on Virtual Environments, Human-Computer Interfaces and Measurement Systems Proceedings},
publisher = {IEEE},
series = {VECIMS '11},
year = {2011},
month = {Sep},
pages = {13-17},
doi = {https://doi.org/10.1109/VECIMS.2011.6053855},
pdf = {papers/comparerotation.pdf},
teaser = {teasers/comparerotation.png},
abstract = {In this paper, we present an experimental comparison of 3D rotation techniques. In all techniques, the third degree of freedom is controlled by the mouse-wheel. The investigated techniques are Bell's Trackball, Shoemake's Arcball and the Two-axis Valuator method. The result from a pilot showed no performance or accuracy difference among these three. However, we did observe minor differences in an experiment with more participants and trials, though these differences were not significant. Also, from questionnaires, we found that most of the users considered the use of mouse wheel helpful for completing the tasks.},
keywords = {3D manipulation},
}
@inproceedings{mcclymont2011comparison,
title = {Comparison of {3D} Navigation Interfaces},
author = {{McClymont}*, Joshua and Shuralyov*, Dmitri and Stuerzlinger, Wolfgang},
booktitle = {International Conference on Virtual Environments, Human-Computer Interfaces and Measurement Systems Proceedings},
publisher = {IEEE},
series = {VECIMS '11},
year = {2011},
month = {Sep},
pages = {7-12},
doi = {https://doi.org/10.1109/VECIMS.2011.6053842},
pdf = {papers/comparenavigation.pdf},
teaser = {teasers/comparenavigation.png},
abstract = {This paper evaluates two different interfaces for navigation in a 3D environment. The first is a `Click-to-Move' style interface that involves using a mouse. The second is a gaming style interface that uses both mouse and keyboard (i.e. the `WASD' keys) for view direction and movement respectively. In the user study, participants were asked to navigate a supermarket environment and collect a specific subset of items. Results revealed significant differences only for some of the sub-measures. Yet, some revealing observations were made regarding user behavior and interaction with the user interface.},
keywords = {3D navigation},
}
@inproceedings{dadgari2011merging,
title = {New Techniques for Merging Text Versions},
author = {Dadgari*, Darius and Stuerzlinger, Wolfgang},
booktitle = {Human-Computer Interaction, Interaction Techniques and Environments},
publisher = {Springer},
series = {HCI International '11},
year = {2011},
month = {Jul},
volume = {LNCS 6762},
pages = {331-340},
doi = {https://doi.org/10.1007/978-3-642-21605-3_37},
pdf = {papers/version4text.pdf},
teaser = {teasers/version4text.png},
abstract = {Versioning helps users to keep track of different sets of edits on a document. Version merging methods enable users to determine which parts of which version they wish to include in the next or final version. We explored several existing and two new methods (highlighting and overlay) in single and multiple window settings. We present the results of our quantitative user studies, which show that the new highlighting and overlay techniques are preferred for version merging tasks. The results suggest that the most useful methods are those which clearly and easily present information that is likely important to the user, while simultaneously hiding less important information. Also, multi window version merging is preferred over single window merging.},
keywords = {difference visualization, merging},
}
@inproceedings{zaman2011effect,
title = {The Effect of Animation Dual-View, Difference Layers and Relative Re-Layout in Hierarchical Diagram Differencing},
author = {Zaman*, Loutfouz and Kalra+, Ashish and Stuerzlinger, Wolfgang},
booktitle = {Graphics Interface},
series = {GI '11},
year = {2011},
month = {May},
pages = {183-190},
url = {https://graphicsinterface.org/proceedings/gi2011/gi2011-24},
pdf = {papers/versiondiff4diagrams.pdf},
teaser = {teasers/versiondiff4diagrams.png},
abstract = {We present a new system for visualizing and merging differences in diagrams that uses animation, dual views, a storyboard, relative re-layout, and layering. We ran two user studies investigating the benefits of the system. The first user study compared pairs of hierarchical diagrams with matching node positions. The results underscore that naïve dual-view visualization is undesirable. On the positive side, participants particularly liked the dual-view with difference layer technique. The second user study focused on diagrams with partially varying node positions and difference visualization and animation. We found evidence that both techniques are beneficial, and that the combination was preferred.},
keywords = {difference visualization, diagram},
}
@inproceedings{ashtiani20112d,
title = {{2D} Similarity Transformations on Multi-Touch Surfaces},
author = {Ashtiani*, Behrooz and Stuerzlinger, Wolfgang},
booktitle = {Graphics Interface},
series = {GI '11},
year = {2011},
month = {May},
pages = {57-64},
url = {https://graphicsinterface.org/proceedings/gi2011/gi2011-8},
pdf = {papers/xnt2d.pdf},
video = {videos/XNT.mp4},
teaser = {teasers/xnt2d.png},
abstract = {We present and comparatively evaluate two new object transformation techniques for multi-touch surfaces. Specifying complete two-dimensional similarity transformations requires a minimum of four degrees of freedom: two for position, one for rotation, and another for scaling. Many existing techniques for object transformation are designed to function with traditional input devices such as mice, single-touch surfaces, or stylus pens. The challenge is to map controls appropriately for each of these devices. A few multi-touch techniques have been proposed in the past, but no comprehensive evaluation has been presented.
XNT is a new three-finger object transformation technique, designed for multi-touch surfaces. It provides a natural interface for two-dimensional manipulation. XNT and several existing techniques were evaluated in a user study. The results show that XNT is superior for all tasks that involve scaling and competitive for tasks that involve only rotation and positioning.},
keywords = {touch, manipulation},
}
@inproceedings{pavlovych2011target,
title = {Target Following Performance in the Presence of Latency, Jitter, and Signal Dropouts},
author = {Pavlovych*, Andriy and Stuerzlinger, Wolfgang},
booktitle = {Graphics Interface},
series = {GI '11},
year = {2011},
month = {May},
pages = {33-40},
url = {https://graphicsinterface.org/proceedings/gi2011/gi2011-5},
pdf = {papers/trackingperformance.pdf},
teaser = {teasers/trackingperformance.png},
abstract = {In this paper we describe how human target following performance changes in the presence of latency, latency variations, and signal dropouts. Many modern games and game systems allow for networked, remote participation. In such networks latency, variations and dropouts are commonly encountered factors.
Our user study reveals that all of the investigated factors decrease tracking performance. The errors increase very quickly for latencies of over 110 ms, for latency jitters above 40 ms, and for dropout rates of more than 10 %. The effects of target velocity on errors are close to linear, and transverse errors are smaller than longitudinal ones. The results can be used to better quantify the effects of different factors on moving objects in interactive scenarios. They also aid the designers in selecting target sizes and velocities, as well as in adjusting smoothing, prediction and compensation algorithms.},
keywords = {target following, jitter},
}
@inproceedings{teather2011pointing,
title = {Pointing at {3D} Targets in a Stereo Head-Tracked Virtual Environment},
author = {Teather*, Robert J. and Stuerzlinger, Wolfgang},
booktitle = {Symposium on {3D} User Interfaces},
publisher = {IEEE},
series = {3DUI '11},
year = {2011},
month = {Mar},
pages = {87-94},
doi = {https://doi.org/10.1109/3DUI.2011.5759222},
pdf = {papers/fishtankfitts.pdf},
teaser = {teasers/fishtankfitts.png},
abstract = {We present three experiments that systematically examine pointing tasks in fish tank VR using the ISO 9241-9 standard. All experiments used a tracked stylus for a both direct touch and ray-based technique. Mouse-based techniques were also studied. Our goal was to investigate means of comparing 2D and 3D pointing techniques. The first experiment used a 2D task constrained to the display surface, allowing direct validation against other 2D studies. The second experiment used targets stereoscopically presented above and parallel to the display, i.e., the same task, but without tactile feedback afforded by the screen. The third experiment used targets varying in all three dimensions. Results of these studies suggest that the conventional 2D formulation of Fitts' law works well for planar pointing tasks even without tactile feedback, and with stereo display. Fully 3D motions using the ray and mouse based techniques are less well modeled.},
keywords = {3D pointing},
}
@inproceedings{dehmeshki2010designeval,
title = {Design and Evaluation of a Perceptual-based Object Group Selection Technique},
author = {Dehmeshki*, Hoda and Stuerzlinger, Wolfgang},
booktitle = {24th BCS Interaction Specialist Group Conference},
series = {BCS-HCI '10},
year = {2010},
month = {Sep},
pages = {365-372},
doi = {https://doi.org/10.14236/ewic/HCI2010.43},
pdf = {papers/persel.pdf},
video = {videos/PerSel.mp4},
teaser = {teasers/persel.png},
abstract = {Selecting groups of objects is a frequent task in graphical user interfaces since it precedes all manipulation operations. Current selection techniques such as lasso become time-consuming and error-prone in dense configurations or when the area covered by targets is large or hard to reach. Perceptual-based selection techniques can considerably improve the selection task when the targets have a perceptual structure, driven by Gestalt principles of proximity and good continuity. However, current techniques use ad hoc grouping algorithms that often lack evidence from perception science. Moreover, they do not allow selecting arbitrary groups (i.e. without a perceptual structure) or modifying a selection. This paper presents a domain-independent perceptual-based selection technique that addresses these issues. It is built upon an established group detection model from perception research and provides intuitive interaction techniques for selecting (whole or partial) groups with curvi-linear or random structures. Our user study shows that this technique not only outperforms rectangle selection and lasso techniques when targets have perceptual structure, but also it is competitive when targets have arbitrary arrangements.},
keywords = {group selection},
}
@inproceedings{dadgari2010novel,
title = {Novel User Interfaces for Diagram Versioning and Differencing},
author = {Dadgari*, Darius and Stuerzlinger, Wolfgang},
booktitle = {24th BCS Interaction Specialist Group Conference},
series = {BCS-HCI '10},
year = {2010},
month = {Sep},
pages = {62-71},
doi = {https://doi.org/10.14236/ewic/HCI2010.10},
pdf = {papers/version4diagram.pdf},
teaser = {teasers/version4diagram.png},
abstract = {Easily available software for diagram creation does not support the comparison of different versions and the merging of such versions. We present new methods and techniques for easy versioning of general two-dimensional diagrams. Multiple novel versioning methods for diagram versioning are compared to each other as well as to previous work in a user study. Participants in a user study preferred the Translucency View and Master Diagram Scenario to the other investigated methods and scenarios.},
keywords = {difference visualization, diagram},
}
@inproceedings{das2010proactive,
title = {Proactive Interference in Location Learning: A New Closed-Form Approximation},
author = {Das*, Arindam and Stuerzlinger, Wolfgang},
booktitle = {International Conference on Cognitive Modeling},
publisher = {Drexel University},
series = {ICCM '10},
year = {2010},
month = {Aug},
pages = {37-42},
url = {https://iccm-conference.neocities.org/2010/proceedings},
pdf = {papers/proactiveinter.pdf},
teaser = {teasers/proactiveinter.png},
abstract = {The ACT-R cognitive theory models forgetting in general with a constant "decay due to passage of time" parameter. However, this is not sufficient to predict learning for frequently executed tasks in dense arrangements of items. Prominent examples are two-dimensional location learning in finding keys on a keyboard or clicking on items on a web page or in a graphical user interface. Our work presents a new way to theoretically model the effect of Proactive Interference, i.e. the effect of the history of events on location learning, through an extension to ACT-R's mathematical model of declarative memory strength. It predicts that each time an item is searched for and found, the item gets "stronger", i.e. easier to remember. However, this strength diminishes not only through the passage of time, but also due to interference from other (non-target) items that have been encountered in the past. We tested the predictions of our new model against empirical measurements from two previous studies that involve simple visual search and selection. The predictions fit the experimental data very well.},
keywords = {learning, text entry},
}
@inproceedings{zaman2010cloning,
title = {A New Interface for Cloning Objects in Drawing Systems},
author = {Zaman*, Loutfouz and Stuerzlinger, Wolfgang},
booktitle = {Graphics Interface},
series = {GI '10},
year = {2010},
month = {May},
pages = {27-34},
url = {https://graphicsinterface.org/proceedings/gi2010/gi2010-5},
pdf = {papers/cloning.pdf},
teaser = {teasers/cloning.png},
abstract = {Cloning objects is a common operation in graphical user interfaces. One example is calendar systems, where users commonly create and modify recurring events, i.e. repeated clones of a single event. Inspired by the calendar paradigm, we introduce a new cloning technique for 2D drawing programs. This technique allows users to clone objects by first selecting them and then dragging them to create clones along the dragged path. Moreover, it allows editing the generated sequences of clones similar to the editing of calendar events. Novel approaches for the generation of clones of clones are also presented.
We compared our new clone creation technique with generic duplication via copy-and-paste, smart duplication, and a dialog driven technique on a standard desktop system. The results show that the new cloning method is always faster than dialogs and smart duplication for most conditions. We also compared our clone editing method against rectangular selection. The results show that our method is better in general. In situations where rectangle selection is effective, our method is still competitive. Participants preferred the new techniques overall, too.},
keywords = {drawing, cloning, copy, paste},
}
@inproceedings{arif2010predicting,
title = {Predicting the Cost of Error Correction in Character-Based Text Entry Technologies},
author = {Arif*, Ahmed Sabbir and Stuerzlinger, Wolfgang},
booktitle = {{SIGCHI} Conference on Human Factors in Computing Systems},
publisher = {ACM},
series = {CHI '10},
year = {2010},
month = {Apr},
pages = {5-14},
doi = {https://doi.org/10.1145/1753326.1753329},
pdf = {papers/errorcostmodel.pdf},
teaser = {teasers/errorcostmodel.png},
abstract = {Researchers have developed many models to predict and understand human performance in text entry. Most of the models are specific to a technology or fail to account for human factors and variations in system parameters, and the relationship between them. Moreover, the process of fixing errors and its effects on text entry performance has not been studied. Here, we first analyze real-life text entry error correction behaviors. We then use our findings to develop a new model to predict the cost of error correction for character-based text entry technologies. We validate our model against quantities derived from the literature, as well as with a user study. Our study shows that the predicted and observed cost of error correction correspond well. At the end, we discuss potential applications of our new model.},
keywords = {text entry, errors},
}
@inproceedings{phillips2009friction,
title = {Can Friction Improve Mouse-Based Text Selection?},
author = {Phillips*, Dustin and Stuerzlinger, Wolfgang},
booktitle = {International Conference Science and Technology for Humanity},
publisher = {IEEE},
series = {TIC-STH '09},
year = {2009},
month = {Sep},
pages = {89-94},
doi = {https://doi.org/10.1109/TIC-STH.2009.5444369},
pdf = {papers/frictionselect.pdf},
teaser = {teasers/frictionselect.png},
abstract = {Text selection via caret positioning is a common task in modern word processing interfaces. It is a difficult task as target size - the distance between characters - is very small. We adapt Baudisch's snap-and-go technique for target acquisition to insert additional motor space at such targets when the mouse is decelerating. This increases the size of the target in motor space, thus potentially reducing the difficulty of text selection tasks. We expand this idea by introducing the concept of context-sensitive friction to improve target acquisition for common targets. We performed two pilot studies and a controlled user study to evaluate the new techniques. Our results indicate that selectively introducing friction into the interface can reduce total task time in common text selection tasks.},
keywords = {selection, snapping, mouse},
}
@inproceedings{arif2009analysis,
title = {Analysis of Text Entry Performance Metrics},
author = {Arif*, Ahmed Sabbir and Stuerzlinger, Wolfgang},
booktitle = {International Conference Science and Technology for Humanity},
publisher = {IEEE},
series = {TIC-STH '09},
year = {2009},
month = {Sep},
pages = {100-105},
doi = {https://doi.org/10.1109/TIC-STH.2009.5444533},
pdf = {papers/textperfmetrics.pdf},
teaser = {teasers/textperfmetrics.png},
abstract = {Researchers have proposed many text entry systems to enable users to perform this frequent task as quickly and precise as possible. Unfortunately the reported data varies widely and it is difficult to extract meaningful average entry speeds and error rates from this body of work. In this article we collect data from well-designed and well-reported experiments for the most important text entry methods, including those for handheld devices. Our survey results show that thumb keyboard is the fastest text entry method after the standard QWERTY keyboard, and that Twiddler is fastest amongst non-QWERTY methods. Moreover, we survey how text entry errors were handled in these studies. Finally, we conducted a user study to detect which effect different error-handling methodologies have on text entry performance metrics. Our study results show that the way human errors are handled has indeed a significant effect on all frequently used error metrics.},
keywords = {text entry, errors},
}
@inproceedings{teather2009evaluating,
title = {Evaluating Visual/Motor Co-location in Fish-Tank Virtual Reality},
author = {Teather*, Robert J. and Allison, Robert and Stuerzlinger, Wolfgang},
booktitle = {International Conference Science and Technology for Humanity},
publisher = {IEEE},
series = {TIC-STH '09},
year = {2009},
month = {Sep},
pages = {624-629},
doi = {https://doi.org/10.1109/TIC-STH.2009.5444423},
pdf = {papers/colocateddisjoint.pdf},
teaser = {teasers/colocateddisjoint.png},
abstract = {Virtual reality systems often co-locate the display and input (motor) spaces. Many input devices, such as the mouse, use indirect input mappings, and are disjoint from the display space. A study of visual/motor co-location was conducted to determine if there is any benefit to working directly "in" a virtual environment. Using a fish-tank VR setup, participants performed a 3D object movement task. This required moving an object from the centre of the environment to target regions, using a tracked pen, in both co-located and disjoint display/input conditions. Results were analyzed in the context of Fitts' Law, which models rapid aimed movements. Ultimately, no significant differences were found between co-located and disjoint conditions. However, when analyzing object movement in specific directions, the co-located condition was somewhat better than the disjoint one. In particular, movement into the scene was faster when the display and input device were co-located rather than disjoint.},
keywords = {3D pointing},
}
@inproceedings{dehmeshki2009icelasso,
title = {ICE-Lasso: An Enhanced Form Of Lasso Selection},
author = {Dehmeshki*, Hoda and Stuerzlinger, Wolfgang},
booktitle = {International Conference Science and Technology for Humanity},
publisher = {IEEE},
series = {TIC-STH '09},
year = {2009},
month = {Sep},
pages = {630-635},
doi = {https://doi.org/10.1109/TIC-STH.2009.5444424},
pdf = {papers/icelasso.pdf},
teaser = {teasers/icelasso.png},
abstract = {Lasso selection tends to be inefficient in many circumstances such as selecting spatially large clusters. ICE-Lasso is a novel technique that infers likely target clusters during an ongoing lasso gesture. It provides efficient gesture-based interaction techniques as shortcuts to select partial, complete, and multiple clusters. Additionally, it is overloaded on the traditional lasso via automatic mode switching. A comparative user study show that ICE-Lasso is significantly more efficient than lasso and also well-liked by users.},
keywords = {group selection},
}
@inproceedings{scoditti2009new,
title = {A New Layout Method for Graphical User Interfaces},
author = {Scoditti*, Adriano and Stuerzlinger, Wolfgang},
booktitle = {International Conference Science and Technology for Humanity},
publisher = {IEEE},
series = {TIC-STH '09},
year = {2009},
month = {Sep},
pages = {642-647},
doi = {https://doi.org/10.1109/TIC-STH.2009.5444422},
pdf = {papers/intuilayout.pdf},
teaser = {teasers/intuilayout.png},
abstract = {The layout mechanisms for many GUI toolkits are hard to understand, the associated tools and API's often difficult to use. This work investigates new, easy-to-understand layout mechanisms and evaluates its implementation. We will analyze the requirements for the definition of layouts of a graphical user interface. Part of the issue is that several aspects need to be considered simultaneously while laying-out a component: the alignment with other components as well as its own behaviour while resizing its container. Moreover, the used tools should isolate the designer/drawer from the implementation details of the framework. We present the details of our new GUI layout system, discuss the choices we made for our new layout algorithm and detail implementation issues. Moreover, we present also the user interface for our new GUI builder system that contains several innovations, such as a preview window to show the effects of layout configuration choices in real-time. We present an evaluation of our new system by attacking the complex GUI layout problem mentioned above.},
keywords = {GUI, layout},
}
@inproceedings{pavlovych2009tradeoff,
title = {The Tradeoff Between Spatial Jitter and Latency in Pointing Tasks},
author = {Pavlovych*, Andriy and Stuerzlinger, Wolfgang},
booktitle = {Symposium on Engineering Interactive Computing Systems},
publisher = {ACM},
series = {EICS '09},
year = {2009},
month = {Jul},
pages = {187-196},
doi = {https://doi.org/10.1145/1570433.1570469},
pdf = {papers/latencyjitter.pdf},
teaser = {teasers/latencyjitter.png},
abstract = {Interactive computing systems frequently use pointing as an input modality, while also supporting other forms of input such as alphanumeric, voice, gesture, and force.We focus on pointing and investigate the effects of input device latency and spatial jitter on 2D pointing speed and accuracy. First, we characterize the latency and jitter of several common input devices. Then we present an experiment, based on ISO 9241-9, where we systematically explore combinations of latency and jitter on a desktop mouse to measure how these factors affect human performance. The results indicate that, while latency has a stronger effect on human performance compared to low amounts of spatial jitter, jitter dramatically increases the error rate, roughly inversely proportional to the target size.The findings can be used in the design of pointing devices for interactive systems, by providing a guideline for choosing parameters of spatial filtering to compensate for jitter, since stronger filtering typically also increases lag. We also describe target sizes at which error rates start to increase notably, as this is relevant for user interfaces where hand tremor or similar factors play a major role.},
keywords = {pointing, jitter},
}
@inproceedings{dehmeshki2009gpsel,
title = {GPSel: A Gestural Perceptual-based Path Selection Technique},
author = {Dehmeshki*, Hoda and Stuerzlinger, Wolfgang},
booktitle = {Smart Graphics},
publisher = {Springer},
series = {SG '09},
year = {2009},
month = {May},
volume = {LNCS 5531},
pages = {243-252},
doi = {https://doi.org/10.1007/978-3-642-02115-2_21},
pdf = {papers/gpsel.pdf},
teaser = {teasers/gpsel.png},
abstract = {This paper introduces a gestural perceptual-based approach to select objects, i.e., nodes and/or edges along paths. Based on known results from perception research, we propose a model to detect perceptually salient paths formed by the Gestalt principles of good continuity and closure. Then we introduce gestural interaction techniques that enable users to select single or multiple perceptual paths, as well as resolving ambiguities in selection. The result of a user study shows that our system outperforms current techniques for path selection.},
keywords = {group selection, gestures},
}
@inproceedings{teather2009effectstracking,
title = {Effects of Tracking Technology, Latency, and Spatial Jitter on Object Movement},
author = {Teather*, Robert J. and Pavlovych*, Andriy and Stuerzlinger, Wolfgang and {MacKenzie}, I. Scott},
booktitle = {Symposium on {3D} User Interfaces},
publisher = {IEEE},
series = {3DUI '09},
year = {2009},
month = {Mar},
pages = {43-50},
doi = {https://doi.org/10.1109/3DUI.2009.4811204},
pdf = {papers/deviceeffects3D.pdf},
teaser = {teasers/deviceeffects3D.png},
abstract = {We investigate the effects of input device latency and spatial jitter on 2D pointing tasks and 3D object movement tasks. First, we characterize jitter and latency in a 3D tracking device and an optical mouse used as a baseline comparison. We then present an experiment based on ISO 9241-9, which measures performance characteristics of pointing devices. We artificially introduce latency and jitter to the mouse and compared the results to the 3D tracker. Results indicate that latency has a much stronger effect on human performance than low amounts of spatial jitter. In a second study, we use a subset of conditions from the first to test latency and jitter on 3D object movement. The results indicate that large, uncharacterized jitter ldquospikesrdquo significantly impact 3D performance.},
keywords = {3D pointing, latency, jitter},
}
@inproceedings{das2008modeling,
title = {Modeling Learning Effects in Mobile Texting},
author = {Das*, Arindam and Stuerzlinger, Wolfgang},
booktitle = {International Conference on Mobile and Ubiquitous Multimedia},
publisher = {ACM},
series = {MUM '08},
year = {2008},
month = {Dec},
pages = {154-161},
doi = {https://doi.org/10.1145/1543137.1543169},
pdf = {papers/learneffectsmodel.pdf},
teaser = {teasers/learneffectsmodel.png},
abstract = {No work on mobile text messaging so far has taken into account the effect of learning on the change in visual exploration behavior as users progress from non-expert to expert level. We discuss within the domain of multi-tap texting on mobile phone and address the process of searching versus selecting a letter on the keypad interface. We develop a simulation model that forecasts the probability of letter location recall by non-expert users and thereby models learning, as the user acquires expertise in recalling, with practice, session after session. We then plugin this probability within a model of visual strategy that combines the effect of different ways visual exploration: non-expert users search for a letter while expert users select a letter. The observed non-expert non-motor time preceding a key press (for a letter) correlates extremely well with the simulation results.},
keywords = {text entry, learning},
}
@inproceedings{teather2008exaggerated,
title = {Exaggerated Head Motions for Game Viewpoint Control},
author = {Teather*, Robert J. and Stuerzlinger, Wolfgang},
booktitle = {Conference on Future Play: Research, Play, Share},
publisher = {ACM},
series = {FuturePlay '08},
year = {2008},
month = {Nov},
pages = {240-243},
doi = {https://doi.org/10.1145/1496984.1497034},
pdf = {papers/headmotion.pdf},
teaser = {teasers/headmotion.png},
abstract = {In this paper, we present an evaluation of exaggerated headcoupled camera motions in a game-like 3D object movement. Three exaggeration levels were compared to determine if the exaggeration was more beneficial than a realistic 1:1 mapping.The results suggest that there is some user preference for this type of exaggeration; however, no significant differences by the experimental conditions were found, other than a learning effect.},
keywords = {3D navigation, head motion},
}
@inproceedings{pavlovych2008screenconfiguration,
title = {Effect of Screen Configuration and Interaction Devices in Shared Display Groupware},
author = {Pavlovych*, Andriy and Stuerzlinger, Wolfgang},
booktitle = {3rd Workshop on Human-centered Computing},
publisher = {ACM},
series = {HCC '08},
year = {2008},
month = {Oct},
pages = {49-56},
doi = {https://doi.org/10.1145/1462027.1462035},
pdf = {papers/multi_effects.pdf},
teaser = {teasers/multi_effects.png},
abstract = {Interactive tabletop and wall surfaces support collaboration and interactivity in novel ways. Apart from keyboards and mice, such systems can also incorporate other input devices, namely laser pointers, marker pens with screen location sensors, or touch-sensitive surfaces. Similarly, instead of a vertically positioned desktop monitor, collaborative setups typically use much larger displays, which are oriented either vertically (wall) or horizontally (tabletop), or combine both kinds of surfaces.In this paper we describe an empirical study that investigates how technical system constraints can affect group performance in high pace collaborative tasks. For this, we compare various input and output modalities in a system that consists of several interactive tabletop and wall surface(s). We observed that the performance of a group of people scaled almost linearly with the number of participants on an almost perfectly parallel task. We also found that mice were significantly faster than laser pointers, but only by 21%. Also, interaction on walls was significantly faster than on the tabletop, by 51%.},
keywords = {groupware, large display interaction, large display system},
}
@inproceedings{dehmeshki2008groupselect,
title = {Intelligent Mouse-based Object Group Selection},
author = {Dehmeshki*, Hoda and Stuerzlinger, Wolfgang},
booktitle = {Smart Graphics 2008},
publisher = {Springer},
series = {SG '08},
year = {2008},
month = {Aug},
volume = {LNCS 5166},
pages = {33-44},
doi = {https://doi.org/10.1007/978-3-540-85412-8_4},
pdf = {papers/gestaltclick1.pdf},
video = {videos/Gestalt.mp4},
teaser = {teasers/gestaltclick1.png},
abstract = {Modern graphical user interfaces support direct manipulation of objects and object groups. Current object group selection techniques such as lasso and rectangle selection can be time-consuming and error-prone. This paper presents a new approach to group selection that exploits the way human perception naturally groups objects, also known as Gestalt grouping. Based on known results from perception research, we present a novel method to group objects via models of the Gestalt principles of proximity and (curvi-)linearity. Then, we introduce several new mouse-based selection techniques that exploit these Gestalt groups. The results of a user study show that our new technique outperforms lasso and rectangle selection for object groups with an implicit structure, such as (curvi-)linear arrangements or clusters.},
keywords = {group selection},
}
@inproceedings{kerr2008context,
title = {Context-Sensitive Cut, Copy, and Paste},
author = {Kerr+, Reid and Stuerzlinger, Wolfgang},
booktitle = {Conference on Computer Science and Software Engineering},
publisher = {ACM},
series = {C3S2E '08},
year = {2008},
month = {May},
pages = {159-166},
doi = {https://doi.org/10.1145/1370256.1370283},
pdf = {papers/csccap.pdf},
teaser = {teasers/csccap.png},
abstract = {Creating and editing source code are tedious and error-prone processes. One important source of errors in editing programs is the failure to correctly adapt a block of copied code to a new context. This occurs because several dependencies to the surrounding code usually need to be adapted for the new context and it is easy to forget one of them. Conversely, this also makes such errors hard to find.This paper presents a new method for identifying some common types of errors in cut, copy and paste operations. The method analyzes the context of the original block of code and tries to match it with the context in the new location. It utilizes a simple, pattern-based model of context, which we found to be well suited to the analysis of relocated blocks of text. Furthermore, we discuss the ability of our technique to detect semantic errors. While semantic errors are relatively difficult to recognize in a static document, our new technique can infer important information from the original context to detect some semantic mismatches. Finally, we present a proof-of-concept implementation and discuss our simple user interface for context-sensitive cut, copy and paste.},
keywords = {copy, paste, editing, context-sensitive},
}
@inproceedings{teather2008assessing,
title = {Assessing the Effects of Orientation and Device on (Constrained) {3D} Movement Techniques},
author = {Teather*, Robert J. and Stuerzlinger, Wolfgang},
booktitle = {Symposium on {3D} User Interfaces},
publisher = {IEEE},
series = {3DUI '08},
year = {2008},
month = {Mar},
pages = {43-50},
doi = {https://doi.org/10.1109/3DUI.2008.4476590},
pdf = {papers/move3deval.pdf},
teaser = {teasers/move3deval.png},
abstract = {We present two studies to assess which physical factors influence 3D object movement tasks with various input devices. Since past research has shown that a mouse with suitable mapping techniques can serve as a good input device for some 3D object movement tasks, we also evaluate which characteristics of the mouse sustain its success. Our first study evaluates the effect of a supporting surface across orientation of input device movement and display orientation. A 3D tracking device was used in all conditions for consistency. The results of this study are inconclusive; no significant differences were found between the factors examined. The results of a second study show that the mouse outperforms the tracker for speed in all instances. The presence of support also improved accuracy when tracker movement is limited to 2D operation. A 3DOF movement mode performed worst overall.},
keywords = {3D positioning, 3D pointing, orientation},
}
@inproceedings{teather2007guidelines,
title = {Guidelines for {3D} Positioning Techniques},
author = {Teather*, Robert J. and Stuerzlinger, Wolfgang},
booktitle = {Conference on Future Play},
publisher = {ACM},
series = {Futureplay '07},
year = {2007},
month = {Nov},
pages = {61-68},
doi = {https://doi.org/10.1145/1328202.1328214},
pdf = {papers/move3dguidelines.pdf},
teaser = {teasers/move3dguidelines.png},
abstract = {In this paper, we present a set of guidelines for designing 3D positioning techniques. These guidelines are intended for developers of object interaction schemes in 3D games, modeling packages, computer aided design systems, and virtual environments. The guidelines promote intuitive object movement techniques in these types of environments.We then present a study comparing 3D positioning techniques based on these guidelines with 2D and 3D/6D devices across VR display technologies. Display technologies such as stereoscopic graphics and head-coupled perspective provide additional depth cues and could affect how a user perceives and thus interacts with a 3D scene - regardless of the input device/technique used. Thus they are examined as well. The results suggest that 2D devices using "smart" movement algorithms can outperform 3D devices.},
keywords = {3D positioning, orientation},
}
@inproceedings{das2007cognitive,
title = {A Cognitive Simulation Model for Novice Text Entry on Cell Phone Keypads},
author = {Das*, Arindam and Stuerzlinger, Wolfgang},
booktitle = {14th European Conference on Cognitive Ergonomics: Invent! Explore!},
publisher = {ACM},
series = {ECCE '07},
year = {2007},
month = {Aug},
pages = {141-147},
doi = {https://doi.org/10.1145/1362550.1362579},
pdf = {papers/novicecogmodel.pdf},
teaser = {teasers/novicecogmodel.png},
abstract = {Motivation - To create a cognitive simulation model that predicts text entry performance and learning on cell phone keypads by novice users. Research approach - A programmable cognitive architecture, ACT-R, is used to execute the simulation model. Part of the simulation result is compared with the result of a previous user study. Findings/Design - The proposed model is an a priori model (not tuned to any real user data) that predicts the amount of time spent in finding a key on the keypad and pressing it repeatedly. The predicted amount of time in finding a key differs by 6% and the time between two repeated key-presses of the same key by 27% compared to the results of a previous user study. The model also captures the learning of keypad layout by novice users. Memorization of keypad layout is simulated using task repetition. Research limitations/Implications - This research has several limitations described towards the end of this paper. An important one among them is that the work does not model the impact of visual distracters in the field of view (frontal surface of the handset) on user performance. Originality/Value - This is the first cognitive simulation model of novice user's text entry performance and learning on cell phone keypads. Take away message - This work introduces an a priori congnitive model of text entry by novice users. This forms a basis for systematic exploration of keypad designs for cell phones in shorter time and lower cost.},
keywords = {text entry, learning},
}
@inproceedings{tumanov2007variabilityaware,
title = {Variability-Aware Latency Amelioration in Distributed Environments},
author = {Tumanov*, Alexey and Allison, Robert and Stuerzlinger, Wolfgang},
booktitle = {Virtual Reality Conference},
publisher = {IEEE},
series = {VR '07},
year = {2007},
month = {Mar},
pages = {123-130},
doi = {https://doi.org/10.1109/VR.2007.352472},
pdf = {papers/latencypredict.pdf},
teaser = {teasers/latencypredict.png},
abstract = {Application designers of collaborative distributed virtual environments must account for the influence of the network connection and its detrimental effects on user performance. Based upon analysis and classification of existing latency compensation techniques, this paper introduces a novel approach to latency amelioration in the form of a two-tier predictor-estimator framework. The technique is variability-aware due to its proactive sender-side prediction of a pose a variable time into the future. The prediction interval required is estimated based on current and past network delay characteristics. This latency estimate is subsequently used by a Kalman filter-based predictor to replace the measurement event with a predicted pose that matches the event's arrival time at the receiving workstation. The compensation technique was evaluated in a simulation through an offline playback of real head motion data and network delay traces collected under a variety of real network conditions. The experimental results indicate that the variability-aware approach significantly outperforms a state-of-the-art one, which assumes a constant system delay},
keywords = {latency, jitter, virtual reality},
}
@inproceedings{stuerzlinger2006uifacades,
title = {User Interface Façades: Towards Fully Adaptable User Interfaces},
author = {Stuerzlinger, Wolfgang and Chapuis, Olivier and Phillips*, Dustin and Roussel, Nicolas},
booktitle = {19th Symposium on User Interface Software and Technology},
publisher = {ACM},
series = {UIST '06},
year = {2006},
month = {Oct},
pages = {309-318},
doi = {https://doi.org/10.1145/1166253.1166301},
url = {https://ws.iat.sfu.ca/facades},
pdf = {papers/uifacades.pdf},
video = {videos/uifacades.mp4},
teaser = {teasers/uifacades.png},
abstract = {User interfaces are becoming more and more complex. Adaptable and adaptive interfaces have been proposed to address this issue and previous studies have shown that users prefer interfaces that they can adapt to self-adjusting ones. However, most existing systems provide users with little support for adapting their interfaces. Interface customization techniques are still very primitive and usually constricted to particular applications. In this paper, we present User Interface Façades, a system that provides users with simple ways to adapt, reconfigure, and re-combine existing graphical interfaces, through the use of direct manipulation techniques. The paper describes the user's view of the system, provides some technical details, and presents several examples to illustrate its potential.},
keywords = {facades, GUI, layout, copy, paste},
}
@inproceedings{oh2006sesame,
title = {{SESAME}: Towards Better {3D} Conceptual Design Systems},
author = {Oh*, Ji-Young and Stuerzlinger, Wolfgang and Danahy, John},
booktitle = {6th Conference on Designing Interactive Systems},
publisher = {ACM},
series = {DIS '06},
year = {2006},
month = {Jun},
pages = {80-89},
doi = {https://doi.org/10.1145/1142405.1142419},
pdf = {papers/sesameui.pdf},
video = {videos/sesame.m4v},
teaser = {teasers/sesameui.png},
abstract = {Conceptual design dominates the early stages of most creative design processes. During these stages, the designer makes important decisions about the parameters of a model that are aimed at satisfying a set of design criteria. To do this, the designer produces many sketches of various possible solutions. Meanwhile, computer-aided design (CAD) systems are becoming the dominant visual medium used in design practice. However, these tools evolved as documentation production tools and do not support conceptual thinking. This paper presents a list of guidelines for computer support for conceptual design activities on 3D scenes and presents SESAME (Sketch, Extrude, Sculpt, and Manipulate Easily), a system based on these guidelines. Finally, we present a user study comparing SESAME with a conventional CAD package to demonstrate the effectiveness of SESAME.},
keywords = {design, snapping, 3D positioning, 3D manipulation, 3D modeling},
}
@inproceedings{baradaran2006comparison,
title = {A Comparison of Real and Virtual {3D} Construction Tools with Novice Users},
author = {Baradaran+, Hooman and Stuerzlinger, Wolfgang},
booktitle = {International Conference on Computer Graphics & Virtual Reality},
series = {CGVR '06},
isbn = {978-1-93241585-8},
year = {2006},
month = {Jun},
pages = {10-14},
url = {https://dblp.org/db/conf/cgvr/cgvr2006},
pdf = {papers/hapticslego.pdf},
teaser = {teasers/hapticslego.png},
abstract = {In this paper, we present the results of a comparative evaluation of a "virtual Lego" system against real Lego bricks with novice users. The virtual Lego system was designed to emulate the behavior of real Lego bricks as close as possible, while still allowing for efficient operation. We implemented two different user interfaces for the virtual Lego system, namely controlling it with a 2D mouse, based on an efficient mapping from 2D to 3D, as well as with a 3D haptics device, which provides haptic feedback to the user. The results of our study show that real Lego is still significantly faster for first-time users (i.e. users with minimal training). A more surprising result is that the 2D mouse condition and the 3D haptics condition did not differ significantly - even though the 3D haptics condition provides much richer feedback. We discuss the results and speculate about the underlying reasons.},
keywords = {haptics, 3D positioning, 3D manipulation, design, lego},
}
@inproceedings{parilov2006multiview,
title = {Multi-view Visibility Orderings for Real-Time Point-Sampled Rendering},
author = {Parilov*, Sergey and Stuerzlinger, Wolfgang},
booktitle = {International Conference on Computer Graphics & Virtual Reality},
series = {CGVR '06},
isbn = {978-1-93241585-8},
year = {2006},
month = {Jun},
pages = {125-131},
url = {https://dblp.org/db/conf/cgvr/cgvr2006},
pdf = {papers/fastibr.pdf},
video = {videos/ibr_pointsampled.mp4},
teaser = {teasers/fastibr.png},
abstract = {Occlusion-compatible traversals and z-buffering are often regarded as the only choices for resolving visibility in the image- and point-based rendering community. These algorithms do either per-frame or per-pixel computations. This paper first discusses visibility orderings for point samples in general and then discusses orderings that are valid for multiple views. Then we present a novel, highly efficient, visibility algorithm for point-sampled models that has much smaller per-frame cost than previous approaches. We also discuss a high-performance, cache friendly implementation of this visibility method and present results. Finally, we speculate on possible hardware implementations.},
keywords = {rendering, real-time, visibility},
}
@inproceedings{boehl2006areashadow,
title = {Real-time Computation Of Area Shadows - A Geometrical Algorithm},
author = {Boehl*, Michael and Stuerzlinger, Wolfgang},
booktitle = {International Conference on Computer Graphics & Virtual Reality},
series = {CGVR '06},
isbn = {978-1-93241585-8},
year = {2006},
month = {Jun},
pages = {118-124},
url = {https://dblp.org/db/conf/cgvr/cgvr2006},
pdf = {papers/penumbras.pdf},
teaser = {teasers/penumbras.png},
abstract = {The computation of soft shadows created by area light sources is a well-known problem in computer graphics. Due to the complexity of the problem, soft shadows commonly are generated only for images that are rendered in an off-line process. In interactive virtual environments, where images have to be computed in real time, soft shadows are mostly replaced by hard shadows as this takes much less time to compute.
This paper presents an algorithm that uses a geometrical method to generate a triangulated approximation of the soft shadow cast by a polygonal object very quickly. The algorithm can simulate effects such as the varying width of penumbras depending on distance to the light and can be extended to support non-convex light sources as well. We mention the artifacts arising from triangulation and give discuss how to alleviate such problems.},
keywords = {rendering, real-time},
}
@inproceedings{oh2006groupselect,
title = {Group Selection Techniques for Efficient {3D} Modeling},
author = {Oh*, Ji-Young and Stuerzlinger, Wolfgang and Dadgari*, Darius},
booktitle = {Symposium on {3D} User Interfaces},
publisher = {IEEE},
series = {3DUI '06},
year = {2006},
month = {Mar},
pages = {95-102},
doi = {https://doi.org/10.1109/VR.2006.66},
pdf = {papers/sesamegrouping.pdf},
video = {videos/sesame_multiclick.m4v},
teaser = {teasers/sesamegrouping.png},
abstract = {Object selection and manipulation (e.g. moving, rotating) are the most basic tasks in 3D scene construction. While most research on selection and manipulation techniques targets single objects, we examine the concept of group selection in this paper. Group selection is often given lesser importance than single object selection, yet is vital in providing users with a way to modify larger scenes with objects which are repetitive, sequential, or otherwise inherently understood as 'belonging together' by a user. We observed users manipulating objects in 3D scenes, and while doing so, they clearly expected that objects would be grouped based on their gravitational relationship. That is, all objects that are supported by some selected object will follow the motion of the selected object when manipulated. In this paper, we present a system that efficiently supports the manipulation of groups of objects via a gravitational hierarchy. As this hierarchy is derived with a collision detector, the new grouping techniques do not require semantic or user specified information to work. The results of the evaluation show that using the gravitational hierarchy improves scene rearrangement significantly compared to conventional non-hierarchical methods. Finally, we discuss lessons learned from this study and make some suggestions on how the results can be incorporated into other systems.},
keywords = {group selection, 3D positioning, 3D modeling, 3D manipulation},
}
@inproceedings{pavlovych2005hdrproject,
title = {A High-Dynamic Range Projection System},
author = {Pavlovych*, Andriy and Stuerzlinger, Wolfgang},
booktitle = {Photonic Applications in Biosensing and Imaging},
publisher = {SPIE},
series = {Photonics North '05},
year = {2005},
month = {Sep},
volume = {SPIE 5969},
numpages = {8},
doi = {https://doi.org/10.1117/12.629117},
url = {https://ws.iat.sfu.ca/hdrproj.html},
pdf = {papers/hdrproject.pdf},
teaser = {teasers/hdrproject.png},
abstract = {The dynamic range in many real-world environments surpasses the capabilities of traditional display technologies by several orders of magnitude. Recently, a novel display capable of displaying images with a dynamic range much closer to real world situations has been demonstrated. This was achieved through a spatially modulated backlight behind an LCD panel. Combined with the modulating power of the LCD panel itself, this enabled the display of much higher contrast compared to an LCD panel with a spatially uniform backlight.
In this paper, we describe a further development of the technology, namely a high dynamic range projection system. This makes such display systems more widely applicable as any surface can be used for the display of high dynamic range images.
Our new system is designed as an external attachment to a regular DLP-based projector, which allows the use of unmodified projectors. It works by adapting the projected image via a set of lenses to form a small image. This small image is then modulated via an LCD panel and the result is projected via another lens system onto a larger screen, as in traditional projection scenarios. The double modulation, by the projector and the LCD panel together, creates a high dynamic range image and an ANSI contrast of over 700:1.
Finally, we discuss the advantages and disadvantages of our design relative to other high and low dynamic range display technologies and its potential applications.},
keywords = {high dynamic range, projector},
}
@inproceedings{oh2005comparing,
title = {Comparing {SESAME} and Sketching on Paper for Conceptual {3D} Design},
author = {Oh*, Ji-Young and Stuerzlinger, Wolfgang and Danahy, John},
booktitle = {Sketch-Based Interfaces and Modeling},
publisher = {Eurographics},
series = {SBM '05},
year = {2005},
month = {Aug},
pages = {81-88},
doi = {https://doi.org/10.2312/SBM/SBM05/081-087},
pdf = {papers/sesamecompare.pdf},
teaser = {teasers/sesamecompare.png},
abstract = {In the early stages of design, several concepts are usually generated to explore the possibilities. This paper investigates how well a computer-based system can support design thinking. SESAME is a novel 3D design system that aims to support creativity during the explorative phase of the design process. We report an evaluation comparing SESAME to paper sketching for early design exploration in an urban design scenario. Through the user evaluation, we illustrate how important it is to support essential properties of traditional sketching, such as rapid creation/modification, emergent shapes, and tolerance to ambiguity. Additionally, we show that a 3D system can indeed facilitate form exploration at the early stages of design thinking.},
keywords = {3D modeling, 3D manipulation, 3D sketching, drawing},
footnote = {SESAME was a co-evolution with SketchUp, https://www.sketchup.com},
}
@inproceedings{pavlovych2005analysis,
title = {An Analysis of Novice Text Entry Performance on Large Interactive Wall Surfaces},
author = {Pavlovych*, Andriy and Stuerzlinger, Wolfgang},
booktitle = {Human Computer International, CD},
publisher = {Lawrence Erlbaum},
series = {HCI International '05},
isbn = {978-080585807-5},
year = {2005},
month = {Jul},
numpages = {10},
url = {http://www.hci.international/index.php?module=conference&CF_op=view&CF_id=4},
pdf = {papers/whiteboardtext.pdf},
teaser = {teasers/whiteboardtext.png},
abstract = {This paper presents a comparative study of several soft keyboard layouts for text entry on interactive whiteboards. We compare the traditional QWERTY with several other layouts, including theoretically optimal ones, such as FITALY. In contrast to previous work, we concentrate on novice performance, as few people ever gain expert status on whiteboards.
The results show that for a population of regular keyboard users, QWERTY is the best alternative and even the slightest deviations from that arrangement degrade the performance significantly. Based on the experiments, we present an in-depth analysis of the behaviour of users for several layouts from a cognitive viewpoint.},
keywords = {text entry, large display interaction, novice},
}
@inproceedings{stachniak2005terrain,
title = {An Algorithm for Automated Fractal Terrain Deformation},
author = {Stachniak*, Szymon and Stuerzlinger, Wolfgang},
booktitle = {Computer Graphics and Artificial Intelligence},
series = {3IA '05},
commented-isbn = {978-291425607-0},
year = {2005},
month = {May},
pages = {64-76},
url = {http://www.msi.unilim.fr/3IA},
pdf = {papers/fractaldeform.pdf},
video = {videos/fractal_deform.mp4},
teaser = {teasers/fractaldeform.png},
abstract = {Fractal terrains provide an easy way to generate realistic landscapes. There are several methods to generate fractal terrains, but none of those algorithms allow the user much flexibility in controlling the shape or properties of the final outcome. A few methods to modify fractal terrains have been previously proposed, both algorithm-based as well as by hand editing, but none of these provide a general solution.
In this work, we present a new algorithm for fractal terrain deformation. We present a general solution that can be applied to a wide variety of deformations. Our approach employs stochastic local search to identify a sequence of local modifications, which deform the fractal terrain to conform to a set of specified constraints. The presented results show that the new method can incorporate multiple constraints simultaneously, while still preserving the natural look of the fractal terrain.},
keywords = {fractal, terrain, rendering, ray tracing},
}
@inproceedings{oh2005moving,
title = {Moving Objects with {2D} Input Devices in CAD Systems and Desktop Virtual Environments},
author = {Oh*, Ji-Young and Stuerzlinger, Wolfgang},
booktitle = {Graphics Interface},
series = {GI '05},
year = {2005},
month = {May},
pages = {195-202},
url = {https://graphicsinterface.org/proceedings/gi2005/gi2005-24},
pdf = {papers/move3d.pdf},
video = {videos/sesameMove3D2005.mp4},
teaser = {teasers/move3d.png},
abstract = {Part assembly and scene layout are basic tasks in 3D design in Desktop Virtual Environment (DVE) systems as well as Computer Aided Design (CAD) systems. 2D input devices such as a mouse or a stylus are still the most common input devices for such systems. With such devices, a notably difficult problem is to provide an efficient and predictable object motion in 3D based on their 2D motion. This paper presents a new technique to move objects in CAD/DVE using 2D input devices.
The technique presented in this paper utilizes the fact that people easily recognize the depth-order of shapes based on occlusions. In the presented technique, the object position follows the mouse cursor position, while the object slides on various surfaces in the scene. In contrast to existing techniques, the movement surface and the relative object position is determined using the whole area of overlap of the moving object with the static scene. The resulting object movement is visually smooth and predictable, while avoiding undesirable collisions. The proposed technique makes use of the framebuffer for efficiency and runs in real-time. Finally, the evaluation of the new technique with a user study shows that it compares very favorably to conventional techniques.},
keywords = {3D positioning, 3D modeling, 3D manipulation, sliding},
}
@inproceedings{vorozcovs2005hedgehog,
title = {The Hedgehog: A Novel Optical Tracking Method for Spatially Immersive Displays},
author = {Vorozcovs*, Andrew and Hogue*, Andrew and Stuerzlinger, Wolfgang},
booktitle = {Virtual Reality},
publisher = {IEEE},
series = {VR '05},
year = {2005},
month = {Mar},
pages = {83-89},
doi = {https://doi.org/10.1109/VR.2005.1492757},
pdf = {papers/hedgehog.pdf},
teaser = {teasers/hedgehog.png},
abstract = {Existing commercial technologies do not adequately meet the requirements for tracking in fully-enclosed VR displays. We present the Hedgehog, which overcomes several limitations imposed by existing sensors and tracking technology. The tracking system robustly and reliably estimates the 6DOF pose of the device with high accuracy and a reasonable update rate. The system is composed of several cameras viewing the display walls and an arrangement of laser diodes secured to the user. The light emitted from the lasers projects onto the display walls and the 2D centroids of the projections are tracked to estimate the 6DOF pose of the device. The system is able to handle ambiguous laser projection configurations, static and dynamic occlusions of the lasers, and incorporates an intelligent laser activation control mechanism that determines which lasers are most likely to improve the pose estimate. The Hedgehog is also capable of performing auto-calibration of the necessary camera parameters through the use of the SCAAT algorithm. A preliminary evaluation reveals that the system has an angular resolution of 0.01 degrees RMS and a position resolution of 0.2 mm RMS.},
keywords = {3D tracking},
}
@inproceedings{pavlovych2004laser,
title = {Laser Pointers as Interaction Devices for Collaborative Pervasive Computing},
author = {Pavlovych*, Andriy and Stuerzlinger, Wolfgang},
booktitle = {Advances in Pervasive Computing},
publisher = {OCG},
series = {Pervasive '04},
isbn = {978-385403176-5},
year = {2004},
month = {Apr},
pages = {315-320},
url = {http://www.pervasive2004.org},
pdf = {papers/lasers_improved.pdf},
teaser = {teasers/lasers_improved.png},
abstract = {We present a system that supports collaborative interactions for arbitrary environments. The system uses laser pointers as interaction devices and employs a video camera to detect where each laser pointer is pointing. Time-division multiplexing together with a wireless link affords discrimination between laser pointer dots belonging to different pointers. Safety issues with laser pointers are addressed with a new technique. We also discuss how new users can be dynamically added and removed from the system.},
keywords = {pointing, collaboration, laser},
}
@inproceedings{pavlovych2004model,
title = {Model for non-Expert Text Entry Speed on 12-Button Phone Keypads},
author = {Pavlovych*, Andriy and Stuerzlinger, Wolfgang},
booktitle = {{SIGCHI} Conference on Human Factors in Computing Systems},
publisher = {ACM},
series = {CHI '04},
year = {2004},
month = {Apr},
pages = {351-358},
doi = {https://doi.org/10.1145/985692.985737},
pdf = {papers/novicemodel.pdf},
teaser = {teasers/novicemodel.png},
abstract = {In this paper we present a new model for predicting text entry speed on a 12-button mobile phone keypad. The proposed model can predict the performance of novice users. Like other models for text entry, the proposed model includes a movement component based on Fitts' law and a linguistic component based on letter digraph probabilities. It also adds cognitive delay times before key presses and takes into account the fact that Fitts' law cannot model multiple presses of the same key accurately. Finally, we compare the prediction of our model to previously published experimental results, demonstrate that it fits observed results for novices very well, and list some observations about learning.},
keywords = {text entry, mode, novice},
}
@inproceedings{oh2003intelligent,
title = {Intelligent Manipulation Techniques for Conceptual {3D} Design},
author = {Oh*, Ji-Young and Stuerzlinger, Wolfgang},
booktitle = {Human-Computer Interaction},
publisher = {IFIP},
series = {INTERACT '03},
isbn = {978-158603363-7},
year = {2003},
month = {Sep},
pages = {319-326},
url = {https://www.interaction-design.org/literature/conference/proceedings-of-ifip-interact03-human-computer-interaction},
pdf = {papers/legomanip.pdf},
video = {videos/lego.m4v},
teaser = {teasers/legomanip.png},
abstract = {One of the main operations in conceptual 3D design is the rearrangement of single and composite objects. This paper presents a new conceptual 3D design system that affords easy manipulation of composite objects. We discuss several alternative manipulation techniques to separate complex parts off an existing model. Then, we present a new way to move such parts in a 3D scene, as well as an algorithm to place parts at arbitrary locations. Finally, we present and discuss the results of a user study of these manipulation techniques.},
keywords = {3D modeling, 3D positioning, 3D manipulation, lego},
}
@inproceedings{pavlovych2003lesstap,
title = {Less-Tap: A Fast and Easy-to-learn Text Input Technique for Phones},
author = {Pavlovych*, Andriy and Stuerzlinger, Wolfgang},
booktitle = {Graphics Interface},
series = {GI '03},
year = {2003},
month = {Jun},
pages = {97-104},
doi = {https://doi.org/10.20380/GI2003.12},
pdf = {papers/lesstap.pdf},
teaser = {teasers/lesstap.png},
abstract = {A new technique to enter text using a mobile phone keypad, Less-Tap, is described. The traditional touch-tone phone keypad is ambiguous for text input because each button encodes 3 or 4 letters. As in Multitap, our method requires the user to press buttons repeatedly to get a required letter. However, in Less-Tap, letters are rearranged within each button according to their frequency. This way, the most common letters require only one key press.
Unlike dictionary based methods, Less-Tap facilitates the entry of arbitrary words. Unlike LetterWise and T9, Less-Tap allows entering text without having to visually verify the result, after some initial training. For English, Less-Tap requires an average of 1.5266 keystrokes per character (vs. 2.0342 in Multitap).
We conducted a user study to compare Less-Tap against Multitap. Each participant had three 20-minute sessions with each technique. The mean entry speed was 9.5% higher with the new technique.},
keywords = {text entry, mobile device},
}
@inproceedings{oh2002laser,
title = {Laser Pointers as Collaborative Pointing Devices},
author = {Oh*, Ji-Young and Stuerzlinger, Wolfgang},
booktitle = {Graphics Interface},
series = {GI '02},
year = {2002},
month = {May},
pages = {141-149},
doi = {https://doi.org/10.20380/GI2002.17},
pdf = {papers/multi_laser.pdf},
video = {videos/laser_multi.mp4},
teaser = {teasers/multi_laser.png},
abstract = {Single Display Groupware (SDG) is a research area that focuses on providing collaborative computing environments. Traditionally, most hardware platforms for SDG support only one person interacting at any given time, which limits collaboration. In this paper, we present laser pointers as input devices that can provide concurrent input streams ideally required to the SDG environment.
First, we discuss several issues related to utilization of laser pointers and present the new concept of computer controlled laser pointers. Then we briefly present a performance evaluation of laser pointers as input devices and a baseline comparison with the mouse according to the ISO 9241-9 standard.
Finally, we describe a new system that uses multiple computer controlled laser pointers as interaction devices for one or more displays. Several alternatives for distinguishing between different laser pointers are presented, and an implementation of one of them is demonstrated with SDG applications.},
keywords = {laser, pointing, collaboration},
}
@inproceedings{stuerzlinger2002efficient,
title = {Efficient Manipulation of Object Groups in Virtual Environments},
author = {Stuerzlinger, Wolfgang and Smith*, Graham},
booktitle = {Virtual Reality},
publisher = {IEEE},
series = {VR '02},
year = {2002},
month = {Mar},
pages = {251-258},
doi = {https://doi.org/10.1109/VR.2002.996529},
pdf = {papers/mive_vr2002.pdf},
video = {videos/mive_duals.mp4},
teaser = {teasers/mive_vr2002.png},
abstract = {We describe simple techniques for object group manipulation, an important operation in user interaction with a virtual environment. All presented manipulation techniques exploit constraints to simplify user interaction. The techniques are based on how humans perceive groups and afford direct manipulation of such groups. Furthermore, we introduce two new intuitive ways to create a whole group of objects: drag-add and random drag-add. Finally, we present an evaluation of the presented techniques.},
keywords = {group selection, 3D positioning, 3D manipulation},
}
@inproceedings{robinson2002ivy,
title = {IVY: The Immersive Visual Environment at York},
author = {Robinson, Matt and Laurence, Jeff R. and Zacher, James and Hogue*, Andrew and Allison, Robert and Harris, Laurence and Jenkin, Michael and Stuerzlinger, Wolfgang},
booktitle = {International Immersive Projection Technology Symposium},
series = {IPT '02},
year = {2002},
month = {Mar},
numpages = {6},
url = {http://vr.iao.fhg.de/ipt-egve},
pdf = {papers/ivy_ipt2002.pdf},
teaser = {teasers/ivy_ipt2002.png},
abstract = {Given the limitations of head mounted display systems, there has been significant interest in the development of large-scale virtual environments such as video walls, immersive project displays, and similar devices. Although these devices do provide a wide-field visual display, very few of these devices are completely immersive as the user may view the visual world or they may be tethered to the real world via tracking systems. In this paper we present the motivation and design of IVY: The Immersive Visual environment currently under construction at Y ork University (IVY).},
keywords = {cave, immersive display system, 3D tracking},
}
@inproceedings{robinson2001growing,
title = {Growing IVY: Building the Immersive Visual Environment at York},
author = {Robinson, Matt and Laurence, Jeff R. and Zacher, James and Hogue*, Andrew and Allison, Robert and Harris, Laurence and Jenkin, Michael and Stuerzlinger, Wolfgang},
booktitle = {11th International Conference on Artificial Reality and Tele-existence},
series = {ICAT '01},
year = {2001},
month = {Dec},
pages = {85-89},
url = {http://icat.vrsj.org/ICAT2001},
pdf = {papers/ivy_icat2001.pdf},
teaser = {teasers/ivy_icat2001.png},
abstract = {When we move about within our environment, we are presented with a range of cues to our motion. Virtual reality systems attempt to simulate these various sensory cues. IVY – the Immersive Visual environment at York – is a virtual environment being constructed at York University to investigate aspects of human perception and to examine the relative importance of various visual and non-visual cues to the generation of an effective virtual environment. This paper describes the movation behind the design of IVY, and describes the design of the essential hardware and software components.},
keywords = {cave, immersive display system, 3D tracking},
}
@inproceedings{smith2001integration,
title = {Integration of Constraints into a VR Environment},
author = {Smith*, Graham and Stuerzlinger, Wolfgang},
booktitle = {Virtual Reality International Conference, Laval Virtual},
series = {VRIC '01},
isbn = {978-295157300-0},
year = {2001},
month = {Jun},
pages = {103-110},
pdf = {papers/mive_vric2001.pdf},
video = {videos/mive_creation.mp4},
teaser = {teasers/mive_vric2001.png},
abstract = {Interactive Virtual Reality applications are in general complex and non-intuitive. One fundamental problem is that manipulation of 3D objects is very difficult for non-experienced users. We describe a constraint based 3D scene construction system that exploits human intuitions to restrict object placement and interactions. In particular, we focus on the constraints themselves by describing how they are defined, and how they are used within a scene. Several different types of constraints are discussed, including virtual constraints, which decouple the constraint areas from the geometry of an object, and negative constraints, which restrict object placements within certain volumes of space. Furthermore, we discuss techniques that can be used to automatically generate constraints for most geometric objects, which makes incorporating new objects into the system much easier. Finally, we argue that the presented constraint techniques can be incorporated into existing Virtual Reality systems to make interactions easier.},
keywords = {3D manipulation, 3D positioning, constraints},
}
@inproceedings{smith2001scenedevices,
title = {{3D} Scene Manipulation with {2D} Devices and Constraints},
author = {Smith*, Graham and Salzman*, Tim and Stuerzlinger, Wolfgang},
booktitle = {Graphics Interface},
series = {GI '01},
year = {2001},
month = {Jun},
pages = {135-142},
doi = {https://doi.org/10.20380/GI2001.16},
pdf = {papers/mive_gi2001.pdf},
video = {videos/mive_resize.mp4},
teaser = {teasers/mive_gi2001.png},
abstract = {Content creation for computer graphics applications is a laborious process that requires skilled personnel. One fundamental problem is that manipulation of 3D objects with 2D user interfaces is very difficult for non-experienced users.
In this paper, we introduce a new system that uses constraints to restrict object motion in a 3D scene, making interaction much simpler and more intuitive. We compare three different 3D scene manipulation techniques based on a 2D user interface. We show that the presented techniques are significantly more efficient than commonly used solutions. To our knowledge, this is the first evaluation of 3D manipulation techniques with 2D devices and constraints.},
keywords = {3D manipulation, 3D positioning, constraints},
}
@inproceedings{smith2001sceneconstraints,
title = {{3D} Scene Manipulation with Constraints},
author = {Smith*, Graham and Salzman*, Tim and Stuerzlinger, Wolfgang},
booktitle = {Virtual and Augmented Architecture},
series = {VAA '01},
year = {2001},
month = {Jun},
pages = {35-46},
doi = {https://doi.org/10.1007/978-1-4471-0337-0_4},
pdf = {papers/mive_vaa2001.pdf},
teaser = {teasers/mive_vaa2001.png},
abstract = {Content creation for computer graphics applications is a laborious process that requires skilled personnel. One fundamental problem is that manipulation of 3D objects with 2D user interfaces is very difficult for non-experienced users.
In this paper, we introduce a new system that uses constraints to restrict object motion in a 3D scene, making interaction much simpler and more intuitive. We compare three different 3D scene manipulation techniques based on a 2D user interface. We show that the presented techniques are significantly more efficient than commonly used solutions. To our knowledge, this is the first evaluation of 3D manipulation techniques with 2D devices and constraints.},
keywords = {3D manipulation, 3D positioning, constraints},
}
@inproceedings{smith2001utility,
title = {On the Utility of Semantic Constraints},
author = {Smith*, Graham and Stuerzlinger, Wolfgang},
booktitle = {Virtual Environments},
publisher = {Eurorgraphics},
series = {EGVE '01},
year = {2001},
month = {May},
pages = {41-50},
doi = {https://doi.org/10.2312/EGVE/EGVE01/041-050},
pdf = {papers/mive_egve2001.pdf},
video = {videos/mive_pipes.mp4},
teaser = {teasers/mive_egve2001.png},
abstract = {Content creation for computer graphics applications is a laborious process that requires skilled personnel. One fundamental problem is that manipulation of 3D objects with 2D user interfaces is very difficult for non-experienced users. In this paper, we describe a system that uses semantic constraints to restrict object motion in a 3D scene, making interaction much simpler and more intuitive. We compare three different levels of semantic constraints in a 3D scene manipulation program with a 2D user interface. We show that the pr esented techniques are significantly more efficient than alternate techniques, which do not use semantics in their constraints. To our knowledge, this is the first evaluation of 3D manipulation techniques with 2D devices and constraints.},
keywords = {3D manipulation, 3D positioning, constraints},
}
@inproceedings{salzman2001unconstrained,
title = {Unconstrained vs. Constrained {3D} Scene Manipulation},
author = {Salzman*, Tim and Stachniak*, Szymon and Stuerzlinger, Wolfgang},
booktitle = {Engineering for Human-Computer Interaction},
publisher = {Springer},
series = {EHCI '01},
year = {2001},
month = {May},
volume = {LNCS 2254},
pages = {207-219},
doi = {https://doi.org/10.1007/3-540-45348-2_19},
pdf = {papers/mive_ehci2001.pdf},
video = {videos/mive_playing.mp4},
teaser = {teasers/mive_ehci2001.png},
abstract = {Content creation for computer graphics applications is a very time-consuming process that requires skilled personnel. Many people find the manipulation of 3D object with 2D input devices non-intuitive and difficult. We present a system, which restricts the motion of objects in a 3D scene with constraints. In this publication we discuss an experiment that compares two different 3D manipulation interfaces via 2D input devices. The results show clearly that the new constraint-based interface performs significantly better than previous work.},
keywords = {3D manipulation, 3D positioning, constraints},
}
@inproceedings{stuerzlinger1999imaging,
title = {Imaging all Visible Surfaces},
author = {Stuerzlinger, Wolfgang},
booktitle = {Graphics Interface},
series = {GI '99},
year = {1999},
month = {Jun},
pages = {115-122},
doi = {https://doi.org/10.20380/GI1999.16},
pdf = {papers/imgvissurf.pdf},
teaser = {teasers/imgvissurf.png},
abstract = {Today many systems exist to generate geometric models of existing scenes and objects. However, very few systems store accurate data about surface appearance such as colors and textures. One way to capture surface texture data is to record a series of images that, collectively, captures all visible surfaces of the object. Finding good viewpoints for this task is not easy.
This paper presents a new heuristic method to find a good set of viewpoints for a given geometric model. Taking images from the computed viewpoints will show every visible part of every surface at least once. The approach uses a hierarchical visibility algorithm to preprocess the scene. A good set of viewing regions is identified with simulated annealing and then good viewpoints are derived. Results and visualizations of the computed solutions are presented.},
keywords = {3D scanning, next-best view, visibility},
}
@inproceedings{goesele1999semantic,
title = {Semantic Constraints for Scene Manipulation},
author = {Goesele*, Michael and Stuerzlinger, Wolfgang},
booktitle = {SCCG: Spring Conference in Computer Graphics},
series = {SCCG '99},
commented-isbn = {978-802231357-5},
year = {1999},
month = {Apr},
pages = {140-146},
url = {http://sccg.sk/1999_min},
pdf = {papers/semconstr.pdf},
teaser = {teasers/semconstr.png},
abstract = {The creation of object models for computer graphics applications, such as interior design or the generation of animations is a labour-intensive process. Today's computer aided design (CAD) programs address the problem of creating geometric object models quite well. But almost all users find common tasks, such as quickly furnishing a room, hard to accomplish. One of the basic reasons is that manipulation of objects often does not yield the expected results.
This paper presents a new system that exploits knowledge about natural behavior of objects to provide simple and intuitive interaction techniques for object manipulation. Semantic constraints are introduced, which encapsulate such `common knowledge' about objects. Furthermore, we present a new way to automatically infer a scene hierarchy by dynamically grouping objects according to their constraint relationships.},
keywords = {3D manipulation, 3D positioning, constraints},
}
@inproceedings{aliaga1999mmr,
title = {MMR: An Interactive Massive Model Rendering System Using Geometric and Image-Based Acceleration},
author = {Aliaga*, Daniel and Cohen*, Jon and Wilson*, Andrew and Baker*, Eric and Zhang*, Hansong and Erikson*, Carl and Hoff*, Kenny and Hudson*, Tom and Stuerzlinger, Wolfgang and Bastos*, Rui and Whitton, Mary and Brooks, Fred and Manocha, Dinesh},
booktitle = {Symposium on Interactive {3D} Graphics},
publisher = {ACM},
series = {I3D '99},
year = {1999},
month = {Apr},
pages = {199-206},
doi = {https://doi.org/10.1145/300523.300554},
pdf = {papers/mmr.pdf},
teaser = {teasers/mmr.png},
abstract = {We present a system for rendering very complex 3D models at interactive rates. We select a subset of the model as preferred viewpoints and partition the space into virtual cells. Each cell contains near geometry, rendered using levels of detailand visibility culling, and far geometry, rendered as a textured depth mesh. Our system automatically balances the screen-space errors resulting from geometric simplification with those from textured-depth-mesh distortion. We describe our prefetching and data management schemes, both crucial for models significantly larger than available system memory. We have successfully used our system to accelerate walkthroughs of a 13 million triangle model of a large coal-fired power plant and of a 1.7 million triangle architectural model. We demonstrate the walkthrough of a 1.3 GB power plant model with a 140 MB cache footprint.},
keywords = {rendering, real-time},
}
@comment{c, c={leave the "_stuerzlinger" in the ID to enable umlaut-free search!}}
@inproceedings{raskar_stuerzlinger1998efficient,
title = {Efficient Image Generation for Multiprojector and Multisurface Displays},
author = {Raskar*, Ramesh and Cutts*, Matt and Welch, Greg and Stürzlinger, Wolfgang},
booktitle = {Rendering Techniques},
publisher = {Springer},
series = {EGSR '98},
year = {1998},
month = {Jun},
pages = {139-144},
doi = {https://doi.org/10.1007/978-3-7091-6453-2_13},
pdf = {papers/multisurf.pdf},
teaser = {teasers/multisurf.png},
abstract = {We describe an efficient approach to rendering a perspectively correct image on a potentially irregular display surface that may be illuminated with one or more distinct devices. The first pass of the technique generates an image of the desired graphics model using conventional rendering. The second pass projects that image as a texture onto a model of the display surface, then re-renders the textured display surface model from the viewpoint of each display device. The algorithm scales with the complexity of the display surface, and is constant with respect to the complexity of the graphics model.},
keywords = {rendering, real-time, projector},
}
@inproceedings{stuerzlinger1997interactive,
title = {Interactive Rendering of Globally Illuminated Glossy Scenes},
author = {Stürzlinger, Wolfgang and Bastos*, Rui},
booktitle = {Rendering Techniques},
publisher = {Springer},
series = {EGSR '97},
year = {1997},
month = {Jun},
pages = {93-102},
doi = {https://doi.org/10.1007/978-3-7091-6858-5_9},
pdf = {papers/fastglos.pdf},
teaser = {teasers/fastglos.png},
abstract = {Global illumination simulates all transfers of light in a scene. The results of the simulation are then used to generate photo-realistic images. Scenes with diffuse surfaces only can be displayed in real-time using the results of radiosity methods. Images of scenes with more general surfaces are created with methods based on ray tracing but do not achieve interactive frame rates.This paper presents a new algorithm for the display of globally illuminated scenes at interactive speeds. A photon tracing phase computes an approximation to the global illumination. The rendering phase splats the contribution of each photon hit onto the corresponding surface taking reflectance properties and viewing direction into account. Results demonstrate that this method allows to render images of globally illuminated scenes with glossy surfaces at interactive frame rates.},
keywords = {rendering, real-time, global illumination},
}
@inproceedings{stuerzlinger1996generic,
title = {A Generic Interface to Colors, Materials, and Textures},
author = {Stürzlinger, Wolfgang},
booktitle = {Compugraphics},
publisher = {GRASP},
series = {Compugraphics '96},
isbn = {978-972834201-2},
year = {1996},
month = {Dec},
pages = {192-200},
pdf = {papers/genmat.pdf},
teaser = {teasers/genmat.png},
abstract = {Material models predict the reflection of light by surfaces in a scene. Many models have been proposed, all with different scope of effects and different parameters. The same holds for color models and texture definitions. Most computer graphics systems implement only one model with a minimal interface. If a different model is to be integrated this interface needs to be restructured which results in many code changes in the whole system.
This work presents a new approach to a generic interface to colors and materials. By enumerating all possible operations on these graphics objects an interface for reusable and portable code is defined. A seamless integration of textured surfaces into a computer graphics system is made possible by generic texture trees which implement the generic material interface. This portable definition of textures is realized via a tree of texture nodes and texture generators.},
keywords = {rendering, ray tracing},
}
@inproceedings{stuerzlinger1996bounding,
title = {Bounding Volume Construction Using Point Clouds},
author = {Stürzlinger, Wolfgang},
booktitle = {Spring Conference on Computer Graphics},
series = {SCCG '96},
isbn = {978-802231032-1},
year = {1996},
month = {Jun},
pages = {239-246},
url = {http://sccg.sk/1996_min},
pdf = {papers/pcloud.pdf},
teaser = {teasers/pcloud.png},
abstract = {Bounding volumes are used to optimize many graphic algorithms. They permit to decide quickly if a more exact test is likely to succeed or not. The exact test is only applied if the bounding volume test succeeds, which saves time in most cases. Two of the most prominent applications are ray tracing and collision detection.
This paper presents a new method to calculate tight bounding volumes for primitives under arbitrary transformations and hierarchical scene descriptions. An optimized form of storing a convex hull is presented which allows efficient calculation of the bounding volume type used for later processing. Results are shown for the ray tracing of cyclic CSG-graphs used to render plants and other natural phenomena.},
keywords = {rendering, ray tracing, bounding volumes},
}
@comment{c, c={leave the "_stuerzlinger" in the ID to enable umlaut-free search!}}
@inproceedings{burger_stuerzlinger1995immersive,
title = {Immersive Simulation for Computer Vision},
author = {Burger, Wilhelm and Barth, Matthew J. and Stürzlinger, Wolfgang},
booktitle = {Visual Modules},
publisher = {Oldenbourg Press},
isbn = {978-348623476-3},
year = {1995},
month = {May},
pages = {160-168},
pdf = {papers/vision.pdf},
teaser = {teasers/vision.png},
abstract = {Synthetic imagery has often been considered unsuitable for demonstrating the performance of vision algorithms and systems. We argue that (despite many remaining difficulties) simulation and computer graphics are at a point today that make them extremely useful for evaluation and training, even for complex outdoor applications. This is particularly valuable for autonomous and robotics applications, where the lack of suitable training data and ground truth information is a severe bottleneck. Extensive testing in a synthetic environment should become an integral part of the systems development and evaluation process to reduce the possibility of failure in the real word. We describe ongoing efforts towards the development of an "Immersive Perception Simulator" and discuss some of the specific problems involved.},
keywords = {rendering, computer vision, ray tracing, real-time},
}
@comment{c, c={leave the "_stuerzlinger" in the ID to enable umlaut-free search!}}
@inproceedings{schaufler_stuerzlinger1995exact,
title = {Exact and Error Bounded Approximations of Local Illumination},
author = {Schaufler*, Gernot and Stürzlinger, Wolfgang},
booktitle = {Compugraphics},
publisher = {GRASP},
series = {Compugraphics '95},
isbn = {978-972834200-5},
year = {1995},
month = {Dec},
pages = {327-333},
commented-url = {http://www.gup.uni-linz.ac.at:8001/staff/schaufler/papers/local},
pdf = {papers/localillum.pdf},
teaser = {teasers/localillum.png},
abstract = {Recent approaches to realistic image synthesis split the rendering process into two passes. The first pass calculates an approximate global illumination solution, the second produces an image of high quality (from a user selected view point) using the solution obtained in the first pass by applying the local illumination model to each surface point visible through each pixel. This paper presents a new method how to compute the visible surfaces as seen from a surface point - the hemisphere projection. This method allows the exact evaluation of the local illumination model and facilitates the fast and accurate computation of form factors taking occlusion into account. Using the hemisphere projection an exact local pass solution can be obtained. In addition the hemisphere projection can be used to compute an approximation of a point's local illumination to within given error bounds in significantly less time.},
keywords = {rendering, global illumination},
}
@comment{c, c={unfortunate-dup, quasi-parallel, but independent submission by different authors}}
@inproceedings{stuerzlinger1995load,
title = {Load Balancing for a Parallel Radiosity Algorithm},
author = {Stürzlinger, Wolfgang and Schaufler*, Gernot and Volkert, Jens},
booktitle = {Symposium on Parallel Rendering},
publisher = {ACM & IEEE},
series = {PRS '95},
year = {1995},
month = {Oct},
pages = {39-45},
doi = {https://doi.org/10.1145/218327.218335},
pdf = {papers/loadbalancing.pdf},
teaser = {teasers/loadbalancing.png},
abstract = {The radiosity method models the interaction of light between diffuse surfaces, thereby accurately predicting global illumination effects. Due to the high computational effort to calculate the transfer of light between surfaces and the memory requirements for the scene description, a distributed, parallelized version of the algorithm is needed for scenes consisting of thousands of surfaces.
We present several load distribution schemes for such a parallel algorithm which includes progressive refinement and adaptive subdivision for fast solutions of high quality. The load is distributed before the calculations in a static way. During the computation the load is redistributed dynamically to make up for individual differences in processor loads. The dynamic load balancing scheme never generates more data packets than the original algorithm and avoids overloading processors through actions taken by the scheme.},
keywords = {rendering, parallel, global illumination},
}
@comment{c, c={unfortunate-dup, quasi-parallel, but independent submission by different authors}}
@inproceedings{stuerzlinger1995strategies,
title = {Load Balancing Strategies for a Radiosity Algorithm},
author = {Stürzlinger, Wolfgang and Schaufler*, Gernot and Volkert, Jens},
booktitle = {High Performance Computing Symposium},
series = {HPCS '95},
isbn = {978-292131612-5},
year = {1995},
month = {Jul},
pages = {217-228},
url = {http://hpcs.ca},
pdf = {papers/loadbalancing1.pdf},
teaser = {teasers/loadbalancing1.png},
abstract = {The radiosity method models the interaction of light between diffuse surfaces, thereby accurately predicting global illumination effects. Due to the high computational effort to calculate the transfer of light between surfaces and the memory requirements for the scene description, a distributed, parallelized version of the algorithm is needed for scenes consisting of thousands of surfaces.
We present several load distribution schemes for such a parallel algorithm which includes progressive refinement and adaptive subdivision for fast solutions of high quality. The load is distributed before the calculations in a static way. During the computation the load is redistributed dynamically to make up for individual differences in processor loads. The dynamic load balancing scheme never generates more data packets than the original algorithm and avoids overloading processors through actions taken by the scheme.},
keywords = {rendering, parallel, global illumination},
}
@inproceedings{stuerzlinger1995exact,
title = {Exact Projections onto the Hemisphere},
author = {Stürzlinger, Wolfgang},
booktitle = {Spring Conference on Computer Graphics},
series = {SCCG '95},
isbn = {978-802330344-5},
year = {1995},
month = {May},
pages = {31-38},
pdf = {papers/hemisphere.pdf},
teaser = {teasers/hemisphere.png},
abstract = {Recent approaches to realistic image synthesis have split the rendering process into two passes. The first pass calculates an approximate global illumination solution, the second generates an image of high quality from a given view point using the illumination solution obtained in the first pass.
This paper discusses a new method for projecting polygons onto the hemisphere which is the central operation performed for each pixel during the local pass. The method calculates an exact hemispherical projection of all polygons considering occlusion. The chosen representation of the projected polygons facilitates the fast and accurate computation of formfactors with regard to the projection center.
The new hemispherical projection method is used to obtain an exact local pass solution.},
keywords = {rendering, global illumination},
footnote = {Newer work such as "Visibility Silhouettes for Semi-Analytic Spherical Integration", http://dx.doi.org/10.1111/cgf.12257 and "Vectorization for Fast, Analytic, and Differentiable Visibility", https://doi.org/10.1145/3452097 uses the same idea of decomposing projections into convex polygons.},
}
@comment{c, c={leave the "_stuerzlinger" in the ID to enable umlaut-free search!}}
@inproceedings{schaufler_stuerzlinger1995generating,
title = {Generating Multiple Levels of Detail for Polygonal Geometry Models},
author = {Schaufler*, Gernot and Stürzlinger, Wolfgang},
booktitle = {Virtual Environments},
publisher = {Springer},
series = {EGVE '95},
year = {1995},
month = {Jan},
pages = {33-41},
doi = {https://doi.org/10.1007/978-3-7091-9433-1_4},
commented-url = {http://www.gup.uni-linz.ac.at:8001/staff/schaufler/papers/lods},
pdf = {papers/lod.pdf},
teaser = {teasers/lod.png},
abstract = {This paper presents a new method for solving the following problem: Given a polygonal model of some geometric object generate several more and more approximative representations of this object containing less and less polygons. The idea behind the method is that small detail in the model is represented by many spatially close points. A hierarchical clustering algorithm is used to generate a hierarchy of clusters from the vertices of the object's polygons. The coarser the approximation the more points are found to lie within one cluster of points. Each cluster is replaced by one representative point and polygons are reconstructed from these points. A static detail elision algorithm was implemented to prove the practicability of the method. This paper shows examples of approximations generated from different geometry models, pictures of scenes rendered by a detail elision algorithm and timings of the method at work.},
keywords = {rendering, real-time},
}
@inproceedings{stuerzlinger1994parallel2,
title = {Parallel Visibility Calculations for Parallel Radiosity},
author = {Stürzlinger, Wolfgang and Wild*, Christoph},
booktitle = {Parallel Processing: CONPAR — VAPP VI},
publisher = {Springer},
series = {CONPAR '94},
year = {1994},
month = {Sep},
volume = {LNCS 854},
pages = {405-413},
doi = {https://doi.org/10.1007/3-540-58430-7_36},
pdf = {papers/parvis.pdf},
teaser = {teasers/parvis.png},
abstract = {The radiosity method models the interaction of light between diffuse reflecting surfaces, thereby accurately predicting global illumination effects. Due to the high computational effort to calculate the transfer of light between surfaces and the memory requirements for the scene description, a distributed, parallelized verison of the algorithm is needed for scenes consisting of thousands of surfaces. We present a distributed, parallel progressive radiosity algorithm. Then we parallelize the visibility calculations and analyze the results.},
keywords = {rendering, parallel, visibility, global illumination},
}
@inproceedings{stuerzlinger1994adaptive,
title = {Adaptive Mesh Refinement with Discontinuities for the Radiosity Method},
author = {Stürzlinger, Wolfgang},
booktitle = {Photorealistic Rendering Techniques},
publisher = {Springer},
series = {EGSR '94},
year = {1995},
commented-year = {1994},
month = {Aug},
commented-month = {Jun},
pages = {244-253},
doi = {https://doi.org/10.1007/978-3-642-87825-1_18},
pdf = {papers/disco.pdf},
teaser = {teasers/disco.png},
abstract = {The radiosity method simulates the interaction of light between diffuse reflecting surfaces, thereby accurately predicting global illumination effects. One of the main problems of the original algorithm is the inability to represent correctly the shadows cast onto surfaces. Adaptive subdivision techniques were tried but the results are not good enough for general purposes. The conceptually different discontinuity meshing algorithm produces exact pictures of shadow boundaries but is computationally expensive. The newly presented adaptive discontinuity meshing method combines the speed of adaptive subdivision with the quality of the discontinuity meshing method.},
keywords = {rendering, global illumination},
}
@inproceedings{stuerzlinger1994optimization,
title = {Two Optimization Methods for Ray Tracing},
author = {Stürzlinger, Wolfgang and Tobler*, Robert},
booktitle = {Spring School on Computer Graphics},
series = {SCCG '94},
isbn = {978-802230801-4},
year = {1994},
month = {Jun},
pages = {104-107},
pdf = {papers/rtopt.pdf},
teaser = {teasers/rtopt.png},
abstract = {Raytracing is a method to produce photo-realistic pictures. For each pixel of an image one ray is shot to find the object, which determines the color of the pixel. Rays are also used to simulate shadows and reflections. Previously bounding volume hierarchies have been used to speed raytracing. A new method to speed the traversal of a bounding volume hierarchy is presented. Optimisation methods to find the intersection point between the ray and the scene have been introduced previously. A new algorithm based on cylinders is presented also.},
keywords = {rendering, ray tracing},
}
@inproceedings{stuerzlinger1992radiosity,
title = {Radiosity with Voronoi Diagrams},
author = {Stürzlinger, Wolfgang},
booktitle = {Third Eurographics Workshop on Rendering},
publisher = {Consolidation Express},
series = {EGSR '92},
isbn = {978-189785100-5},
year = {1992},
month = {May},
pages = {169-177},
pdf = {papers/radvor.pdf},
teaser = {teasers/radvor.png},
abstract = {Current radiosity methods rely on the calculation of geometric factors, known as form-factors which describe energy exchange between the surfaces of an environment. The most widely used method for storing the illumination across a surface is a mesh of quadrilaterals and/or triangles. For more exact computations these meshes need to be subdivided adaptively. The subdivision methods create artifacts which have visible results. A new technique for storing the surface is presented, based on Voronoi diagrams, which are well suited for the task, and can be subdivided without introducing artifacts.},
keywords = {rendering, global illumination},
}
@comment{************************other_publications************************}
@misc{bashar2026vacgazecontroller,
title = {Effects of Visual Depth on Vergence–Accommodation Conflict in Gaze- and Controller-Based Selection in Virtual Reality},
author = {Bashar*, Mohammad Raihanul and Amini*, Mohammadreza and Mutasim, Aunnoy K. and Barrera Machuca, Mayra D. and Stuerzlinger, Wolfgang and Batmaz, Anil Ufuk},
booktitle = {Extended Abstracts of the CHI Conference on Human Factors in Computing Systems},
publisher = {ACM},
series = {CHI EA '26},
howpublished = {Extended Abstract},
year = {2026},
month = {Apr},
articleno = {250},
numpages = {6},
doi = {https://doi.org/10.1145/3772363.3798344},
pdf = {papers/vacgazecontroller.pdf},
abstract = {The vergence–accommodation conflict (VAC) in stereoscopic head-mounted displays is known to affect depth perception and interaction performance. Prior studies have examined its impact on a controller, but it remains unclear how the VAC affects gaze pointing in Virtual Reality. Here, we investigate gaze- and controller-based 3D target selection under varying depth conditions. Results show that gaze is more sensitive to depth variation, exhibiting longer movement times, higher variability along the task axis, and lower throughput compared to controller-based interaction. "Variation in Diopter" Fitts' law modeling further indicates greater depth-dependent variability for gaze input. Despite these differences, perceived usability and workload were comparable. These findings suggest that the VAC affects pointing modalities differently, which should be considered when designing gaze-enabled 3D interfaces.},
keywords = {eye gaze, 3D pointing},
}
@misc{motoe2026steeringpreview,
title = {Deriving Steering Time Models for Paths with Corners of Varying Curvature Based on Preview-Based Velocity Control},
author = {Motoe*, Koyo and Kasahara*, Nobuhito and Yamanaka, Shota and Stuerzlinger, Wolfgang and Miyashita, Homei},
booktitle = {Extended Abstracts of the CHI Conference on Human Factors in Computing Systems},
publisher = {ACM},
series = {CHI EA '26},
howpublished = {Extended Abstract},
year = {2026},
month = {Apr},
articleno = {204},
numpages = {6},
doi = {https://doi.org/10.1145/3772363.3798500},
pdf = {papers/steeringpreview.pdf},
abstract = {Steering operations, such as menu navigation and drawing, constitute a fundamental GUI interaction. The conventional Steering Law estimates movement times by accumulating the local width of the path, but it suffers from limited predictive accuracy for paths with varying curvature. In contrast, humans tend to adjust their speed by anticipating the path ahead (e.g., when driving). This study proposes a new Preview-based Model, which integrates geometric properties with visual constraints further along the path. Our experimental results show that our model achieved a higher adjusted R^2 (0.983) on curve-included paths than existing models. Furthermore, a simplified formulation without parameter tuning also exhibited comparable accuracy (adjusted R^2 = 0.972), confirming its effectiveness as a practical difficulty metric.},
keywords = {steering, lasso},
}
@misc{hu2025exploringgazesteering,
title = {Exploring and Modeling Gaze-Based Steering Behavior in Virtual Reality},
author = {Hu*, Xuning and Zhang*, Yichuan and Wei*, Yushi and Li, Yue and Stuerzlinger, Wolfgang and Liang, Hai-Ning},
booktitle = {Extended Abstracts of the CHI Conference on Human Factors in Computing Systems},
publisher = {ACM},
series = {CHI EA '25},
howpublished = {Extended Abstract},
year = {2025},
month = {Apr},
articleno = {260},
pages = {1-8},
doi = {https://doi.org/10.1145/3706599.3720273},
pdf = {papers/exploringgazesteering.pdf},
abstract = {Gaze-based interaction is a common input method in virtual reality (VR). Eye movements, such as fixations and saccades, result in different behaviors compared to other input methods. Previous studies on selection tasks showed that, unlike the mouse, the human gaze is insensitive to target distance and does not fully utilize target width due to the characteristics of saccades and micro-saccades of the eyes. However, its application in steering tasks remains unexplored. Since steering tasks are widely used in VR for menu adjustments and object manipulation, this study examines whether the findings from selection tasks apply to steering tasks. We also model and compare the Steering Law based on eye movement characteristics. To do this, we use data on movement time, average speed, and re-entry count. Our analysis investigates the impact of path width and length on performance. This work proposes three candidate models that incorporate gaze characteristics, which achieve a superior fit (R² > 0.964) compared to the original Steering Law, improving the accuracy of time prediction, AIC, and BIC by 7%, 26%, and 10%, respectively. These models offer valuable insights for game and interface designers who implement gaze-based controls in VR environments.},
keywords = {eye gaze, steering},
}
@misc{bashar2025depth3dsketch,
title = {Depth3DSketch: Freehand Sketching Out of Arm's Reach in Virtual Reality},
author = {Bashar*, Mohammad Raihanul and Amini*, Mohammadreza and Stuerzlinger, Wolfgang and Sarac, Mine and Pfeuffer, Ken and Barrera Machuca, Mayra D. and Batmaz, Anil Ufuk},
booktitle = {Extended Abstracts of the CHI Conference on Human Factors in Computing Systems},
publisher = {ACM},
series = {CHI EA '25},
howpublished = {Extended Abstract},
year = {2025},
month = {Apr},
articleno = {175},
pages = {1-8},
doi = {https://doi.org/10.1145/3706599.3719717},
pdf = {papers/depth3dsketch.pdf},
abstract = {Due to the increasing availability and popularity of virtual reality (VR) systems, 3D sketching applications have also boomed. Most of these applications focus on peripersonal sketching, e.g., within arm's reach. Yet, sketching in larger scenes requires users to walk around the virtual environment while sketching or to change the sketch scale repeatedly. This paper presents Depth3DSketch, a 3D sketching technique that allows users to sketch objects up to 2.5 m away with a freehand sketching technique. Users can select the sketching depth with three interaction methods: using the joystick on a single controller, the intersection from two controllers, or the intersection from the controller ray and the user's gaze. We compared these interaction methods in a user study. Results show that users preferred the joystick to select visual depth, but there was no difference in user accuracy or sketching time between the three methods.},
keywords = {eye gaze, 3D modeling, depth selection},
}
@misc{lu2025designinguiwithaiworkshop,
title = {Designing and Developing User Interfaces with AI: Advancing Tools, Workflows, and Practices},
author = {Lu*, Yuwen and Jiang*, Yue and Knearem, Tiffany and Kliman-Silver, Clara and Lutteroth, Christof and Nichols, Jeffery and Stuerzlinger, Wolfgang},
booktitle = {Extended Abstracts of the CHI Conference on Human Factors in Computing Systems},
publisher = {ACM},
series = {CHI EA '25},
howpublished = {Extended Abstract},
year = {2025},
month = {Apr},
articleno = {774},
pages = {1-7},
doi = {https://doi.org/10.1145/3706599.3706736},
pdf = {papers/designinguiwithaiworkshop25.pdf},
abstract = {Designing and developing user-friendly interfaces has long been a cornerstone of HCI research. However, we are now at a turning point for how user interfaces can be designed and evaluated with new AI-based models and tools. The latest AI models have shown capabilities to model user behaviors, automate end-user tasks, and even generate user interfaces. We are at a pivotal moment to reflect on current UI design and development practices and discuss the opportunities, challenges, and risks brought by AI. Both incremental improvements and transformative opportunities exist for designers, developers, and the hand-off process in between. In this proposed workshop, we encourage participants to envision AI-enabled UI prototyping tools, workflows, and practices. By bringing together academic researchers and industry practitioners, we aim to identify opportunities to enhance prototyping tools and reshape UI creation workflows for the future as well as discuss potential negative consequences of these tools.},
keywords = {GUI, layout, constraints},
}
@misc{lee2025personalizednav,
title = {Towards Personalized Navigation in XR: A User-Centered Approach to Accessibility},
author = {Lee, Jong-In and Stuerzlinger, Wolfgang},
booktitle = {Workshop on Locomotion and Wayfinding in XR, VR Adjunct Proceedings},
publisher = {IEEE},
series = {LocXR '25},
year = {2025},
month = {Mar},
pages = {241-245},
doi = {https://doi.org/10.1109/VRW66409.2025.00059},
pdf = {papers/personalizednav.pdf},
abstract = {Navigation interfaces in Extended Reality (XR) have traditionally targeted universal solutions that perform well for all users. However, research has shown that users exhibit distinct preferences and performance patterns when using different navigation techniques. This position paper argues for the necessity of and strategies for designing personalized navigation interfaces that accommodate individual differences in spatial abilities, navigation strategies, and accessibility needs. Drawing from empirical findings across multiple user studies investigating locomotion and wayfinding techniques and research in spatial cognition and navigation, we demonstrate how different user groups respond uniquely to navigation interface components. Based on these insights, we propose a framework for developing adaptive navigation interfaces that cater to individual user characteristics while maintaining usability. Furthermore, we discuss opportunities for standardization in user assessment, interface adaptation, and accessibility support. This approach could lead to more inclusive and effective navigation solutions for XR environments.},
keywords = {3D navigation, accessibility, virtual reality, augmented reality},
}
@misc{zhao2024barehandposter,
title = {A Novel Bare-Handed and Widget-based Manipulation Technique for Distant Objects in Virtual Reality},
author = {Zhao*, Di Bill and Stuerzlinger, Wolfgang},
booktitle = {ISMAR Adjunct Proceedings},
series = {ISMAR '24},
howpublished = {Poster},
year = {2024},
month = {Oct},
pages = {525-528},
doi = {https://doi.org/10.1109/ISMAR-Adjunct64951.2024.00152},
commented-pdf = {papers/barehandposter.pdf},
commented-teaser = {teasers/barehandposter.png},
abstract = {Recent advancements in bare-hand tracking technology in VR headsets enable intuitive hand interaction for proximate 3D object manipulation. This paper explores two-handed bare-hand interaction for distant 3D objects, by using the non-dominant hand as an interaction surface to enable adept manipulation of a distant 3D object's position and rotation. A user study demonstrated markedly higher precision in complex manipulation tasks compared to traditional methods while maintaining comparable efficiency and accuracy for simpler tasks. Our method also received a good usability rating, illustrating its user-centric and intuitive nature. We discuss insights on error prevention, constraint integration, and consistent interaction for future VR interaction methods.},
keywords = {3D interaction, 3D manipulation, hand tracking},
}
@misc{jiang2024computationaluiworkshop24,
title = {Computational Methodologies for Understanding, Automating, and Evaluating User Interfaces},
author = {Jiang*, Yue and Lu*, Yuwen and Knearem, Tiffany and Kliman-Silver, Clara and Lutteroth, Christof and Li, Toby Jia-Jun and Nichols, Jeffery and Stuerzlinger, Wolfgang},
booktitle = {Extended Abstracts of the CHI Conference on Human Factors in Computing Systems},
publisher = {ACM},
series = {CHI EA '24},
howpublished = {Extended Abstract},
year = {2024},
month = {May},
articleno = {462},
pages = {1-7},
doi = {https://doi.org/10.1145/3613905.3636316},
pdf = {papers/computationaluiworkshop24.pdf},
abstract = {Building on the success of the first two workshops on user interfaces (UIs) at CHI 2022 and CHI 2023, this workshop aims to advance the research field by further exploring current research trends, such as applying large language models and visual language models.
Previous work has explored computational approaches to understand and adapt UIs using constraint-based optimization models and machine learning-based data-driven approaches. In addition to further delving into these established UI research areas, we aim to trigger the exploration into the application of the latest advancements in general-purpose large language and vision-language models within the UI domain.
We will encourage participants to explore novel methods for understanding, automating, and evaluating UIs.
The proposed workshop seeks to bring together academic researchers and industry practitioners interested in computational approaches for UIs to discuss the needs and opportunities for future user interface algorithms, models, and applications.},
keywords = {GUI, layout, constraints},
}
@misc{kasahara2023crossingthroughput,
title = {Throughput and Effective Parameters in Crossing},
author = {Kasahara*, Nobuhito and Oba*, Yosuke and Yamanaka, Shota and Stuerzlinger, Wolfgang and Miyashita, Homei},
booktitle = {Extended Abstracts of the CHI Conference on Human Factors in Computing Systems},
publisher = {ACM},
series = {CHI EA '23},
howpublished = {Extended Abstract},
year = {2023},
month = {Apr},
articleno = {282},
numpages = {9},
doi = {https://doi.org/10.1145/3544549.3585817},
pdf = {papers/crossingthroughput.pdf},
abstract = {In pointing, throughput TP is used as a performance metric for the input device and operator. Based on the calculation of effective parameters (width We and amplitude Ae), TP should be independent of the speed-accuracy tradeoff. To examine the validity of TP and effective parameters for crossing actions, we conducted two experiments using two established crossing tasks. Our results demonstrate that applying effective parameters to Fitts’ law model improves the fit to the data for mixed biases in both tasks. Besides, we observed that effective parameters smoothed TPs across biases. However, unlike pointing, TP was observed to be unstable across IDs in one task, while was stable across IDs in the other task. Analyzing speed profiles showed that this was likely due to the fact that one of the tasks could be completed with a ballistic movement at low IDs, whereas this was impossible for the other task.},
keywords = {throughput, crossing},
}
@misc{mutasim2023repeatedtyping,
title = {Does Repeatedly Typing the Same Phrase Provide a Good Estimate of Expert Text Entry Performance?},
author = {Mutasim*, Aunnoy K and Hudhud Mughrabi+, Moaaz and Batmaz, Anil Ufuk and Stuerzlinger, Wolfgang},
booktitle = {Extended Abstracts of the CHI Conference on Human Factors in Computing Systems},
publisher = {ACM},
series = {CHI EA '23},
howpublished = {Extended Abstract},
year = {2023},
month = {Apr},
articleno = {90},
numpages = {8},
doi = {https://doi.org/10.1145/3544549.3585647},
pdf = {papers/repeatedtyping.pdf},
abstract = {To identify if novel/unfamiliar keyboard layouts like OPTI can outperform QWERTY, lengthy training through longitudinal studies is typically required. To reduce this logistical bottleneck, a popular approach in the literature requires participants to type the same phrase repeatedly. However, it is still unknown whether this approach provides a good estimate of expert performance. To validate this method, we set up a study where participants were tasked with typing the same phrase 96 times for both OPTI and QWERTY. Results showed that this approach has the potential to estimate expert performance for novel/unfamiliar keyboards faster than the traditional approach with different phrases. Yet, we also found that accurate estimates still require training over several days and, therefore, do not eliminate the need for a longitudinal study. Our findings thus show the need for research on faster, easier, and more reliable empirical approaches to evaluate text entry systems.},
keywords = {text entry, touch typing},
}
@misc{hayatpur2023personalspaces,
title = {Designing Collaborative Parsons Problems with Personal-Spaces},
author = {Hayatpur*, Devamardeep and Helfenbaum*, Tehilla and Xia, Haijun and Stuerzlinger, Wolfgang and Gries, Paul},
booktitle = {Extended Abstracts of the CHI Conference on Human Factors in Computing Systems},
publisher = {ACM},
series = {CHI EA '23},
howpublished = {Extended Abstract},
year = {2023},
month = {Apr},
articleno = {263},
numpages = {7},
doi = {https://doi.org/10.1145/3544549.3585630},
pdf = {papers/personalspaces.pdf},
video = {videos/personalspaces.mp4},
teaser = {teasers/personalspaces.png},
abstract = {Pair programming has proven to be a successful pedagogical technique. However, its effectiveness depends on the frequency and quality of communication of the driver. In this work, we explore an alternative collaboration paradigm that tackles the imbalance in pair programming through Parsons problems: students are given fragments of code out of order and tasked with re-organizing them into the correct order. We then create an interdependence between students by assigning each learner to a different sub-problem in their space, termed Personal-spaces. Students must engage in dialog to negotiate, exchange, and use fragments from the same pool. In an exploratory study with nine pairs of undergraduate students, we find evidence pointing to affordances of different coordination conditions: Personal-spaces promoted ownership and engagement, while Turn taking (akin to pair programming) helped maintain a consistent train of thought. We provide guidelines for design of appropriate problem sets and collaboration tools to structure conversations.},
keywords = {pair programming, parsons problems, programming education},
}
@misc{jiang2023futureuiworkshop,
title = {The Future of Computational Approaches for Understanding and Adapting User Interfaces},
author = {Jiang*, Yue and Lu*, Yuwen and Lutteroth, Christof and Li, Toby Jia-Jun and Nichols, Jeffery and Stuerzlinger, Wolfgang},
booktitle = {Extended Abstracts of the CHI Conference on Human Factors in Computing Systems},
publisher = {ACM},
series = {CHI EA '23},
howpublished = {Extended Abstract},
year = {2023},
month = {Apr},
articleno = {367},
numpages = {5},
doi = {https://doi.org/10.1145/3544549.3573805},
pdf = {papers/futureuiworkshop.pdf},
abstract = {Building on the success of the first workshop on understanding, generating, and adapting user interfaces at CHI2022, this workshop will advance this research area further by looking at existing results and exploring new research directions. Computational approaches for user interfaces have been used in adapting interfaces for different devices, modalities, and user preferences. Recent work has made significant progress in understanding and adapting user interfaces with traditional constraint/rule-based optimization and machine learning-based data-driven approaches; however, these two approaches remain separate. Combining the two approaches has great potential to advance the area but remains under-explored and challenging. Other contributions, such as datasets for potential applications, novel representations of user interfaces, the analysis of human traces, and models with multi-modalities, will also open up future research options. The proposed workshop seeks to bring together researchers interested in computational approaches for user interfaces to discuss the needs and opportunities for future user interface algorithms, models, and applications.},
keywords = {GUI, layout, constraints},
}
@misc{hudhud23effectiveehct,
title = {On the Effectiveness of Virtual Eye-Hand Coordination Training with Head Mounted Displays},
author = {Hudhud Mughrabi+, Moaaz and Kaya+, Furkan and Batmaz, Anil Ufuk and Aliza*, Aliza and Stuerzlinger, Wolfgang and Borazan+, Baris and Tonyali+, Emir and Sarac, Mine},
booktitle = {Workshop on 3D Content Creation for Simulated Training in eXtended Reality, VR Adjunct Proceedings},
publisher = {IEEE},
series = {TrainingXR '23},
year = {2023},
month = {Mar},
numpages = {8},
doi = {https://doi.org/10.1109/VRW58643.2023.00014},
pdf = {papers/effectiveehct.pdf},
abstract = {Eye-hand coordination training systems are used to train participants' motor skills and visual perception. Such systems have already been tested in Virtual Reality, and the results revealed that Head Mounted Displays have the potential to improve the motor training. However, this was only investigated in an hour-long study. In the longitudinal study reported here, we analyzed the motor performance of three participants in ten sessions with three different assessment criteria, where participants were instructed to focus on speed, error rate, or complete the training freely (with no instructions). We also assessed the effective throughput performance of the participants. Our results indicate that participants focusing on speed might need less number of learning sessions. We hope that our results will help practitioners and developers design efficient Virtual Reality training systems.},
keywords = {3D pointing, gaze tracking, eye-hand coordination},
}
@misc{taylor2022litports,
title = {LitPorts: On-demand Illuminated Ports to Facilitate Inter-device Connections in Low-light Conditions},
author = {Taylor*, Tiffany E. and Stuerzlinger, Wolfgang},
booktitle = {Australian Conference on Human-Computer Interaction},
series = {OzCHI '22},
howpublished = {Late-Breaking Work},
year = {2022},
month = {Nov},
pages = {51-57},
doi = {https://doi.org/10.1145/3572921.3572932},
commented-url = {http://www.ozchi.org/2022/poster_lbw1027.html},
pdf = {papers/litports.pdf},
video = {videos/litports.mp4},
teaser = {teasers/litports.png},
abstract = {Plugging a cable or peripheral into a device is an integral aspect of daily use of computing devices for most users. Yet, in low-light or constrained-visibility conditions the simple act of finding the receptacle to connect the cable to can be challenging and lead to user frustration. To alleviate this frustration we present LitPorts, a technology that illuminates receptacles in low-light conditions when a compatible plug is in proximity, making plugging a cable in substantially easier leading to a better all-around user experience. We also present user feedback from our prototype testing demonstrating the broad appeal and applicability of LitPorts.},
keywords = {device connectivity, ports, receptacles, illumination},
}
@misc{rajabiseraji2022xvcollab,
title = {XVCollab: An Immersive Analytics Tool for Asymmetric Collaboration across the Virtuality Spectrum},
author = {Rajabi Seraji*, Mohammad and Stuerzlinger, Wolfgang},
booktitle = {Workshop on Visual Analytics in Immersive Environments, ISMAR Adjunct Proceedings},
series = {VAinIE '22},
year = {2022},
month = {Oct},
pages = {146-154},
doi = {https://doi.org/10.1109/ISMAR-Adjunct57072.2022.00035},
pdf = {papers/xvcollab.pdf},
teaser = {teasers/xvcollab.png},
abstract = {Research has shown that when a group of people collaborate in decision-making scenarios, they can be more effective than when they work alone. Studies also show that in a data analytics context, using immersive technologies could make users perform better in data understanding, pattern recognition, and finding connections. In this work, we are leveraging previous knowledge in Collaborative Immersive Analytics (CIA) and Cross-virtuality Analytics (XVA) to develop an asymmetric system that enables two groups from different places on the Virtuality-Reality spectrum to simultaneously work on analyzing data. We divide users into two groups: the non-immersive desktop group and the immersive AR group. These two groups can both author and modify visualizations in their virtuality and share it with the other group when they see fit. For this, we designed a non-interruptive interface for both groups to transform a visualization from non-immersive 2D to immersive AR and vice-versa. We also provide multiple awareness cues in the system that keep either group aware of the other and their actions. We designed these features to boost user performance and ease of use in a collaborative setting and incentivize them to rely on the other group for visualization tasks that are difficult to perform on their end of the virtuality spectrum. Our limited pilot study shows that users find the system engaging, easy to use, and helpful in their data-understanding journey within the collaborative context. Going forward, we plan to conduct more rigorous studies to verify our claims and explore other research questions on this topic.},
keywords = {immersive analytics, cross-reality, augmented reality, collaboration},
}
@misc{rajabiseraji2022hybridaxes,
title = {HybridAxes: An Immersive Analytics Tool With Interoperability Between 2D and Immersive Reality Modes},
author = {Rajabi Seraji*, Mohammad and Stuerzlinger, Wolfgang},
booktitle = {Workshop on Prototyping Cross-Reality Systems, ISMAR Adjunct Proceedings},
series = {PCRS '22},
year = {2022},
month = {Oct},
pages = {155-160},
doi = {https://doi.org/10.1109/ISMAR-Adjunct57072.2022.00036},
pdf = {papers/hybridaxes.pdf},
teaser = {teasers/hybridaxes.png},
abstract = {Throughout the visual analytics process, users create visualizations with different dimensionalities. Research shows that in this process users benefit from being able to simultaneously see 2D and 3D modes of their data visualizations. Towards supporting this potential need, we introduce HybridAxes, an immersive visual analytics tool that allows the users to conduct their analysis at either end of the reality spectrum - either in 2D on desktop monitors or 3D in an immersive AR/VR environment - while enabling them to seamlessly switch between the two modes. We believe that by using our system, users will find it easier and faster to understand and analyze multi-dimensional data. An initial pilot test indicates positive trends in terms of users' performance time and usability metrics compared to the standalone desktop or XR counterparts. Our preliminary results also suggest that users experience a lower cognitive load while task-switching between these reality modes. This reduction in mental effort causes them to perceive the system to be unobtrusive and pleasant to work with. Going forward, we plan to conduct more rigorous studies to verify our claims and to explore other research questions on this topic.},
keywords = {immersive analytics, cross-reality, augmented reality},
}
@misc{bao2022errorsspeechtranscription,
title = {The Effects of Errors in Speech Transcription: A User Study},
author = {Bao*, Tianyi Vera and Ahmed+, Afshan and Stuerzlinger, Wolfgang},
booktitle = {TEXT2030: Shaping Text Entry Research in 2030, Workshop at MobileHCI '22},
commented-publisher = {ACM},
series = {TEXT '22},
year = {2022},
month = {Oct},
numpages = {6},
pdf = {papers/respeak.pdf},
url = {http://text2030.textentry.org.uk/papers/6.pdf},
abstract = {This paper investigates how errors that occur during speech recognition affect users’ text entry performance. To study this, we implemented a speech recognition system that injects believable errors in a controlled manner. In our user study, participants were asked to transcribe a set of phrases using our speech recognition system, either with or without the insertion of errors. The results show that inducing 33% errors in a speech-based transcription task does not seem to affect users’ performance and experience in a significant manner. Yet, according to participants’ interview responses, our result might have been caused by the phrase set we used in the study. Our work thus motivates future research to develop a phrase set more suitable for speech-based transcription tasks.},
keywords = {text entry, speech recognition, errors},
}
@misc{kneifel2022autocorrectpersonality,
title = {Effects of Personality Type on Trust in Autocorrect and Preferences},
author = {Kneifel*, Johanna and Spaeth, Dominic and Stuerzlinger, Wolfgang},
booktitle = {TEXT2030: Shaping Text Entry Research in 2030, Workshop at MobileHCI '22},
commented-publisher = {ACM},
series = {TEXT '22},
year = {2022},
month = {Oct},
numpages = {6},
pdf = {papers/autocorrectpersonality.pdf},
url = {http://text2030.textentry.org.uk/papers/3.pdf},
abstract = {User acceptance of a given feature depends upon its perceived trustworthiness. Despite imperfections, trust seems to be evenly split for autocorrect. In this study, we use the Big Five personality test and text entry tasks to investigate the effect of users’ personality type on their trust in autocorrect when encountering autocorrect errors. Results indicate that individuals ranking higher in neuroticism distrust autocorrect more. Our qualitative observations showed frustrated behaviors for autocorrect errors during the text entry tasks. Half of our participants reporting distrust in autocorrect still had the feature on. The results lend insights into connections between personality type and preferred text-based communication methods, which needs to be investigated further in future work.},
keywords = {text entry, autocorrect, trust, personality, errors},
}
@misc{kneifel2022speechvstyping,
title = {Speech Recognition Versus Typing: A Mixed-Methods Evaluation},
author = {Kneifel*, Johanna and Alharbi, Ohoud and Stuerzlinger, Wolfgang},
booktitle = {TEXT2030: Shaping Text Entry Research in 2030, Workshop at MobileHCI '22},
commented-publisher = {ACM},
series = {TEXT '22},
year = {2022},
month = {Oct},
numpages = {7},
pdf = {papers/speechvstyping.pdf},
url = {http://text2030.textentry.org.uk/papers/4.pdf},
abstract = {Mobile text entry has become a main mode of communication. To make text entry as efficient as possible, helpful features, such as autocorrect and speech recognition have been developed. In our study, we confirmed previous work in that speech recognition was faster, while the error rate for typing was lower. To analyze this in more depth, we performed semi-structured interviews about participants’ text-entry preferences, specific pain points that occur, and potential suggestions for improving the editing experience.},
keywords = {text entry, speech recognition, errors},
}
@misc{lee2022multiscalenavposter,
title = {A Comparison of Zoom-In Transition Methods for Multiscale VR},
author = {Lee*, Jong-In and Asente, Paul and Stuerzlinger, Wolfgang},
booktitle = {SIGGRAPH 2022 Posters},
publisher = {ACM},
series = {SIGGRAPH '22},
howpublished = {Poster},
year = {2022},
month = {Aug},
articleno = {22},
numpages = {2},
doi = {https://doi.org/10.1145/3532719.3543237},
pdf = {papers/zoomintransition.pdf},
abstract = {When navigating within an unfamiliar virtual environment in virtual reality, transitions between pre-defined viewpoints are known to facilitate spatial awareness of a user. In the past, different viewpoint transition techniques had been investigated in VR 3D UI research, but mainly for single-scale environments. We present a comparative study of zoom-in transition techniques, where the viewpoint of a user is being smoothly transitioned from a large level of scale (LoS) to a smaller LoS in a multiscale virtual environment (MVE) with a nested structure. We identify that orbiting first before zooming in is preferred over other alternatives when transitioning to a viewpoint at a small LoS.},
keywords = {3D navigation, multiscale virtual environment, viewpoint transition},
}
@misc{kaya2022depthrole,
title = {The Role of the Depth Dimension in 3D Visualizations for Dense Data Understanding},
author = {Kaya+, Furkan and Batmaz, Anil Ufuk and Mutasim*, Aunnoy K and Stuerzlinger, Wolfgang},
booktitle = {European Conference on Visual Perception},
commented-publisher = {Sage},
series = {ECVP '22},
howpublished = {Abstract},
year = {2022},
month = {Aug},
pages = {183-184},
doi = {https://doi.org/10.1177/03010066221141167},
abstract = {Visual attributes, such as size, shape, or colour, play a crucial role in the interpretation of data visualizations and can be used to represent the data at different scales. On 2D displays, human viewers then perceive the differences between scales based on such visual attributes. While it can be challenging for human to interpret data in dense visualizations in 2D, the additional depth dimension offered by 3D could make some aspects of data more visible.
To analyze the potential impact of depth perception on dense data visualization, we developed a novel visualization method and visualized dense COVID-19 time-series data of four European countries (France, Germany, United Kingdom, and Turkey). In our novel visualization, we aimed to increase the visibility of individual data points to ease visual perception and visualized daily total cases in the depth dimension.
We conducted a user study with 20 participants where we compared a conventional 2D visualization with the proposed novel 3D visualization method for COVID-19 data.
The results show that the novel 3D visualization method facilitated understanding of the complexity of COVID-19 case data and decreased misinterpretations by 40%. Overall, 13 out of 20 participants preferred to see the COVID-19 data with the proposed method. Participants’ comments on the novel visualization method revealed that the increased visibility of individual data points decreases the cognitive load of the participants, which might explain the outcome.
The results of our work identify that the depth dimension offered by 3D visualizations can assist users in understanding dense data.},
keywords = {3D visualization, perception},
}
@misc{dunlop2022textworkshop,
title = {TEXT2030 - Shaping Text Entry Research in 2030},
author = {Dunlop, Mark and Stuerzlinger, Wolfgang and Arif, Ahmed Sabbir and Alharbi, Ohoud and Komninos, Andreas},
booktitle = {International Conference on Human-Computer Interaction with Mobile Devices and Services},
publisher = {ACM},
series = {MobileHCI '22},
howpublished = {Workshop Abstract},
year = {2022},
month = {Sep},
articleno = {3},
numpages = {4},
doi = {https://doi.org/10.1145/3528575.3551429},
pdf = {papers/text2030ws.pdf},
url = {http://text2030.textentry.org.uk},
abstract = {We propose a workshop on the theme of ubiquitous text entry research. Our aim is to address the methodological challenges arising from several decades of experience in this research community. We hope to solicit views, experiences and ideas from researchers across a range of backgrounds, with a view to formulate concrete action plans to move community practices into a strengthened position by 2030.},
keywords = {text entry, methodological challenges},
}
@misc{jiang2022computationaluiworkshop,
title = {Computational Approaches for Understanding, Generating, and Adapting User Interfaces},
author = {Jiang*, Yue and Lu*, Yuwen and Nichols, Jeffery and Stuerzlinger, Wolfgang and Yu, Chun and Lutteroth, Christof and Li, Yang and Kumar, Ranjitha and Li, Toby Jia-Jun},
booktitle = {Extended Abstracts of the CHI Conference on Human Factors in Computing Systems},
publisher = {ACM},
series = {CHI EA '22},
howpublished = {Extended Abstract},
year = {2022},
month = {May},
articleno = {74},
numpages = {6},
doi = {https://doi.org/10.1145/3491101.3504030},
pdf = {papers/computationaluiworkshop.pdf},
abstract = {Computational approaches for user interfaces have been used in adapting interfaces for different modalities, usage scenarios and device form factors, understanding screen semantics for accessibility, task-automation, information extraction, and in assisting interface design. Recent advances in machine learning (ML) have drawn considerable attention across HCI and related fields such as computer vision and natural language processing, leading to new ML-based user interface approaches. Similarly, significant progress has been made with more traditional optimization- and planning-based approaches to accommodate the need for adapting UIs for screens with different sizes, orientations and aspect ratios, and in emerging domains such as VR/AR and 3D interfaces. The proposed workshop seeks to bring together researchers interested in all kinds of computational approaches for user interfaces across different sectors as a community, including those who develop algorithms and models and those who build applications, to discuss common issues including the need for resources, opportunities for new applications, design implications for human-AI interaction in this domain, and practical challenges such as user privacy.},
keywords = {GUI, layout, constraints},
}
@misc{batmaz2021year1covid,
title = {Researchers’ and Participants’ Experiences on Distributed User Studies Conducted in the First Year of COVID-19 Pandemic},
author = {Batmaz, Anil Ufuk and Mifsud*, Domenick and Steed, Anthony and Stuerzlinger, Wolfgang and Ortega, Francisco},
booktitle = {First XR Remote Research Workshop at CHI '21},
year = {2021},
month = {May},
numpages = {3},
pdf = {papers/covidyear1ws.pdf},
url = {http://www.mat.qmul.ac.uk/xr-chi-2021},
abstract = {COVID-19 has raised significant challenges to the conduct of Virtual Reality (VR) and Augmented Reality (AR) studies. Previously, most VR and AR academic research happened in research labs at universities, where the experiments were conducted in controlled environments with specific installations and instrumentation. With the ongoing pandemic, many VR/AR researchers switched by necessity to distributed studies, where the participants participate in the studies from their own living or working spaces. This change created novel challenges for participants and experimenters. In this paper, we report some experiences with VR/AR studies conducted in the first year of COVID-19 and present recommendations for future, distributed VR/AR studies.},
keywords = {3D user interfaces, COVID-19, extended reality, virtual reality, augmented reality},
}
@misc{malekmakan2020analyzing,
title = {Analyzing the Trade-off between Selection and Navigation in VR},
author = {Malekmakan*, Morteza and Stuerzlinger, Wolfgang and Riecke, Bernhard},
booktitle = {26th Symposium on Virtual Reality Software and Technology},
publisher = {ACM},
series = {VRST '20},
howpublished = {Poster},
year = {2020},
month = {Nov},
articleno = {42},
numpages = {3},
doi = {https://doi.org/10.1145/3385956.3422123},
pdf = {papers/navseltradeoffposter.pdf},
video = {https://www.youtube.com/watch?v=8w53gKhPjWs},
abstract = {Navigation and selection are critical in very large virtual environments, such as a model of a whole city. In practice, many VR applications require both of these modalities to work together. We compare different combinations of two navigation and two selection methods in VR on selection tasks involving distant targets in a user study. The aim of our work is to discover the trade-off between navigation and selection techniques and to identify which combination leads to better interaction performance in large virtual environments. The results showed that users could complete the task faster with the fly/drive method and traveled less, compared to the teleportation method. Additionally, raycasting exhibited a better performance in terms of time and (less) distance traveled, however, it significantly increased the error rate for the selection of targets.},
keywords = {3D pointing, 3D navigation},
}
@misc{wagner2020designing,
title = {Designing Efficient Immersive Analytics Environments for Spatio-Temporal Data},
author = {Wagner Filho*, Jorge and Stuerzlinger, Wolfgang and Nedel, Luciana},
booktitle = {SIBGRAPI Workshop on Visual Analytics, Information Visualization and Scientific Visualization},
series = {WVIS '20},
howpublished = {Abstract},
year = {2020},
month = {Oct},
numpages = {1},
abstract = {The ever-growing amount of human movement data challenges us to develop new visualization techniques and to revisit existing ones with different perspectives. Traditional 2D movement visualizations focus either on the spatial or temporal aspects of the data, potentially hindering the observation of relevant features. Emerging Immersive Analytics approaches offer the opportunity to revisit a three-dimensional visualization that allows the integrated analysis of both. With the aid of stereoscopic virtual reality and 3D user interfaces, an immersive Space-Time Cube might overcome challenges that limited its adoption in the past. In this talk, we will present an overview of our ongoing research on this immersive representation, preliminary insights obtained with different navigation and interaction approaches, and our next planned steps.},
keywords = {visual analytics, immersive analytics, space-time cube, 3D visualization},
}
@misc{wagner2020visualizing,
title = {Visualizing Movement Trajectories in an Immersive Space Time-Cube},
author = {Wagner Filho*, Jorge and Stuerzlinger, Wolfgang and Nedel, Luciana},
booktitle = {VIS 2020 Workshop on Information Visualization of Geospatial Networks, Flows and Movement},
publisher = {IEEE},
series = {MoVis '20},
howpublished = {Extended Abstract},
year = {2020},
month = {Oct},
numpages = {3},
abstract = {The ever-growing amount of human movement data challenges us to develop new visualization techniques and to revisit existing ones with different perspectives. Traditional 2D movement visualizations focus either on the spatial or temporal aspects of the data, potentially hindering the observation of relevant features. Emerging Immersive Analytics approaches offer the opportunity to revisit a three-dimensional visualization that allows the integrated analysis of both. With the aid of stereoscopic virtual reality and 3D user interfaces, an immersive Space-Time Cube might overcome challenges that limited its adoption in the past. In this paper, we provide an overview of the results obtained in our ongoing research on this immersive representation. We also discuss insights obtained with different navigation and interaction approaches, and our next planned steps.},
keywords = {visual analytics, immersive analytics, space-time cube, 3D visualization},
}
@comment{c, c={currently commented out. If the corresponding journal article goes converts to misc, I might put this back in}}
@comment{steed2020covidblog,
author = {Steed, Anthony and Ortega, Francisco and Williams, Adam and Kruijff, Ernst and Stuerzlinger, Wolfgang and Batmaz, Anil Ufuk and Won, Andrea and Suma Rosenberg, Evan and Simeone, Adalberto and Hayes, Aleshia},
title = {Evaluating Immersive Experiences During COVID-19 and Beyond},
booktitle = {Interactions Blog},
month = {May},
year = {2020},
url = {http://interactions.acm.org/blog/view/enlightenment-by-lesson-},
howpublished = {Blog entry},
keywords = {3D user interfaces},
}
@misc{batmaz2020effect,
title = {Effect of Fixed and Infinite Ray Length on Distal {3D} Pointing in Virtual Reality},
author = {Batmaz, Anil Ufuk and Stuerzlinger, Wolfgang},
booktitle = {Extended Abstracts of the CHI Conference on Human Factors in Computing Systems},
publisher = {ACM},
series = {CHI EA '20},
howpublished = {Extended Abstract},
year = {2020},
month = {Apr},
numpages = {10},
doi = {https://doi.org/10.1145/3334480.3382796},
pdf = {papers/raylength.pdf},
abstract = {Ray casting is frequently used to point and select distant targets in Virtual Reality (VR) systems. In this work, we evaluate user performance in 3D pointing with two different ray casting versions: infinite ray casting, where the cursor is positioned on the surface of the first object along the ray that said ray points at, and finite ray-casting, where the cursor is attached to the ray at a fixed distance from the controller. Twelve subjects performed a Fitts' law experiment where the targets were placed 1, 2, or 3 meters away from the user. According to the results, subjects were faster and made fewer errors with the infinite ray length. Interestingly, their (effective) pointing throughput was higher when the ray length was constrained. We illustrate the advantages of both methods in immersive VR applications and provide information for practitioners and developers to choose the most appropriate ray-casting-based selection method for VR.},
keywords = {3D pointing, mid-air},
}
@misc{mutazim2020gaze,
title = {Gaze Tracking for Eye-Hand Coordination Training Systems in Virtual Reality},
author = {Mutasim*, Aunnoy K. and Stuerzlinger, Wolfgang and Batmaz, Anil Ufuk},
booktitle = {Extended Abstracts of the CHI Conference on Human Factors in Computing Systems},
publisher = {ACM},
series = {CHI EA '20},
howpublished = {Extended Abstract},
year = {2020},
month = {Apr},
numpages = {9},
doi = {https://doi.org/10.1145/3334480.3382924},
pdf = {papers/gazesportstrain.pdf},
abstract = {Eye-hand coordination training systems are used to improve user performance during fast movements in sports training. In this work, we explored gaze tracking in a Virtual Reality (VR) sports training system with a VR headset. Twelve subjects performed a pointing study with or without passive haptic feedback. Results showed that subjects spent an average of 0.55 s to visually find and another 0.25 s before their finger selected a target. We also identified that, passive haptic feedback did not increase the performance of the user. Moreover, gaze tracker accuracy significantly deteriorated when subjects looked below their eye level. Our results also point out that practitioners/trainers should focus on reducing the time spent on searching for the next target to improve their performance through VR eye-hand coordination training systems. We believe that current VR eye-hand coordination training systems are ready to be evaluated with athletes.},
keywords = {3D pointing, gaze tracking, eye-hand coordination},
}
@misc{murad2019,
title = {Effects of WER on ASR Correction Interfaces for Mobile Text Entry},
author = {Murad*, Christine and Munteanu, Cosmin and Stuerzlinger, Wolfgang},
booktitle = {International Conference on Human-Computer Interaction with Mobile Devices and Services},
publisher = {ACM},
series = {MobileHCI '19},
howpublished = {Poster},
year = {2019},
month = {Oct},
articleno = {56},
numpages = {6},
doi = {https://doi.org/10.1145/3338286.3344404},
pdf = {papers/speecheffect.pdf},
abstract = {Speech is increasingly being used as a method for text entry, especially on commercial mobile devices such as smartphones. While automatic speech recognition has seen great advances, factors like acoustic noise, differences in language or accents can affect the accuracy of speech dictation for mobile text entry. There has been some research on interfaces that enable users to intervene in the process, by correcting speech recognition errors. However, there is currently little research that investigates the effect of Automatic Speech Recognition (ASR) metrics, such as word error rate, on human performance and usability of speech recognition correction interfaces for mobile devices. This research explores how word error rates affect the usability and usefulness of touch-based speech recognition correction interfaces in the context of mobile device text entry.},
keywords = {speech recognition, text entry, errors},
}
@misc{batmaz2019effect,
title = {The Effect of Rotational Jitter on {3D} Pointing Tasks},
author = {Batmaz, Anil Ufuk and Stuerzlinger, Wolfgang},
booktitle = {Extended Abstracts of the CHI Conference on Human Factors in Computing Systems},
publisher = {ACM},
series = {CHI EA '19},
howpublished = {Extended Abstract},
year = {2019},
month = {May},
articleno = {LBW2112},
numpages = {6},
doi = {https://doi.org/10.1145/3290607.3312752},
pdf = {papers/rotjitterpointing.pdf},
abstract = {Even when in a static position, data acquired from 6 Degrees of Freedom (DoF) trackers is affected by noise, which is typically called jitter. In this study, we analyzed the effects of 3D rotational jitter on Virtual Reality (VR) controllers in a 3D Fitts' law experiment, which explored how such jitter affects user performance. Eight subjects performed a Fitts' law experiment with or without additional jitter on the cursor. Results show that while error rate significantly increased above ±0.5° jitter and subjects' effective throughput started to decrease significantly above ±1° jitter, there was no significant effect on users' movement time. Further, the Fitts's law movement time model was affected when ±2° jitter was applied to the tracker. According to these results, ±0.5° jitter on the controller does not significantly affect user performance for the tasks explored here. The results of our study can guide the design of 3D controller and tracking systems for 3D user interfaces.},
keywords = {3D pointing, jitter},
}
@misc{mutasim2019detection,
title = {Detection of Error Potentials using the Muse Headband},
author = {Mutasim*, Aunnoy K. and Stuerzlinger, Wolfgang},
booktitle = {EMBS Conference On Neural Engineering},
publisher = {IEEE},
series = {NER '19},
howpublished = {Poster},
year = {2019},
month = {Mar},
articleno = {FrPO.120},
numpages = {1},
abstract = {The detection of Error Potentials (ErrPs) has found promising applications in both neurophysiological and brain-computer interface (BCI) domains. However, the EEG acquisition devices used in such studies are mostly medical-grade and therefore expensive. Here, we propose to detect ErrPs using the cost-effective Muse headband.},
keywords = {EEG, errors},
}
@misc{nguyenvo2018actual,
title = {Do We Need Actual Walking in VR? Leaning with Actual Rotation Might Suffice for Efficient Locomotion},
author = {Nguyen-Vo*, Thinh and Pham*, Duc-Minh and Riecke, Bernhard E. and Stuerzlinger, Wolfgang and Kruijff, Ernst},
booktitle = {Spatial Cognition},
series = {SC '18},
howpublished = {Poster},
year = {2018},
month = {Sep},
abstract = {Walking has always been the most common locomotion mode for humans in the real world. For this reason, walking has also been considered as the ideal condition in a large body of VR research involving navigation. Physical walking provides body-based sensory information about both the translational and rotational components of locomotion. Though the rotational body-based information has been shown to be important for several spatial tasks, the benefit of the translational component is still unclear with mixed results from previous studies. In this study, we aim to investigate how much translational body-based sensory information is required for people to efficiently navigate the virtual world, given full rotational information. Depending on the locomotion interface used, more or less translational body-based information might be provided at different levels of accuracy. The current mixed method study investigated how different levels of translational body-based information might influence the performance of participants in a navigational search task in a HMD-based virtual environment. Participants were asked to find eight balls hidden in 16 target boxes randomly positioned in a two-meter radius circular area. To check whether there is a ball inside a target box, participants must stand right in front of the box within 0.80 meter and look at it. If there is a ball, they can collect it by touching the ball with a wand controller. The environment has been designed not to provide any additional orientation cue other than the optic flow from the fireflies. Participants could not see targets farther than two meter from them. In other words, they were not able to see all targets at a time, hence, they had to build up their spatial awareness gradually along with their locomotion. In this within-subject experiment, there were four levels of translational body-based information: none (participants used the trackpad of an HTC Vive wand controller to visually translate), upper-body leaning (participants sitting on a Swopper chair, used their upper-body leaning to control their visual translation), whole-body leaning (participants standing on a platform called NaviBoard, used their whole body leaning or stepping to navigate the virtual environment), and actual walking (participants physically walk with a wireless HMD on). Every participant performed a navigational search task once in every condition in a counter-balance order. All 24 participants finished all four trials (even with more or less fatigue). Results showed that locomotion mode had significant effects on various measures including task performance, task load, and simulator sickness. While participants performed significantly worse when they used joystick-based interface with no body-based information, compared to the other conditions, there was no significant difference between leaning-based interfaces and actual walking. More data in other measures are still in need for a more concrete conclusion. However, current results also suggested that body-based information from a leaning-based interface might suffice for a cost-effective alternative to actual walking in spatial cognition research and applications in VR.},
keywords = {3D navigation},
}
@misc{zaman2018gemniplus,
title = {{GEM-NI}+: Leveraging Difference Visualization and Multiple Displays for Supporting Multiple Complex Generative Design Alternatives},
author = {Zaman, Loutfouz and Neugebauer+, Christian and Stuerzlinger, Wolfgang and Woodbury, Robert},
booktitle = {Extended Abstracts of the CHI Conference on Human Factors in Computing Systems},
publisher = {ACM},
series = {CHI EA '18},
howpublished = {Extended Abstract},
year = {2018},
month = {Apr},
articleno = {LBW106},
numpages = {6},
doi = {https://doi.org/10.1145/3170427.3188593},
pdf = {papers/gem-ni+.pdf},
abstract = {In the conceptual design phase, designers routinely generate dozens of alternatives based on a single idea. This is especially relevant in generative design where an algorithm can generate a large number of viable design options. While solutions for creating and managing a small number of simple alternatives have been proposed, practical applications of these solutions are liMassachusetts Institute of Technologyed. As a result, we present GEM-NI+, an extension to the original GEM-NI system for creating and managing alternatives in generative design. GEM-NI+ is designed to enable editing, managing and comparing up to 24 alternatives simultaneously using a multi-monitor setup. GEM-NI+ also features a new "jamming spaces" technique for assigning individual monitors into different visualization states, which makes organization of a large workspace easier. Finally, GEM-NI+ enables comparison of complex alternatives using recursive group node difference visualization.},
keywords = {alternatives, design},
}
@misc{machuca2018stereo,
title = {Do Stereo Display Deficiencies Affect {3D} Pointing?},
author = {Barrera Machuca*, Mayra D. and Stuerzlinger, Wolfgang},
booktitle = {Extended Abstracts of the CHI Conference on Human Factors in Computing Systems},
publisher = {ACM},
series = {CHI EA '18},
howpublished = {Extended Abstract},
year = {2018},
month = {Apr},
articleno = {LBW126},
numpages = {6},
doi = {https://doi.org/10.1145/3170427.3188540},
abstract = {Previous work has documented that limitations of current stereo display systems affect depth perception. We performed an experiment to understand if such stereo display deficiencies affect 3D pointing for targets in front of a screen and close to the user, i.e., in peri-personal space. Our experiment compares isolated movements with and without a change in visual depth for virtual targets. Results indicate that selecting targets along the depth axis is slower and has less throughput than laterally positioned targets.},
keywords = {3D pointing, mid-air, stereo},
}
@misc{hashemian2018investigating,
title = {Investigating a Sparse Peripheral Display in a Head-Mounted Display for VR Locomotion},
author = {Hashemian*, Abraham and Kitson*, Alexandra and Nguyen-Vo*, Thinh and Benko, Hrvoje and Stuerzlinger, Wolfgang and Riecke, Bernhard E.},
booktitle = {Conference on Virtual Reality and {3D} User Interfaces},
publisher = {IEEE},
series = {VR '18},
howpublished = {Poster},
year = {2018},
month = {Mar},
pages = {571-572},
doi = {https://doi.org/10.1109/VR.2018.8446345},
abstract = {Head-Mounted Displays (HMDs) provide immersive experiences for virtual reality. However, their field of view (FOV) is still relatively small compared to the human eye, which adding sparse peripheral displays (SPDs) could address. We designed a new SPD, SparseLightVR2, which increases the HMD's FOV to 180° horizontally. We evaluated SparseLightVR2 with a study (N=29) by comparing three conditions: 1) no SPD, where the peripheral display (PD) was inactive; 2) extended SPD, where the PD provided visual cues consistent with and extending the HMD's main screen; and 3) counter-vection SPD, where the PD's visuals were flipped horizontally during VR travel to provide optic flow in the opposite direction of the travel. The participants experienced passive motion on a linear path and reported introspective measures such as sensation of self-motion. Results showed, compared to no SPD, both extended and counter-vection SPDs provided a more natural experience of motion, while extended SPD also enhanced vection intensity and believability of movement. Yet, visually induced motion sickness (VIMS) was not affected by display condition. To investigate the reason behind these non-significant results, we conducted a follow-up study and had users increase peripheral counter-vection visuals on the central HMD screen until they nulled out vection. Our results suggest extending HMDs through SPDs enhanced vection, naturalness, and believability of movement without enhancing VIMS, but reversed SPD motion cues might not be strong enough to reduce vection and VIMS.},
keywords = {3D navigation},
}
@misc{sun2018selecting,
title = {Selecting Invisible Objects},
author = {Sun*, Junwei and Stuerzlinger, Wolfgang},
booktitle = {Conference on Virtual Reality and {3D} User Interfaces},
publisher = {IEEE},
series = {VR '18},
howpublished = {Poster},
year = {2018},
month = {Mar},
pages = {697-698},
doi = {https://doi.org/10.1109/VR.2018.8446199},
abstract = {We augment 3D user interfaces with a new technique that enables users to select objects that are invisible from the current viewpoint. We present a layer-based method for selecting invisible objects, which works for arbitrary objects and scenes. The user study shows that with our new techniques users can easily select hidden objects.},
keywords = {3D positioning, transparency},
}
@misc{machuca2017multiplanes,
title = {Multiplanes: Assisted Freehand VR Drawing},
author = {Barrera Machuca*, Mayra D. and Asente, Paul and Lu*, Jingwan and Kim, Byungmoon and Stuerzlinger, Wolfgang},
booktitle = {Adjunct Publication of the 30th Annual ACM Symposium on User Interface Software and Technology},
publisher = {ACM},
series = {UIST '17},
howpublished = {Demonstration},
year = {2017},
month = {Oct},
pages = {1-3},
doi = {https://doi.org/10.1145/3131785.3131794},
abstract = {Multiplanes is a virtual reality (VR) drawing system that provides users with the flexibility of freehand drawing and the ability to draw perfect shapes. Through the combination of both beautified and 2D drawing, Multiplanes addresses challenges in creating 3D VR drawings. To achieve this, the system beautifies user's strokes based on the most probable, intended shapes while the user is drawing them. It also automatically generates snapping planes and beautification trigger points based on previous and current strokes and the current controller pose. Based on geometrical relationships to previous strokes, beautification trigger points act as guides inside the virtual environment. Users can hit these points to (explicitly) trigger a stroke beautification. In contrast to other systems, when using Multiplanes, users do not need to manually set or do any kind of special gesture to activate, such guides allowing the user to focus on the creative process.},
keywords = {3D sketching, 3D drawing, 3D modeling, 3D user interfaces},
}
@misc{machuca2018fluidvr,
title = {Fluid VR: Extended Object Associations for Automatic Mode Switching in Virtual Reality},
author = {Barrera Machuca*, Mayra D. and Sun*, Junwei and Pham*, Duc-Minh and Stuerzlinger, Wolfgang},
booktitle = {Conference on Virtual Reality and {3D} User Interfaces},
publisher = {IEEE},
series = {3DUI '18},
howpublished = {3DUI contest entry},
year = {2018},
month = {Mar},
pages = {846-847},
doi = {https://doi.org/10.1109/VR.2018.8446437},
abstract = {Constrained interaction and navigation methods for virtual reality reduce the complexity of the interaction. Yet, with previously presented solutions, users need to learn new interaction tools or remember different actions for changing between different interaction methods. In this paper, we propose Fluid VR, a new 3D user interface for interactive virtual environments that lets users seamlessly transition between navigation and selection. Based on the selected object's properties, Fluid VR applies specific constraints to the interaction or navigation associated with the object. This way users have a better control of their actions, without having to change tools or activate different modes of interaction.},
keywords = {3D manipulation},
}
@misc{nguyenvo2017investigating,
title = {Investigating the Effect of Simulated Reference Frames on Spatial Orientation in Virtual Reality},
author = {Nguyen-Vo*, Thinh and Riecke, Bernhard E. and Stuerzlinger, Wolfgang},
booktitle = {Second Workshop on Models and Representations in Spatial Cognition},
series = {SC '17},
howpublished = {Poster},
year = {2017},
month = {Apr},
url = {https://osf.io/bs5ug},
abstract = {Despite recent advances in virtual reality, locomotion in a virtual environment is still restricted because of spatial disorientation. Previous research has shown the benefits of reference frames in maintaining spatial orientation. Here, we propose using a visually simulated reference frame in virtual reality to provide users with a better sense of direction in landmark-free virtual environments. Visually overlaid rectangular frames simulate different variations of frames of reference. We investigated how two different types of visually simulated reference frames might benefit in a navigational search task through a mixed-method study. Results showed that the presence of a reference frame significantly affects participants' performance in a navigational search task. Though the egocentric frame of reference (simulated CAVE) that translates with the observer did not significantly help, an allocentric frame of reference (a simulated stationary room) significantly improved user performance both in navigational search time and overall travel distance. Our study suggests that adding a variation of the reference frame to virtual reality applications might be a cost-effective solution to enable more effective locomotion in virtual reality.},
keywords = {cave, 3D navigation},
}
@misc{nguyenvo2017moving,
title = {Moving in a Box: Improving Spatial Orientation in Virtual Reality using Simulated Reference Frames},
author = {Nguyen-Vo*, Thinh and Riecke, Bernhard E. and Stuerzlinger, Wolfgang},
booktitle = {Symposium on {3D} User Interfaces},
publisher = {IEEE},
series = {3DUI '17},
howpublished = {Poster},
year = {2017},
month = {Mar},
pages = {846-847},
doi = {https://doi.org/10.1109/3DUI.2017.7893344},
abstract = {Despite recent advances in virtual reality, locomotion in a virtual environment is still restricted because of spatial disorientation. Previous research has shown the benefits of reference frames in maintaining spatial orientation. Here, we propose using a visually simulated reference frame in virtual reality to provide users with a better sense of direction in landmark-free virtual environments. Visually overlaid rectangular frames simulate different variations of frames of reference. We investigated how two different types of visually simulated reference frames might benefit in a navigational search task through a mixed-method study. Results showed that the presence of a reference frame significantly affects participants' performance in a navigational search task. Though the egocentric frame of reference (simulated CAVE) that translates with the observer did not significantly help, an allocentric frame of reference (a simulated stationary room) significantly improved user performance both in navigational search time and overall travel distance. Our study suggests that adding a variation of the reference frame to virtual reality applications might be a cost-effective solution to enable more effective locomotion in virtual reality.},
keywords = {cave, 3D navigation},
}
@misc{teather2016tutorial,
title = {SIVARG: Spatial Interaction in Virtual/Augmented Reality and Games},
author = {Teather, Robert and Stuerzlinger, Wolfgang},
booktitle = {International Conference on Interactive Surfaces and Spaces},
publisher = {ACM},
series = {ISS '16},
howpublished = {Tutorial},
year = {2016},
month = {Nov},
pages = {525–528},
doi = {https://doi.org/10.1145/2992154.2996364},
abstract = {We propose a workshop soliciting submissions on the topics of spatial and 3D interaction in highly fidelity graphical interactive systems, especially video games and virtual reality systems. Topics will cover all aspects of interaction in these systems, including input-related issues such as efficient control mappings, spatial input device features (e.g., low latency, input noise, etc.), as well as output-related issues such as display hardware features (e.g., stereoscopic rendering, head-tracking), and information visualization (e.g., game HUDs for status information). We propose to include both position papers, as well as papers including at least preliminary studies on issues in these areas.},
keywords = {3D user interface},
}
@misc{sun2016shiftsliding,
title = {{Shift-Sliding} and {Depth-Pop} for {3D} Positioning},
author = {Sun*, Junwei and Stuerzlinger, Wolfgang and Shuralyov*, Dmitri},
booktitle = {Symposium on Spatial User Interaction},
publisher = {ACM},
series = {SUI '16},
howpublished = {Demonstration},
year = {2016},
month = {Oct},
pages = {165-165},
doi = {https://doi.org/10.1145/2983310.2991067},
abstract = {We introduce two new 3D positioning methods. The techniques enable rapid, yet easy-to-use positioning of objects in 3D scenes. With SHIFT-Sliding, the user can override the default assumption of contact and non-collision for sliding, and lift objects into the air or make them collide with other objects. DEPTH-POP maps mouse wheel actions to all object positions along the mouse ray, where the object meets the default assumptions for sliding. We will demonstrate the two methods in a desktop environment with the mouse and keyboard as interaction devices. Both methods use frame buffer techniques for efficiency.},
keywords = {3D manipulation, 3D positioning},
}
@misc{machuca2016history,
title = {{3D} Camera Pose History Visualization},
author = {Barrera Machuca*, Mayra D. and Stuerzlinger, Wolfgang},
booktitle = {Symposium on Spatial User Interaction},
publisher = {ACM},
series = {SUI '16},
howpublished = {Poster},
year = {2016},
month = {Oct},
pages = {183-183},
doi = {https://doi.org/10.1145/2983310.2989185},
abstract = {We present a 3D camera pose history visualization that can assist users of CAD software's, virtual worlds and scientific visualizations to revisit their navigation history. The contribution of this system is to enable users to move more efficiently through the virtual environment so they can focus on their main activity.},
keywords = {3D navigation},
}
@misc{sun2016floatsliding,
title = {{FLOAT}-Sliding for {3D} Positioning},
author = {Sun*, Junwei and Stuerzlinger, Wolfgang},
booktitle = {Graphics Interface},
series = {GI '16},
howpublished = {Poster},
year = {2016},
month = {Jun},
numpages = {2},
abstract = {We describe a new technique for 3D positioning, based on the typical sliding technique. We assume that by default object stay in contact with the scene's front surfaces and do not interpenetrate other objects. To ensure precision, we permit manipulation only for at least partially visible objects. With our new FLOAT-Sliding method the user can override the default contact assumption and lift objects into the air or make them collide with other objects. For efficiency, FLOAT-Sliding uses frame buffer techniques.},
keywords = {3D manipulation, 3D positioning},
}
@misc{seim2016passive,
title = {Can Passive Haptic Learning Help Users Become More Skilled Keyboard Typists?},
author = {Seim*, Caitlyn and Doering+, Nick and Stuerzlinger, Wolfgang and Starner, Thad},
booktitle = {CHI 2016 Workshop on Inviscid Text Entry and Beyond},
series = {Textentry '16},
howpublished = {Extended Abstract},
year = {2016},
month = {May},
numpages = {4},
url = {http://www.textentry.org/chi2016},
abstract = {Passive Haptic Learning (PHL) can be used to teach text entry systems such as Braille and Morse code where each finger controls at most one key. However, most keyboards have a spatial layout where each finger controls multiple keys, and each key is labeled. Can PHL help users improve their skill at these text entry systems? We are investigating these questions by using passive stimuli to help users learn a randomized layout of the number pad. This research is aimed at laying the groundwork for creating a system to help individuals improve their QWERTY keyboard typing.},
keywords = {haptics, learning},
}
@misc{bjerre2015transition,
title = {Transition Times for Manipulation Tasks in Hybrid Interfaces},
author = {Bjerre+, Per and Christensen+, Allan and Pedersen+, Simon André and Pedersen+, Andreas Køllund and Stuerzlinger, Wolfgang},
booktitle = {3rd Symposium on Spatial User Interaction},
publisher = {ACM},
series = {SUI '15},
howpublished = {Poster},
year = {2015},
month = {Aug},
pages = {137-137},
doi = {https://doi.org/10.1145/2788940.2794358},
pdf = {papers/transitionsposter.pdf},
abstract = {Previous work has shown that uninstrumented in-air interaction is slower and not as precise for pointing tasks compared to the mouse. Yet, there are interaction scenarios where it is preferable or advantageous to use in-air input. Therefore, we examine a three-device hybrid setup involving the mouse, keyboard, and a Leap Motion. We performed a user study to quantify the costs associated with transitioning between these interaction devices and also for performing simple 2D manipulation tasks using the mouse and Leap Motion. We discovered that transitioning to and from the Leap Motion takes on average 0.87 seconds longer than transitions between the mouse and keyboard.},
keywords = {3D manipulation, 3D positioning},
}
@misc{arif2015smart,
title = {A Smart-Restorable Backspace to Facilitate Text Entry Error Correction},
author = {Arif, Ahmed Sabbir and Stuerzlinger, Wolfgang and Mazalek, Ali and Kim, Sunjun and Lee, Geehyuk},
booktitle = {CHI 2015 Workshop on Text Entry on the Edge},
series = {Textentry '15},
howpublished = {Extended Abstract},
year = {2015},
month = {Apr},
numpages = {4},
url = {http://www.textentry.org/chi2015},
abstract = {Selection is one of the most basic interaction methods in 3D user interfaces. Previous work has shown that visual feedback improves such actions. However, haptic feedback can increase the realism or also help for occluded targets. Here we investigate if 3D virtual hand selection benefits from electrical muscle stimulation (EMS) and vibration. In our experiment we used a 3D version of a Fitts' task to compare visual, EMS, vibration, and no feedback. The results demonstrate that both EMS and vibration are reasonable alternatives to visual feedback. We also found good user acceptance for both technologies.},
keywords = {text entry, errors, backspace},
}
@misc{pfeiffer2015ems,
title = {{3D} Virtual Hand Selection with {EMS} and Vibration Feedback},
author = {Pfeiffer*, Max and Stuerzlinger, Wolfgang},
booktitle = {33rd Annual Conference Extended Abstracts on Human Factors in Computing Systems},
publisher = {ACM},
series = {CHI EA '15},
howpublished = {Extended Abstract},
year = {2015},
month = {Apr},
pages = {1361-1366},
doi = {https://doi.org/10.1145/2702613.2732763},
abstract = {Selection is one of the most basic interaction methods in 3D user interfaces. Previous work has shown that visual feedback improves such actions. However, haptic feedback can increase the realism or also help for occluded targets. Here we investigate if 3D virtual hand selection benefits from electrical muscle stimulation (EMS) and vibration. In our experiment we used a 3D version of a Fitts' task to compare visual, EMS, vibration, and no feedback. The results demonstrate that both EMS and vibration are reasonable alternatives to visual feedback. We also found good user acceptance for both technologies.},
keywords = {3D positioning, haptics},
}
@misc{stuerzlinger2015tivs,
title = {TIVS: Temporary Immersive Virtual Environment at Simon Fraser University: A Non-permanent CAVE},
author = {Stuerzlinger, Wolfgang and Pavlovych*, Andriy and Nywton+, Dayson},
booktitle = {1st Workshop on Everyday Virtual Reality},
publisher = {IEEE},
series = {WEVR '15},
year = {2015},
month = {Mar},
pages = {23-28},
doi = {https://doi.org/10.1109/WEVR.2015.7151691},
pdf = {papers/tivs.pdf},
video = {videos/TIVS.mp4},
abstract = {CAVE systems are an immersive environment that surrounds one or more viewers with multiple large screens, which portray a virtual 3D environment. CAVEs use generally between three and six sides and are thus effectively permanent installations, due to the required floor and room space. We describe TIVS, the Temporary Immersive Virtual environment at Simon Fraser University, a system whose defining feature is that it does not consume any permanent floor space. Yet, TIVS can be in operation in less than a minute. Viewers sit on swivel chairs in the center of an 8' × 6' space, where TIVS's frame is mounted onto the ceiling. The bottom of said frame is 7' above the ground, making it easy for people to walk below it. The screens mounted on the frame are rolled down whenever the system is being used and are otherwise stowed away. That frees the floor space for other uses when the system is not in use. The projection geometry ensures that people sitting in the center area of the space do not cast shadows onto the screens. A tracking system attached to the frame provides for head tracking. Overall, the non-permanent nature of the system makes it surprisingly easy to integrate Virtual Reality into everyday environments.},
keywords = {immersive display system, large display system, cave},
}
@misc{codddowney2014leaplook,
title = {{LeapLook}: A Free-hand Gestural Travel Technique using the Leap Motion Finger Tracker},
author = {Codd-Downey*, Robert and Stuerzlinger, Wolfgang},
booktitle = {2nd Symposium on Spatial User Interaction},
publisher = {ACM},
series = {SUI '14},
howpublished = {Poster},
year = {2014},
month = {Oct},
pages = {153-153},
doi = {https://doi.org/10.1145/2659766.2661218},
abstract = {Contactless motion sensing devices enable a new form of input that does not encumber the user with wearable tracking equipment. We present a novel travel technique using the Leap Motion finger tracker which adopts a 2DOF steering metaphor used in traditional mouse and keyboard navigation in many 3D computer games.},
keywords = {3D navigation},
}
@misc{teather2014depthcues,
title = {Depth Cues and Mouse-Based {3D} Target Selection},
author = {Teather*, Robert J. and Stuerzlinger, Wolfgang},
booktitle = {2nd Symposium on Spatial User Interaction},
publisher = {ACM},
series = {SUI '14},
howpublished = {Poster},
year = {2014},
month = {Oct},
pages = {156-156},
doi = {https://doi.org/10.1145/2659766.2661221},
abstract = {We investigated mouse-based 3D selection using one-eyed cursors, evaluating stereo and head-tracking. Stereo cursors significantly reduced performance for targets at different depths, but the one-eyed cursor yielded some discomfort.},
keywords = {3D pointing},
}
@misc{pavlovych2014tivx,
title = {TIVX: Temporary Immersive Virtual Environment: A Non-Permanent CAVE},
author = {Pavlovych*, Andriy and Nywton+, Dayson and Stuerzlinger, Wolfgang},
booktitle = {GRAND NCE Conference},
series = {GRAND '14},
howpublished = {Demonstration},
year = {2014},
month = {May},
url = {http://grand-nce.ca/archives/annual-conference/grand-2014/program/poster-demo-experiences.html},
keywords = {immersive display system, cave},
}
@misc{arif2014howdo,
title = {How Do Users Interact with an Error Prone In-air Gesture Recognizer?},
author = {Arif*, Ahmed Sabbir and Stuerzlinger, Wolfgang and de Mendonça Filho+, Euclides José and Gordynski, Alec},
booktitle = {CHI Workshop on Gesture-based Interaction Design: Communication and Cognition},
howpublished = {Extended Abstract},
year = {2014},
month = {May},
numpages = {4},
pdf = {papers/errorpronegestures.pdf},
abstract = {We present results of two pilot studies that investigated human error behaviours with an error prone in-air gesture recognizer. During the studies, users performed a small set of simple in-air gestures. In the first study, these gestures were abstract. The second study associated concrete tasks with each gesture. Interestingly, the error patterns observed in the two studies were substantially different.},
keywords = {gestures, errors, mid-air},
}
@misc{arif2014error,
title = {Error Behaviours in an Unreliable In-Air Gesture Recognizer},
author = {Arif*, Ahmed Sabbir and Stuerzlinger, Wolfgang and de Mendonça Filho+, Euclides José and Gordynski, Alec},
booktitle = {Extended Abstracts on Human Factors in Computing Systems},
publisher = {ACM},
series = {CHI EA '14},
howpublished = {Extended Abstract},
year = {2014},
month = {May},
pages = {1603–1608},
doi = {https://doi.org/10.1145/2559206.2581188},
pdf = {papers/unreliableairgestures.pdf},
abstract = {This article presents results of two pilot studies that investigated error behaviours with an unreliable in-air gesture recognizer. During the studies, users performed a small set of simple in-air gestures. In the first study, these gestures were abstract. The second study associated concrete tasks with each gesture. The error patterns in the two studies were substantially different.},
keywords = {mid-air, gestures, errors},
}
@misc{teather2014fishtank,
title = {Fishtank Fitts: A Desktop VR Testbed for Evaluating {3D} Pointing Techniques},
author = {Teather*, Robert J. and Stuerzlinger, Wolfgang and Pavlovych*, Andriy},
booktitle = {Extended Abstracts on Human Factors in Computing Systems},
publisher = {ACM},
series = {CHI EA '14},
howpublished = {Extended Abstract},
year = {2014},
month = {May},
pages = {519–522},
doi = {https://doi.org/10.1145/2559206.2574810},
pdf = {papers/fishtankfittsdemo.pdf},
video = {videos/3DfishTankFitts.mp4},
abstract = {We present a desktop or "fish tank" virtual reality system for evaluating 3D selection techniques. Motivated by the successful application of Fitts' law to 2D pointing evaluation, the system provides a testbed for consistent evaluation of 3D point-selection techniques. The primary design consideration of the system was to enable direct and fair comparison between 2D and 3D pointing techniques. To this end, the system presents a 3D version of the ISO 9241-9 pointing task. Targets can be displayed stereoscopically, with head-coupled viewing, and at varying depths. The system also supports various input devices, including the mouse as well as 3D trackers in direct touch and remote pointing modes.},
keywords = {3D pointing},
}
@misc{stuerzlinger2013considerations,
title = {Considerations for Targets in {3D} Pointing Experiments},
author = {Stuerzlinger, Wolfgang},
booktitle = {Interactive Surfaces for Interaction with Stereoscopic {3D}},
series = {ISIS3D '13},
howpublished = {Extended Abstract},
year = {2013},
month = {Oct},
numpages = {4},
pdf = {papers/3Dtargets.pdf},
abstract = {We identify various tradeoffs around 3D pointing experiments based on Fitts' law and the ISO9241-9 methodology. The advantages and disadvantages of each approach are analyzed and compared against each other. We present some recommendations for 3D pointing experiments and avenues of future work.},
keywords = {3D pointing},
}
@misc{laldin2013up,
title = {Up- and Downwards Motions in {3D} Pointing},
author = {Laldin*, Sidrah and Teather*, Robert J. and Stuerzlinger, Wolfgang},
booktitle = {Symposium on Spatial User Interaction},
series = {SUI '13},
howpublished = {Poster},
year = {2013},
month = {Jul},
pages = {89-89},
doi = {https://doi.org/10.1145/2491367.2491393},
pdf = {papers/updownpointing.pdf},
abstract = {We present an experiment that examines 3D pointing in fish tank VR using the ISO 9241-9 standard. The experiment used three pointing techniques: mouse, ray, and touch using a stylus. It evaluated user pointing performance with stereoscopically displayed varying height targets above an upward-facing display. Results show differences in upwards and downwards motions for the 3D touch technique.},
keywords = {3D pointing},
}
@misc{bajer2013effects,
title = {Effects of Stereo and Head Tracking in {3D} Selection Tasks},
author = {Bajer*, Bartosz and Teather*, Robert J. and Stuerzlinger, Wolfgang},
booktitle = {Symposium on Spatial User Interaction},
series = {SUI '13},
howpublished = {Poster},
year = {2013},
month = {Jul},
pages = {77-77},
doi = {https://doi.org/10.1145/2491367.2491392},
pdf = {papers/headstereopointing.pdf},
abstract = {We report a 3D selection study comparing stereo and head-tracking with both mouse and pen pointing. Results indicate stereo was primarily beneficial to the pen mode, but slightly hindered mouse speed. Head tracking had fewer noticeable effects.},
keywords = {3D pointing},
}
@misc{stuerzlinger2013keynote,
title = {Modern Spatial and {3D} User Interfaces},
author = {Stuerzlinger, Wolfgang},
booktitle = {International Conference on Information Society},
publisher = {IEEE},
series = {iSociety '13},
howpublished = {Keynote abstract},
year = {2013},
month = {Jun},
pages = {9-9},
url = {https://ieeexplore.ieee.org/abstract/document/6636326},
abstract = {Three-dimensional (3D) user interfaces are popular in movies. Many current technologies enable people to interact with 3D content, also in computer games. I review the main ideas behind 3D user interfaces and present innovative solutions based on the capabilities and limitations of both humans and technologies.},
keywords = {3D user interfaces},
}
@comment{c, c={this has to be before the GRAND poster entry, as it attracted more citations than the poster}}
@misc{scheurich2013onehandedmating,
title = {A One-Handed Multi-Touch Mating Method for {3D} Rotations},
author = {Scheurich*, Doug and Stuerzlinger, Wolfgang},
booktitle = {Extended Abstracts on Human Factors in Computing Systems},
publisher = {ACM},
series = {CHI EA '13},
howpublished = {Extended Abstract},
year = {2013},
month = {Apr},
pages = {1623-1628},
doi = {https://doi.org/10.1145/2468356.2468646},
pdf = {papers/touchrotwip.pdf},
abstract = {Rotating 3D objects is a difficult task. We present a new rotation technique based on collision-free "mating" to expedite 3D rotations. It is specifically designed for one-handed interaction on tablets or touchscreens. A user study found that our new technique decreased the time to rotate objects in 3D by more than 60% in situations where objects align. We found similar results when users translated and rotated objects in a 3D scene. Also, angle errors were 35% less with mating. In essence, our new rotation technique improves both the speed and accuracy of common 3D rotation tasks.},
keywords = {3D manipulation},
}
@misc{scheurich2013mating,
title = {A One-Handed Multi-Touch Mating Method for {3D} Rotations},
author = {Scheurich*, Doug and Stuerzlinger, Wolfgang},
booktitle = {GRAND NCE Conference},
series = {GRAND '13},
howpublished = {Poster},
year = {2013},
month = {May},
abstract = {Rotating 3D objects is a difficult task. We present a new rotation technique based on collision-free "mating" to expedite 3D rotations. It is specifically designed for one-handed interaction on tablets or touchscreens. A user study found that our new technique decreased the time to rotate objects in 3D by more than 60% in situations where objects align. We found similar results when users translated and rotated objects in a 3D scene. Also, angle errors were 35% less with mating. In essence, our new rotation technique improves both the speed and accuracy of common 3D rotation tasks.},
keywords = {3D manipulation},
}
@misc{teather2013pointingtargets,
title = {Pointing at {3D} Target Projections with One-Eyed and Stereo Cursors},
author = {Teather*, Robert J. and Stuerzlinger, Wolfgang},
booktitle = {GRAND NCE Conference},
series = {GRAND '13},
howpublished = {Poster},
year = {2013},
month = {May},
abstract = {We present a study of cursors for selecting 2D-projected 3D targets. We compared a stereo- and mono-rendered (one-eyed) cursor using two mouse-based and two remote pointing techniques in a 3D Fitts' law pointing experiment. The first experiment used targets at fixed depths. Results indicate that one-eyed cursors only improve screen-plane pointing techniques, and that constant target depth does not influence pointing throughput. A second experiment included pointing between targets at varying depths and used only "screen-plane" pointing techniques. Our results suggest that in the absence of stereo cue conflicts, screen-space projections of Fitts' law parameters (target size and distance) yield constant throughput despite target depth differences and produce better models of performance.},
keywords = {3D pointing},
}
@misc{zaman2013alternatives,
title = {Alternatives in Generative Design},
author = {Zaman*, Loutfouz and Stuerzlinger, Wolfgang},
booktitle = {GRAND NCE Conference},
series = {GRAND '13},
howpublished = {Poster},
year = {2013},
month = {May},
keywords = {alternatives, design},
}
@misc{teather2012system,
title = {A System for Evaluating {3D} Pointing Techniques},
author = {Teather*, Robert J. and Stuerzlinger, Wolfgang},
booktitle = {18th Symposium on Virtual Reality Software and Technology},
publisher = {ACM},
series = {VRST '12},
howpublished = {Demonstration},
year = {2012},
month = {Dec},
pages = {209-210},
doi = {https://doi.org/10.1145/2407336.2407383},
pdf = {papers/3dpointingsystem.pdf},
abstract = {This demo presents a desktop VR system for evaluating human performance in 3D pointing tasks. The system supports different input devices (e.g., mouse and 6DOF remote pointer), pointing techniques (e.g., screen-plane and depth cursors), and cursor visualization styles (e.g., one-eyed and stereo 3D cursors). The objective is to comprehensively compare all combinations of these conditions. We especially focus in on fair and direct comparisons between 2D and 3D pointing tasks. Finally, our system includes a new pointing technique that outperforms standard ray pointing.},
keywords = {3D pointing},
}
@comment{c, c={leave the "_stuerzlinger" in the ID to enable umlaut-free search!}}
@misc{zeidler_stuerzlinger2012chinz,
title = {The Auckland Layout Editor: An Improved GUI Layout Specification Process},
author = {Zeidler*, Clemens and Lutteroth, Christof and Weber, Gerald and Stürzlinger, Wolfgang},
booktitle = {13th International Conference of the NZ Chapter of the ACM's Special Interest Group on Human-Computer Interaction},
series = {CHINZ '12},
howpublished = {Demonstration},
year = {2012},
month = {Jul},
pages = {103-103},
doi = {https://doi.org/10.1145/2379256.2379287},
abstract = {Constraint-based layout managers are more powerful than the common grid, grid-bag, and group layout managers. However, they are also more complex and come with potential problems such as over-constrained specifications and overlap in a GUI. Current GUI builders have little support for layout constraints, and it is not clear how such constraints can be made easily accessible to GUI designers. We will demonstrate a GUI builder - the Auckland Layout Editor (ALE) - that addresses these challenges, by allowing GUI designers to specify constraint-based layouts using only simple mouse operations. ALE guarantees that all operations lead to sound specifications, making sure that the layout is solvable and non-overlapping. To achieve the latter, we propose an algorithm that automatically generates the missing constraints that are necessary to keep a layout non-overlapping. Today's applications need to run on multiple devices with different screen sizes. For this a layout must have a good appearance at different sizes. To aid the designer in creating a layout with good resizing behavior, we propose a novel automatic layout preview, which displays the layout at its minimal and at an enlarged size chosen to visualize layout problems directly.},
keywords = {GUI, layout},
}
@misc{das2012comparing,
title = {Comparing Cognitive Effort in Spatial Learning of Text Entry Keyboards and {ShapeWriters}},
author = {Das*, Arindam and Stuerzlinger, Wolfgang},
booktitle = {Working Conference on Advanced Visual Interfaces},
series = {AVI '12},
howpublished = {Extended Abstract},
year = {2012},
month = {May},
pages = {649-652},
doi = {https://doi.org/10.1145/2254556.2254676},
pdf = {papers/effort2learn.pdf},
abstract = {Stable structured layouts of buttons are a primary means of control for input in current graphical user interfaces. Such layouts are ubiquitous - from tiny iPhone screens to large kiosk screens in the malls - they are found everywhere. Yet, there has been relatively little theoretical account that compares the impact of cognitive effort on learning such stable layouts. In this paper, we demonstrate that prior empirical results on cognitive effort in learning stable layouts are theoretically predictable through the memory activation model of a cognitive architecture, ACT-R. We go beyond previous work by quantitatively comparing the level of cognitive effort in terms of a newly introduced parameter in the declarative memory model of ACT-R. We theoretically compare the cognitive effort of two different layouts of graphical buttons with respect to their label representativeness in the domains of traditional keyboard and ShapeWriter.},
keywords = {text entry, learning},
}
@misc{teather2012cursors,
title = {Cursors for {3D} Pointing},
author = {Teather*, Robert J. and Stuerzlinger, Wolfgang},
booktitle = {The 3rd Dimension of CHI ({3DCHI}): Touching and Designing {3D} User Interfaces},
series = {3DCHI '12},
howpublished = {Extended Abstract},
year = {2012},
month = {May},
numpages = {8},
pdf = {papers/cursor3Dpointingshort.pdf},
abstract = {We present a study of cursors for 3D pointing/selection interfaces. We compared a stereo- and mono-rendered (one-eyed) cursor used with two mouse-based and two remote pointing techniques. This comparison was performed in a 3D Fitts' law pointing experiment with varying target depths. Results indicate that the one-eyed cursor is beneficial only for some pointing techniques. While the mouse-based techniques performed best, our new ray-screen technique outperforms traditional ray pointing. This is likely because it is less affected by target depth.},
keywords = {3D pointing},
}
@misc{arif2012how,
title = {How Do Users Adapt to a Faulty System?},
author = {Arif*, Ahmed Sabbir and Stuerzlinger, Wolfgang},
booktitle = {CHI Workshop on Designing and Evaluating Text Entry Methods},
series = {Textentry '12},
howpublished = {Extended Abstract},
year = {2012},
month = {May},
numpages = {4},
url = {http://www.textentry.org/chi2012},
pdf = {papers/faultysystemshort.pdf},
abstract = {We investigate how users gradually adapt to a faulty system and how the system error rate influences this adaptation process. We present results of a study that verifies that a user's learning rate to compensate for system errors depends on how erroneous that system is – they learn to avoid erroneous actions faster if errors occur more frequently.},
keywords = {gestures, errors},
}
@misc{stuerzlinger2012stereo,
title = {Stereo vs. One-Eyed Cursors for {3D} Pointing and Implications for Touch Interfaces},
author = {Stuerzlinger, Wolfgang and Teather*, Robert J.},
booktitle = {Touching the 3rd Dimension},
series = {Dagstuhl Seminar 12151},
howpublished = {Abstract},
year = {2012},
month = {Apr},
doi = {https://doi.org/10.4230/DagRep.2.4.1},
abstract = {We compare remote pointing and mouse pointing techniques using both a stereo- and mono-rendered cursor in a Fitts' law pointing experiment with varying target depths in a 3D scene. Results indicate that mouse-based techniques perform best and that the one-eyed cursor is beneficial only for some pointing techniques. We discuss the implications for 3D touch interfaces.},
keywords = {3D pointing},
}
@misc{zaman2012evaluation,
title = {Evaluation of a {3D} {UI} with Different Input Technologies},
author = {Zaman*, Loutfouz and Shuralyov*, Dmitri and Teather*, Robert J. and Stuerzlinger, Wolfgang},
booktitle = {Symposium on {3D} User Interfaces},
publisher = {IEEE},
series = {3DUI '12},
howpublished = {Extended Abstract},
year = {2012},
month = {Mar},
pages = {173-174},
doi = {https://doi.org/10.1109/3DUI.2012.6184217},
pdf = {papers/evalwiimouse.pdf},
abstract = {We present two studies of navigation and object manipulation in a virtual supermarket. The first study compared a mouse and keyboard setup to a game hardware setup using a Wii Remote, Wii Balance Board and a dancemat. The second study used more game-like software interfaces for both conditions and used only the Wii Remote and Nunchuk in the game-hardware setup. The mouse setup was around 36% faster in both studies. In the first study the mouse setup was 98% more accurate; no difference in accuracy was found in the second study.},
keywords = {3D pointing},
}
@misc{teather2012investigating,
title = {Investigating One-Eyed and Stereo Cursors for {3D} Pointing Tasks},
author = {Teather*, Robert J. and Stuerzlinger, Wolfgang},
booktitle = {Symposium on {3D} User Interfaces},
publisher = {IEEE},
series = {3DUI '12},
howpublished = {Extended Abstract},
year = {2012},
month = {Mar},
pages = {167-168},
doi = {https://doi.org/10.1109/3DUI.2012.6184214},
pdf = {papers/cursor3Dpointingposter.pdf},
abstract = {We compared two remote pointing techniques to two mouse pointing techniques using both with a stereo- and mono-rendered cursor. These were compared using a Fitts' law pointing experiment with varying target depths in a 3D scene. Results indicate that mouse-based techniques performed best and that the one-eyed cursor is beneficial only for some pointing techniques.},
keywords = {3D pointing},
}
@misc{stuerzlinger2011onoffline,
title = {On- and Off-Line User Interfaces for Collaborative Cloud Services},
author = {Stuerzlinger, Wolfgang},
booktitle = {CHI Workshop Designing Interaction for the Cloud},
howpublished = {Extended Abstract},
year = {2011},
month = {May},
numpages = {6},
pdf = {papers/cloudui.pdf},
abstract = {We describe a vision for user interfaces of cloud-based systems that permit seamless collaboration and provide also on- and off-line access to data. All individual components of this vision are currently available in various systems, but the sum of the components will satisfy user needs much more comprehensively.},
keywords = {GUI, cloud computing, off-line, collaboration},
}
@misc{pavlovych2011pursuit,
title = {Pursuit Tracking in Presence of Latency, Jitter, and Dropouts},
author = {Pavlovych*, Andriy and Stuerzlinger, Wolfgang},
booktitle = {GRAND NCE Conference},
series = {GRAND '11},
howpublished = {Poster},
year = {2011},
month = {May},
keywords = {latency, jitter, tracking},
}
@misc{zaman2011darls,
title = {DARLS: Differencing and Merging Diagrams Using Dual View Animation, Re-Layout, Layers and a Storyboard},
author = {Zaman*, Loutfouz and Kalra+, Ashish and Stuerzlinger, Wolfgang},
booktitle = {Extended Abstracts on Human Factors in Computing Systems},
publisher = {ACM},
series = {CHI EA '11},
howpublished = {Extended Abstract},
year = {2011},
month = {May},
pages = {1657-1662},
doi = {https://doi.org/10.1145/1979742.1979824},
pdf = {papers/darls.pdf},
abstract = {We present a new system for visualizing and merging differences in diagrams. It uses animation, dual views, a storyboard, relative re-layout, and layering to visualize differences. The system is also capable of differencing UML class diagrams. An evaluation produced positive results for animation and dual views with difference layer.},
keywords = {difference visualization},
}
@misc{shuralyov2011puzzle,
title = {A {3D} Desktop Puzzle Assembly System},
author = {Shuralyov*, Dmitri and Stuerzlinger, Wolfgang},
booktitle = {Symposium on {3D} User Interfaces},
publisher = {IEEE},
series = {3DUI '11},
howpublished = {3DUI contest entry},
year = {2011},
month = {Mar},
pages = {139-140},
doi = {https://doi.org/10.1109/3DUI.2011.5759244},
pdf = {papers/3dpuzzle.pdf},
video = {videos/Puzzle2x.mp4},
teaser = {teasers/3dpuzzle.png},
abstract = {We describe a desktop virtual reality system targeted at 3D puzzle assembly. The results of the evaluation show that all novices could successfully complete the puzzle within an average of about six minutes, while experts took about two minutes.},
keywords = {3D manipulation},
}
@misc{pavlovych2010effects,
title = {Effects of Latency Jitter and Dropouts in Pointing Tasks},
author = {Pavlovych*, Andriy and Stuerzlinger, Wolfgang},
booktitle = {GRAND NCE Conference},
series = {GRAND '10},
howpublished = {Poster},
year = {2010},
month = {Jul},
abstract = {Interactive computing systems frequently use pointing as an input modality, while also supporting other forms of input. We focus on pointing and investigate the effects of variations, i.e. jitter, in the input device latency, as well as dropouts, on 2D pointing speed and accuracy. First, we characterize the latency, latency jitter, and dropouts in several common input technologies. Then we present an experiment, where we systematically explore combinations of dropouts, latency, and latency jitter on a desktop mouse. The results indicate that latency and dropouts have a strong effect on human performance; moderate amounts of jitter in latency do not change performance in a significant way in most cases.},
keywords = {latency, jitter, pointing},
}
@misc{zaman2010interface,
title = {A New Interface for Cloning Objects in Drawing Systems},
author = {Zaman*, Loutfouz and Stuerzlinger, Wolfgang},
booktitle = {GRAND NCE Conference},
series = {GRAND '10},
howpublished = {Poster},
year = {2010},
month = {Jun},
abstract = {Cloning objects is a common operation in graphical user interfaces. A good example is calendar systems, where users commonly create and modify recurring events, i.e. repeated clones of a single event. Inspired by the calendar paradigm, we introduce a new cloning technique for 2D drawing programs. This technique allows users to clone objects by first selecting them and then dragging them to create clones along the dragged path. A novel approach for the generation of clones of clones is also presented. Moreover, the technique enables editing of the generated sequences of clones similar to the editing of calendar events.
We compared our new clone creation technique with generic duplication via copy-and-paste, smart duplication, and a dialog driven technique on a desktop system. The results show that the new cloning method is always faster than dialogs and faster than smart duplication for most conditions. We also compared our clone editing method against rectangular selection. The results show that our method is better in general. In situations where rectangle selection is effective, our method is still competitive. Participants preferred the new techniques overall, too.},
keywords = {cloning, drawing, copy, paste},
}
@misc{pavlovych2010effectslatency,
title = {Effects of Latency Jitter and Dropouts in Pointing Tasks},
author = {Pavlovych*, Andriy and Stuerzlinger, Wolfgang},
booktitle = {Graphics Interface},
series = {GI '10},
howpublished = {Poster},
year = {2010},
month = {May},
pages = {30-32},
abstract = {Interactive computing systems frequently use pointing as an input modality, while also supporting other forms of input. We focus on pointing and investigate the effects of variations, i.e. jitter, in the input device latency, as well as dropouts, on 2D pointing speed and accuracy. First, we characterize the latency, latency jitter, and dropouts in several common input technologies. Then we present an experiment, where we systematically explore combinations of dropouts, latency, and latency jitter on a desktop mouse. The results indicate that latency and dropouts have a strong effect on human performance; moderate amounts of jitter in latency do not change performance in a significant way in most cases.},
keywords = {latency, jitter, pointing},
}
@misc{arif2010mobile,
title = {Two New Mobile Touchscreen Text Entry Techniques},
author = {Arif*, Ahmed Sabbir and Lopez+, Mauricio H. and Stuerzlinger, Wolfgang},
booktitle = {Graphics Interface},
series = {GI '10},
howpublished = {Poster},
year = {2010},
month = {May},
abstract = {This article introduces two new mobile touchscreen text entry techniques. One is timeout-based and the other is pressure-based. Also, this work examines the effects of tactile feedback on text entry techniques. Empirical comparisons between conventional and proposed techniques show that the new techniques, as well as tactile feedback, enhance overall text entry performance.},
keywords = {text entry, mobile device},
}
@misc{agarwal2010widgetlens,
title = {{WidgetLens}: Interaction Through The Looking Glass},
author = {Agarwal*, Bhavna and Stuerzlinger, Wolfgang},
booktitle = {Graphics Interface},
series = {GI '10},
howpublished = {Poster},
year = {2010},
month = {May},
abstract = {Computer and mobile device screens are increasing in size and resolution. This increase in resolution causes problems with graphical user interfaces designed for lower resolution screens, as all information gets smaller and smaller. We present two novel techniques to make graphical user interfaces on high-resolutions screens more accessible and usable. We introduce a new in-place, localized zooming technique that works on a per widget basis. We also present a novel widget magnification technique that implements special modalities for common user interface elements, which affords widget-dependent magnification.},
keywords = {GUI, widget, magnification, layout},
}
@misc{dehmeshki2010design,
title = {Design of a Perceptual-Based Object Group Selection Technique},
author = {Dehmeshki*, Hoda and Stuerzlinger, Wolfgang},
booktitle = {Graphics Interface},
series = {GI '10},
howpublished = {Poster},
year = {2010},
month = {May},
abstract = {Selecting groups of objects is a common task in graphical user interfaces. Current selection techniques such as lasso and rectangle selection become time-consuming and error-prone in dense configurations or when the area covered by targets is large or hard to reach. This paper presents a new pen-based interaction technique that allows users to efficiently select perceptual groups formed by the Gestalt principle of good continuity.},
keywords = {group selection},
}
@misc{teather2010target,
title = {Target Pointing in {3D} User Interfaces},
author = {Teather*, Robert J. and Stuerzlinger, Wolfgang},
booktitle = {Graphics Interface},
series = {GI '10},
howpublished = {Poster},
year = {2010},
month = {May},
abstract = {We present two studies using ISO 9241-9 to evaluate target pointing in two different 3D user interfaces. The first study was conducted in a CAVE, and used the standard tapping task to evaluate passive haptic feedback. Passive feedback increased throughput significantly, but not speed or accuracy alone. The second experiment used a fish tank VR system, and compared tapping targets presented at varying heights stereoscopically displayed at or above the surface of a horizontal screen. The results indicate that targets presented closer to the physical display surface are generally easier to hit than those displayed farther away from the screen.},
keywords = {3D pointing},
}
@misc{ashtiani2009xnt,
title = {XNT: Object Transformation on Multi-Touch Surfaces},
author = {Ashtiani*, Behrooz and Stuerzlinger, Wolfgang},
booktitle = {Conference on Interactive Tabletops and Surfaces 2009},
series = {ITS '09},
howpublished = {Poster},
year = {2009},
month = {Nov},
numpages = {2},
pdf = {papers/xntposter.pdf},
video = {videos/XNT3D.mp4},
abstract = {We present and evaluate a new object transformation technique for multi-touch surfaces. Specifying complete object transformations for a two-dimensional space requires a minimum of four degrees of freedom (DOF): two for position, one for rotation, and another for scaling. Many existing techniques for object transformation are designed to function with traditional input devices such as mice, single-touch surfaces, or stylus pens. The challenge is then to compensate for the lack of DOF's. XNT is a new three-finger object transformation technique, designed specifically for multi-touch surface devices. It provides a natural interface for object manipulation and was experimentally found to be faster than previous techniques.},
keywords = {manipulation, touch},
}
@misc{teather2009coupling,
title = {Evaluating Visual/Motor Coupling in Fish Tank VR},
author = {Teather*, Robert J. and Allison, Robert and Stuerzlinger, Wolfgang},
booktitle = {CVR Conference},
series = {CVR '09},
howpublished = {Poster},
year = {2009},
month = {Jun},
keywords = {3D pointing},
}
@misc{teather2009effectslatency,
title = {Effects of Latency and Spatial Jitter on {2D} and {3D} Pointing},
author = {Teather*, Robert J. and Pavlovych*, Andriy and Stuerzlinger, Wolfgang},
booktitle = {Virtual Reality Conference},
publisher = {IEEE},
series = {VR '09},
howpublished = {Poster},
year = {2009},
month = {Mar},
pages = {229-230},
doi = {https://doi.org/10.1109/VR.2009.4811029},
abstract = {We investigate the effects of input device latency and spatial jitter on 2D pointing tasks and a 3D movement. First, we characterize jitter and latency in a 3D tracking device and an optical mouse used for baseline comparison. We present an experiment based on ISO 9241-9, which measures performance of pointing devices. We added latency and jitter to the mouse and compared it to a 3D tracker. Results indicate that latency has a stronger effect on performance than small spatial jitter. A second experiment found that erratic jitter "spikes" can affect 3D movement performance.},
keywords = {3D pointing, latency, jitter},
}
@misc{stuerzlinger2008nextgen,
title = {Next Generation {3D} Interaction Techniques},
author = {Stuerzlinger, Wolfgang and Wingrave*, Chad},
booktitle = {Virtual Realities},
series = {Dagstuhl Seminar 08231},
howpublished = {Abstract},
year = {2008},
month = {Jun},
url = {http://drops.dagstuhl.de/opus/volltexte/2008/1634},
abstract = {We present a set of guidelines for 3D positioning techniques. These guidelines are intended for developers of object interaction schemes in 3D games, modeling packages, computer-aided design systems, and virtual environments. The guidelines promote intuitive object movement techniques in these types of environments.},
keywords = {3D manipulation, 3D pointing},
}
@misc{das2008recall,
title = {Recall Accuracy Drive Visual Strategy Adaptation in Multi-tap Text Entry},
author = {Das*, Arindam and Stuerzlinger, Wolfgang},
booktitle = {Graphics Interface},
series = {GI '08},
howpublished = {Poster},
year = {2008},
month = {May},
abstract = {We present a cognitive model that demonstrates how the recall accuracy of letter positions on a cell phone keypad effects the transition from novice to expert behavior. In particular, we target multi-tap text entry methods and focus on the process of visually searching versus selecting (i.e. deciding) a letter on the keypad. The model predicts the probability of letter location recall by novice users through a cognitive architecture named ACT-R, and models learning as the user gradually gains cognitive expertise with practice, session after session. We then employ this probability within a model of strategy adaptation that encapsulates the effect of different visual exploration strategies: novice users search for a letter while the behavior of advanced users is modeled by the Hick-Hyman Law. The final output of our cognitive model is the entry speed for the key press for a letter in a letter-group containing multiple distinct letters.},
keywords = {text entry, learning},
}
@misc{dadgari2008analysis,
title = {Analysis of Merging Text Versions Using Differentiation Methods},
author = {Dadgari*, Darius and Stuerzlinger, Wolfgang},
booktitle = {Graphics Interface},
series = {GI '08},
howpublished = {Poster},
year = {2008},
month = {May},
abstract = {Comparing and selecting text from multiple versions of a document is a necessary task for a task-leader or group to undertake when users collaborate in writing a document, or when a single user generates different versions of a document to experiment with. Comparing multiple documents in an intuitive, efficient way allows a user to select the most appropriate portions of work from multiple sources quickly, to create a final document. Examination and even publications of text versioning methods are not documented in the literature, even though implementations of text versioning are abundant in a multitude of commercial and non-commercial software.
We propose new methods for text versioning, based on methods which have been previously shown to be effective for differentiating between objects. We plan to perform an extensive evaluation with these proposed methods to currently implemented ones in order to examine which methods are preferred by users and which show benefit in terms of error rate and completion time.},
keywords = {difference visualization},
}
@misc{dehmeshki2008using,
title = {Using Perceptual Grouping for Object Group Selection},
author = {Dehmeshki*, Hoda and Stuerzlinger, Wolfgang},
booktitle = {Graphics Interface},
series = {GI '08},
howpublished = {Poster},
year = {2008},
month = {May},
abstract = {Selection is a critical task in document processing systems, and is required for many manipulation operations such as deleting, moving, reusing, or re-formatting. Documents have usually a hierarchical structure. For example, books are naturally represented as a sequence of chapters, sections, subsections and so on until described completely in terms of basic component such as paragraphs, tabular material, and images. This structure is usually visualized using different formats (e.g. font sizes) or different views (e.g. outline views in Microsoft Words). Despite this inherent structure, to the best of our knowledge no selection technique systematically utilizes this structure in pen-based system. The multi-click approach is a standard selection method offered by many systems. Single, double, and triple clicking then selects the corresponding unit (e.g. word, line, and paragraph, respectively). This approach cannot select larger units than a paragraph and is not well suited for pen-based systems, as multi-clicking is unreliable for pens. Current selection techniques such as Rectangle, Lasso require users to explicitly define a selection scope by a pen movement. This can be time-consuming and error-prone when the target is large (e.g. multiple paragraphs) or spans more than a page. In the later case, the user has to select and scroll simultaneously. Moreover, these techniques are one directional, i.e. from the start point to the end point. The following common scenario describes potential problems: during a paragraph selection, the user decides to select the previous paragraph as well. She has two choices: either cancelling, relocating the mouse (pen), and re-starting a new selection, or selecting both paragraphs individually while using a phrasing technique (such as a Shift-key).
We propose a novel pen-based technique issues for selecting document components. Performing a pigtail gesture in a margin selects the nearby unit. Continuous pigtails extend selection to previous, next or both units according to the last pigtail orientation. Our technique automatically scrolls (or zooms out) when selecting off-screen targets.},
keywords = {group selection},
}
@misc{pavlovych2008effect,
title = {Effect of Group Size and Interaction Devices in Co-Located Computer Supported Collaborative Work},
author = {Pavlovych*, Andriy and Stuerzlinger, Wolfgang},
booktitle = {Graphics Interface},
series = {GI '08},
howpublished = {Poster},
year = {2008},
month = {May},
keywords = {large display interaction, collaboration, groupware, CSCW},
}
@misc{teather2008exaggerating,
title = {Exaggerating Head-Coupled Camera Motions in Fish Tank VR},
author = {Teather*, Robert J. and Stuerzlinger, Wolfgang},
booktitle = {Graphics Interface},
series = {GI '08},
howpublished = {Poster},
year = {2008},
month = {May},
abstract = {Virtually exaggerating head motions when using head-coupled viewing may be beneficial. This is especially important in environments where the user is sitting, such as in desktop or "fish-tank" VR. We present an evaluation of exaggerated head-coupled perspective for 3D assembly tasks. Three levels of exaggeration were compared to determine if exaggeration was beneficial compared to a direct mapping. The results suggest that there is some user preference towards modest levels of exaggeration. However, no significant differences by the experimental conditions were detected, other than a learning effect.},
keywords = {3D navigation},
}
@misc{dehmeshki2008intelligent,
title = {Intelligent Object Group Selection},
author = {Dehmeshki*, Hoda and Stuerzlinger, Wolfgang},
booktitle = {Extended Abstracts on Human Factors in Computing Systems},
publisher = {ACM},
series = {CHI EA '08},
howpublished = {Extended Abstract},
year = {2008},
month = {Apr},
pages = {3111-3116},
doi = {https://doi.org/10.1145/1358628.1358816},
pdf = {papers/gestaltclick.pdf},
abstract = {Current object group selection techniques such as lasso or rectangle selection can be time consuming and error prone. This is apparent when selecting distant objects on a large display or objects arranged along curvilinear paths in a dense area. We present a novel group selection technique based on the Gestalt principles of proximity and good continuity. The results of a user study show that our new technique outperforms lasso and rectangle selection for object groups in(curvi)linear arrangements or clusters, i.e. groups with an implicit structure.},
keywords = {group selection},
}
@misc{teather2008assessingeffects,
title = {Assessing the Effects of Orientation and Device on {3D} Positioning},
author = {Teather*, Robert J. and Stuerzlinger, Wolfgang},
booktitle = {Virtual Reality Conference},
publisher = {IEEE},
series = {VR '08},
howpublished = {Poster},
year = {2008},
month = {Mar},
pages = {293-294},
doi = {https://doi.org/10.1109/VR.2008.4480807},
pdf = {papers/move3dposter2.pdf},
abstract = {We present two studies to assess which physical factors of various input devices influence 3D object movement tasks. In particular, we evaluate the factors that seem to make the mouse a good input device for constrained 3D movement tasks. The first study examines the effect of a supporting surface across orientation of input device movement and display orientation. Surprisingly, no significant results were found for the effect of physical support for constrained movement techniques. Also, no significant difference was found between matching the orientation of the display to that of the input device movement. A second study found that the mouse outperformed all tracker conditions for speed, but the presence or absence of support had no significant effect when tracker movement is constrained to 2D.},
keywords = {3D pointing},
}
@misc{dehmeshki2007gestalt,
title = {Gestalt-Based Object Group Selection},
author = {Dehmeshki*, Hoda and Stuerzlinger, Wolfgang},
booktitle = {CVR Conference},
series = {CVR '08},
howpublished = {Poster},
year = {2007},
month = {Jun},
pdf = {papers/gestaltmodel2.pdf},
abstract = {Object grouping in graphical systems is supported by Lasso or Rectangle techniques which could require extra steps. This work presents a new approach to group objects by Gestalt principles of proximity, curve-linearity, similarity and common region. We demonstrate the results with several examples.},
keywords = {group selection},
}
@misc{teather2007challenge,
title = {The Challenge of {3D} Interaction: Guidelines for Intuitive {3D} Manipulation Techniques},
author = {Teather*, Robert J. and Stuerzlinger, Wolfgang},
booktitle = {Interacting with Immersive Worlds},
howpublished = {Abstract},
year = {2007},
month = {Jun},
numpages = {1},
abstract = {The rapid evolution of computer technology has made it possible to generate increasingly realistic virtual environments. However, despite the promise and hype of virtual reality that began in the 1980s, actual usage of the technology (outside of research settings) is limited primarily to derivatives of truly immersive VR, such as 3D video games. We suggest that one of the greatest barriers to widespread adoption of VR technology is the lack of intuitive interaction techniques available in virtual environments. True 3D manipulation is a 6 degree of freedom (6DOF) task, i.e. three independent axes of movement and three independent axes of rotation. Although we regularly perform such manipulations in reality with our hands, in a virtual environment, we are faced with a difficult choice of input devices: either use a familiar, but less immersive device, such as a mouse or use any of a number of unfamiliar and problematic 3D input devices. However, a mouse is a 2DOF device, providing movement in two directions only. Without support from software techniques that map 2D mouse movements into 6DOF operations, such a device is inadequate for manipulating objects in 3D.
One alternative is to use a higher DOF input device (e.g. 3D wands or gloves) which can provide high-precision 3D positioning and orientation. This is an attractive solution for immersive environments where the user is standing. Another possibility is to use a mouse with indirect manipulation techniques, such as 3D widgets, or control keys to toggle the axis of movement/rotation. However, both of these approaches present unique sets of problems. Full 6DOF input devices tend to be difficult to use and indirect manipulation techniques force the user to mentally decompose each manipulation into a series of steps. Both solutions require the user to think about the interface, rather than the task at hand.
A third approach is to use constraints, such as gravity, collision avoidance, etc. Building on this idea, we propose instead the use of "intelligent" 2DOF interaction techniques that automatically and intuitively map 2D mouse motions to 3D movement. One such technique, used for moving objects in the Sesame 3D conceptual modeling tool has been shown in experiments to be significantly faster and more accurate than both 6DOF input and 3D widget interaction techniques. This technique is an example of 3D direct manipulation, allowing users to "click and drag" objects in the scene. Dragging the object causes it to slide along the foremost visible surface behind it in the scene. This sliding motion behaves in a very predictable, natural way, and suggests that a mouse with suitably intelligent software support may be an ideal "3D" input device for certain VR and 3D applications, notably 3D modeling.
Based on this, and related research, we have composed a list of several guidelines for researchers developing immersive applications requiring 3D interaction. These guidelines are intended to aid designers in choosing methods of interaction, but are broad enough to encompass any type of 3D application requiring the accurate interactive positioning of objects in the environment. Current research suggests that techniques based on these guidelines may not only benefit mouse-based input, but input from higher-DOF devices as well.},
keywords = {3D manipulation},
}
@misc{teather2007evaluation,
title = {An Evaluation of {3D} Positioning Techniques for Scene Assembly},
author = {Teather*, Robert J. and Stuerzlinger, Wolfgang},
booktitle = {Symposium on {3D} User Interfaces},
publisher = {IEEE},
series = {3DUI '07},
howpublished = {Poster},
year = {2007},
month = {Mar},
numpages = {1},
pdf = {papers/move3dposter.pdf},
keywords = {3D manipulation, 3D positioning},
}
@misc{stuerzlinger2006covidsystem,
title = {{CoViD}: A System for Collaborative Virtual {3D} Design},
author = {Stuerzlinger, Wolfgang},
booktitle = {CSCW Workshop: Design and CSCW},
howpublished = {Extended Abstract},
year = {2006},
month = {Nov},
numpages = {2},
pdf = {papers/covid_short.pdf},
abstract = {Many important decisions in the design process are made fairly early on, after designers have presented initial concepts. In many domains, these concepts are now realized as 3D digital models and, in meetings, the stakeholders evaluate these potential solutions. Frequently, the participants in such a meeting want to interactively modify the proposed designs to explore the design space better. Today's systems and tools do not support this, as computer systems typically support only a single user and computer-aided design tools require significant training. This paper presents a new system to facilitate a collaborative 3D design process. The new system, CoViD, consists of two main parts. The first part is an easy-to-use conceptual 3D design tool that can be used productively even by naive users. The second part is a novel infrastructure for collaborative work, which offers an interactive table and several large interactive displays in a semi-immersive setup. The synthesis of both parts forms a new platform for collaborative virtual 3D design.},
keywords = {collaboration, design, 3D modeling},
}
@misc{dehmeshki2006perceptual,
title = {A Perceptual-based Group Selection Technique for Graph Drawing Systems},
author = {Dehmeshki*, Hoda and Stuerzlinger, Wolfgang},
booktitle = {Grace Hopper Conference},
howpublished = {Poster},
year = {2006},
month = {Oct},
keywords = {group selection},
}
@misc{stuerzlinger2006reality,
title = {Reality-Based Object Movement Techniques for {3D}},
author = {Stuerzlinger, Wolfgang and Dadgari*, Darius and Oh*, Ji-Young},
booktitle = {CHI Workshop: What is the Next Generation of Human-Computer Interaction?},
howpublished = {Extended Abstract},
year = {2006},
month = {Apr},
articleno = {D.3},
numpages = {4},
pdf = {papers/realitymove3d.pdf},
abstract = {Scene layout and part assembly are basic tasks in 3D object manipulation. While movement methods based on 3D or 6D input devices exist, the most efficient 3D movement techniques are based on utilizing only two degrees of freedom. This poses the problem of mapping the motion of the 2D input device to efficient and predictable object motion in 3D. We present a new method to map 2D input to 3D motion in this paper. The object position follows the mouse cursor position closely, while the object always stays in contact with other surfaces in the scene. In contrast to existing techniques, the movement surface and the relative object position is determined using the whole area of overlap of the moving object with the static scene. The resulting object movement is visually smooth and predictable, while avoiding undesirable collisions. The technique also utilizes the fact that people easily recognize the depth-order of shapes based on occlusions. The proposed technique runs in real-time. Finally, the evaluation of the new technique with a user study shows that it compares very favorably to conventional techniques.},
keywords = {3D manipulation, 3D positioning},
}
@misc{kulikov2006targeted,
title = {Targeted Steering Motions},
author = {Kulikov*, Sergey and Stuerzlinger, Wolfgang},
booktitle = {Extended Abstracts on Human Factors in Computing Systems},
publisher = {ACM},
series = {CHI EA '06},
howpublished = {Extended Abstract},
year = {2006},
month = {Apr},
pages = {983-988},
doi = {https://doi.org/10.1145/1125451.1125640},
pdf = {papers/targetsteer.pdf},
abstract = {In this paper we investigate targeted steering motions. Fitts' law is a very successful model to explain human targeting behavior, while the Steering law has been used to model steering motions. Dennerlein et al. combined these two models to explain targeted steering motions, but this combination introduces additional parameters. In this paper, we present a new, simpler, model that can be used to predict targeted steering motions.},
keywords = {steering},
}
@misc{dehmeshki2006using,
title = {Using Perceptual Grouping for Object Group Selection},
author = {Dehmeshki*, Hoda and Stuerzlinger, Wolfgang},
booktitle = {Extended Abstracts on Human Factors in Computing Systems},
publisher = {ACM},
series = {CHI EA '05},
howpublished = {Extended Abstract},
year = {2006},
month = {Apr},
pages = {700-705},
doi = {https://doi.org/10.1145/1125451.1125593},
pdf = {papers/gestaltmodel.pdf},
abstract = {Modern graphical user interfaces support the direct manipulation of objects and efficient selection of objects is an integral part of this user interface paradigm. For the selection of object groups most systems implement only rectangle selection and shift-clicking. This paper presents an approach to group selection that is based on the way human perception naturally groups objects, also known as the "Gestalt" phenomenon. Based on known results from perception research, we present a new approach to group objects by the Gestalt principles of proximity, curve-linearity, and closure. We demonstrate the results with several examples.},
keywords = {group selection},
}
@misc{kulikov2005measuring,
title = {Measuring the Effective Parameters of Steering Motions},
author = {Kulikov*, Sergey and {MacKenzie}, I. Scott and Stuerzlinger, Wolfgang},
booktitle = {Extended Abstracts on Human Factors in Computing Systems},
publisher = {ACM},
series = {CHI EA '05},
howpublished = {Extended Abstract},
year = {2005},
month = {Apr},
pages = {1569-1572},
doi = {https://doi.org/10.1145/1056808.1056968},
pdf = {papers/steeringwidth.pdf},
teaser = {teasers/steeringwidth.png},
abstract = {The steering law model describes pointing device motion through constrained paths. Previous uses of the model are deficient because they are built using only error-free responses, ignoring altogether the path of the cursor. We correct this by proposing and validating a technique to include spatial variability, including errors. The technique is a variant of the well-known "effective target width" used in Fitts' law models. An experiment designed to test our technique demonstrates the improvement: Correlations are consistently higher when spatial variability is included in building the model. Suggestions to aid further development of the steering law model are included.},
keywords = {steering},
}
@misc{stuerzlinger2005multi,
title = {MULTI: Multi-User Laser Table Interface},
author = {Stuerzlinger, Wolfgang},
booktitle = {CHI Workshop on Distributed Display Environments},
howpublished = {Extended Abstract},
year = {2005},
month = {Apr},
numpages = {2},
pdf = {papers/multi_design.pdf},
abstract = {We present a new system, which consists of an interactive table and several interactive wall displays and is designed to be used by a single person as well as collaboratively. A new kind of interaction device, based on laser pointes, affords both local (i.e. pen-based) as well as remote interaction. The research focuses on interaction techniques for this system as well as research on collaborative activities, in particular collaborative design.},
keywords = {large display system, large display interaction, collaboration, laser},
}
@misc{pavlovych2005windowmanager,
title = {A Window Manager for High Dynamic Range Display Systems},
author = {Pavlovych*, Andriy and Vorozcovs*, Andrew and Stuerzlinger, Wolfgang},
booktitle = {VR Workshop on Emerging Display Technologies},
howpublished = {Extended Abstract},
year = {2005},
month = {Mar},
pages = {31-34},
pdf = {papers/hdrwinmgr.pdf},
abstract = {The dynamic luminance range of many real-world environments exceeds the capabilities of current display technology by several orders of magnitude. Recently, new display systems have demonstrated, which are capable of displaying images with a dynamic luminance range much more similar to that encountered in the real world.
The paper summarizes how the human eye perceives high dynamic luminance ranges, sources of high dynamic range data, how the new display systems work, as well as their limitations. The paper discusses the need for a high dynamic range window manager and presents an initial implementation. Finally, the results of a preliminary evaluation are presented.},
keywords = {high dynamic range, GUI},
}
@misc{oh2004sesame,
title = {{SESAME}: {3D} Conceptual Design System},
author = {Oh*, Ji-Young and Stuerzlinger, Wolfgang},
booktitle = {SIGGRAPH Posters},
publisher = {ACM},
series = {SIGGRAPH '04},
howpublished = {Poster},
year = {2004},
month = {Aug},
numpages = {1},
doi = {https://doi.org/10.1145/1186415.1186461},
pdf = {papers/sesame_poster.pdf},
abstract = {We present a system for a conceptual design session in the desktop Virtual Environment (DVE) and Computer Aided Design (CAD). We consider easy modification to be important for conceptual sessions, as users alter the design frequently in those sessions. The system presents new techniques to make the modification of a scene easy.},
keywords = {3D manipulation, 3D positioning, design},
}
@misc{pouliquen2004hog,
title = {{HOG}: A New Model Representation for {3D} Acquisition and Planning},
author = {Pouliquen*, Gilles and Stuerzlinger, Wolfgang},
booktitle = {Canadian Conference on Intelligent Systems},
howpublished = {Poster},
year = {2004},
month = {Jun},
numpages = {1},
pdf = {papers/HOG_poster.pdf},
abstract = {Digital acquisition of 3D objects is a process in which a computer model of a physical object is constructed. This process is extremely popular nowadays as the resulting computer models have many applications. The acquisition process can be decomposed into four stages which have to be repeated until a satisfying model is obtained. Those four stages are scanning, registration, integration and planning [1].
The planning stage is needed because an object cannot be modeled from a single scan. It is necessary to measure the object from various points of view to obtain a complete model.
Currently, there is no system that can automatically scan an unknown object. Hence, a highly trained operator is needed to control the scanning device. The operator must select poses for the scanner such that the number of scans required to completely scan the object is kept reasonably small.
We present a novel representation for the model: the Hierarchical Occupancy Grid (HOG). This representation can be used for the integration and planning stage of the 3D acquisition pipeline.},
keywords = {3D scanning, next-best view},
}
@misc{stuerzlinger2004presentation,
title = {High Dynamic Range Display System},
author = {Stuerzlinger, Wolfgang},
booktitle = {DRDC/CVR Workshop},
howpublished = {Abstract},
year = {2004},
month = {Mar},
keywords = {high dynamic range, display},
}
@misc{pavlovych2003modeling,
title = {Modeling non-Expert Text Entry Speed on Phone Keypads},
author = {Pavlovych*, Andriy and Stuerzlinger, Wolfgang},
booktitle = {16th Annual ACM Symposium on User Interface Software and Technology},
series = {UIST '03},
howpublished = {Poster},
year = {2003},
month = {Nov},
pdf = {papers/nonexpertmodel.pdf},
abstract = {For mobile phones, previous research has created models that can be used to predict expert performance. However, one important factor that influences the success of new interaction techniques is the users' initial experience with them. In this work, we present a new model to predict text entry speed on 12-button mobile phone keypads for novices. The model is based on Fitts' law, letter digraph probabilities, and a model of the mental processing time before key presses.},
keywords = {text entry, novice},
}
@misc{seetzen2003emerging,
title = {High Dynamic Range Display System},
author = {Seetzen*, Helge and Whitehead, Lorne and Stuerzlinger, Wolfgang and Vorozcovs*, Andrew and Wilson, Hugh and Ashdown, Ian and Ward, Greg},
booktitle = {Emerging Technologies at ACM SIGGRAPH 2003},
series = {SIGGRAPH '03},
howpublished = {Demonstration},
year = {2003},
month = {Jul},
numpages = {1},
pdf = {papers/hdr_demonstration.pdf},
abstract = {We have developed a high dynamic range (HDR) display capable of presenting a luminance range of 10,000 cd/m2 to 0.1 cd/m2. In addition to the initial embodiment of the technology, we have developed a flat-panel version using light emitting diodes (LED) which offers the same dramatic dynamic range benefits in a much smaller package.},
keywords = {high dynamic range, display},
}
@misc{yourganov2002simulation,
title = {Simulation of Camera Distortions},
author = {Yourganov*, Grigori and Stuerzlinger, Wolfgang},
booktitle = {Space Vision and Advanced Robotics},
series = {SVAR '02},
howpublished = {Poster},
year = {2002},
month = {Jun},
keywords = {camera distortion},
}
@techreport{yourganov2001tonemapping,
title = {Tone-Mapping for High Dynamic Range Images},
author = {Yourganov*, Grigori and Stuerzlinger, Wolfgang},
institution = {Dept. of Computer Science, York University, Canada},
type = {Technical Report},
year = {2001},
month = {Dec},
numpages = {12},
pdf = {papers/TR_tonemapping.pdf},
keywords = {high dynamic range, tone mapping},
}
@misc{yourganov2001hdrvideo,
title = {High Dynamic Range Video},
author = {Yourganov*, Grigori and Stuerzlinger, Wolfgang},
booktitle = {York CVR Conference: Levels of Perception},
series = {CVR '01},
howpublished = {Poster},
year = {2001},
month = {Jun},
keywords = {high dynamic range, video},
}
@techreport{yourganov2001acquiring,
title = {Acquiring High Dynamic Range Video at Video Rates},
author = {Yourganov*, Grigori and Stuerzlinger, Wolfgang},
institution = {Dept. of Computer Science, York University, Canada},
type = {Technical Report},
year = {2001},
month = {May},
numpages = {18},
pdf = {papers/TR_hdrvideo.pdf},
abstract = {In the real world, the scene may contain some well-illuminated areas as well as some areas that are in the darkness. The dynamic range of the scene, or the radiance ratio between the brightest and the darkest spots, can be quite big – it can span several orders of magnitude in some cases. This is a lot wider range than the range that our digital camera can adequately capture, and that our monitor can adequately display. The areas that are too bright for the dynamic range of our camera are going to be saturated on our image, and the areas that are too dark will be under-exposed. In both cases, all the information about these areas will be lost in the image.
A way to solve this problem is to combine different shutter speeds of our camera. Smaller shutter speeds can give us good information about the bright areas (because we won't have saturation), and longer shutter speeds effectively capture the dark areas. So by alternating the shutter speeds and by combining the two images into one in real-time, we can achieve higher dynamic range for digital video cameras.},
keywords = {high dynamic range, video},
}
@misc{yourganov2001poster,
title = {High Dynamic Range Video},
author = {Yourganov*, Grigori and Stuerzlinger, Wolfgang},
booktitle = {Vision and Intelligent Systems Workshop},
howpublished = {Poster},
year = {2001},
month = {May},
keywords = {high dynamic range, video},
}
@misc{poupyrev20003duibib,
title = {20th Century {3DUI} Bib: Annotated Bibliograpy of {3D} User Interfaces of the 20th Century},
author = {Poupyrev, Ivan and Kruijff, Ernst and Bowman, Doug and Billinghurst, Mark and Cugini, John and Dachselt, Raimund and Hinckley, Ken and {LaViola}, Joe and Lindeman, Rob and Pierce, Jeff and Steed, Anthony and Stuerzlinger, Wolfgang},
year = {2000},
month = {Jan},
url = {http://people.cs.vt.edu/~bowman/3dui.org/bibs/3duibib.pdf},
commented-url = {http://www.mic.atr.co.jp/~poup/3dui/3duibib.htm},
commented-url2 = {https://web.archive.org/web/20070223123901/http://www.mic.atr.co.jp/~poup/3dui/3duibib.htm},
}
@misc{elinas2000clouds,
title = {Real Time Rendering of {3D} Clouds},
author = {Elinas*, Pantelis and Stuerzlinger, Wolfgang},
booktitle = {Graphics Interface},
series = {GI '00},
howpublished = {Poster},
year = {2000},
month = {May},
numpages = {3},
pdf = {papers/cloudsposter.pdf},
abstract = {There is a myriad of real-time graphics applications that can greatly increase in realism with the introduction of realistic clouds in the scenery. These include applications in virtual reality, outdoor scene visualization, flight simulation, games etc. In the past, several researchers have proposed algorithms for realistic cloud rendering for non-real-time applications. Of these, the approaches of Gardner 85 and Nishita 96 stand out as the ones that give the most visually pleasing results. In our work, we are developing an implementation of Gardner's 3D cloud rendering algorithm augmented with recent advances such as photon maps with the help of hardware accelerated OpenGL.
Our implementation follows closely, Gardner's approach. We use textured ellipsoids as the building blocks for the clouds. We use Perlin noise textures compared to Gardner's spectral noise textures because we have more flexibility in controlling their appearance. The texture used is an indication of the volume density of the ellipsoid. Rendering the ellipsoids produces ellipses. Because clouds are more transparent at their edges compared to their middle, a result of the fact that the center of a cloud is denser, we need to fuzz out the edges of the ellipses.
Each cloud is made of a number of ellipsoids. The first step is to render each of the ellipsoids individually and evaluate the transparency over the resulting ellipse. The next step is to combine all the ellipses together to render the complete cloud.
Equation (1) is used to compute the transparency as a function of two thresholds one applied to the edge (T1) and one applied to the center of
the ellipse (T2). The values produced are consistent with OpenGL alpha channel values. We use a normalizing factor D just as Gardner did. We generate the function g(x,z) over the ellipsoid by utilizing projective textures. The latter function is maximum at the center of the ellipse and goes to zero at its edges; a spotlight texture is used to generate this effect. Evaluation is done partly in the alpha channel and partly in the RGB channels of the frame buffer in two steps. First T2*(1-g(x,z)) is computed and stored in the RGB channels. The It-T1 part is computed in the alpha channel. We then perform α = (R-α) by utilizing the color matrix extension. We set the color matrix to copy the red to the alpha channel while setting up subtractive blending and then we perform the operation by copying the frame buffer onto itself. The 1/D scaling is also achieved in the same step by including the 1/D term in the color matrix. The result is stored in the alpha channel while the RGB channels are cleared to accept new data in the next step.
Next we render the ellipsoids using a second texture that determines their color. We use another Perlin noise texture modulated with the color of the ellipsoids calculated using an infinite light source representing the Sun. The latter produces a simple approximation to global illumination of the cloud even though effects such as self-shading of the cloud is not taken into account. We are currently investigating better approaches to this such as using photon maps. The results of this step are stored in the RGB channels.
At this point the back buffer holds each of the ellipses including their transparency. We read these data into a texture of the smallest size that includes all the ellipses. Then, we calculate where on the screen each of the ellipses should appear and we render textured rectangles for each of the ellipsoids. We render each of the rectangles in the order of back to front with respect to the position of the ellipsoids in 3D; the ellipsoids are originally sorted roughly from back to front with respect to the location of their center.
This implementation is compatible with standard OpenGL hardware in its majority with the exception of the color matrix extension that is only available on SGI machines. Our implementation achieves real-time frame rates on low-end workstations such the SGI NT 320 and SGI O2 machines. More complex clouds made of 130+ ellipsoids can be rendered in real-time on more powerful machines such as the SGI Onyx.},
keywords = {rendering, real-time},
}
@misc{salzman2000constraint,
title = {Constraint Based {3D} Scene Construction},
author = {Salzman*, Tim and Smith*, Graham and Stuerzlinger, Wolfgang},
booktitle = {Graphics Interface},
series = {GI '00},
howpublished = {Poster},
year = {2000},
month = {May},
numpages = {2},
pdf = {papers/miveposter.pdf},
abstract = {Realistic 3D scenes often contain thousands of objects, and are in general difficult to model using today's CAD programs. We address this problem by exploiting predefined semantic relationships between objects to dynamically group and constrain them [GS99]. Virtual constraints, which de-couple the object's geometry from its constraints, are presented. Also discussed are techniques for dynamically grouping and re-grouping objects based on their semantic and virtual constraints. Preliminary testing shows that our system provides a fast, intuitive user interface for 3D scene construction. Finally, we will present ideas for future work.
Positioning objects in a virtual environment is not an intuitive task. One approach is direct manipulation using a six degree of freedom (DOF) input device. However, it is hard to position objects precisely using these devices, users often become fatigued, and many object interactions can be more effectively accomplished using a simple 2D interface such as a mouse [HPGK+94]. For these reasons, much research has been focused on software techniques for manipulating 3D objects using standard 2D input devices.
Bier [Bi90] presented snap-dragging for interactive solid modeling systems. This system used a general purpose gravity function and alignment manifolds to position objects in the scene. Snap-dragging provided easy selection of object features but the system required a complex user interface, had an unchangeable view and was computationally intensive.
In Object Associations [BS95], Bukowski and Sequin use a combination of physical properties (pseudo gravity) and goal oriented behaviour (alignment) to position and manipulate objects in a scene. This system was used to model the Berkeley Soda Hall WALKTRHU environment, which contained thousands of objects. However, adding new objects to the library is difficult, as object association must be coded. Constrained objects do not always move together because there is no dynamic grouping, instead the scene is searched for associated objects each time an object is moved. Further, all associations in this system are limited by object geometry.
Gosele exploited natural object behaviour to define and maintain object constraints [Go99]. Polygons were used to define offer and constraint areas, and a hierarchical labelling system was used to define which polygons could be constrained together. Typical constraint labels were on-Floor, on-Wall, and on-Workspace. Collision detection was added to the system to add realism by preventing inter-object penetrations. However, once constrained, objects in this system could not be unconstrained. Also, multiple constraints between two-objects were not possible.
Our system improves upon previous work in the following ways. Firstly, we allow constraints to be broken by pulling away from the constraining surface. For example, an object constrained to the floor and the wall can be unconstrained from the wall by pulling the object away from the wall. Also, an object can be re-constrained by translating it to another acceptable offer area. To show the user which offer areas will accept an object, all acceptable offer areas are highlighted when an object is selected for translation. Un-constraining and re-constraining an object invokes the dynamic grouping mechanism, which maintains the constraint relationships between objects.
We present the notion of virtual constraints. A virtual-constraint can be any polygon in 3D object-space, not necessarily associated with the object's geometry. An example is a polygon somewhere beneath a table, to which the front of a chair may be constrained. We present negative constraints, which are a specialization of virtual constraints are. Negative constraints are useful for defining volumes of space in which certain objects should not be placed. For example a desk would not be placed against a doorway because it would make the door inaccessible.
Our system has optimized the constraint satisfaction algorithm by pruning the search for valid offer areas and using a minimal distance constraint, typically the bounding radius of an object.
Finally, we present dual-constraints, bi-directional constraints between objects. When two or more objects are constrained by dual constraints, they form a dual-group. Using a drag-add technique, a row of constrained, neatly aligned books can be created on a bookshelf with one interaction step. We introduce the push-pull metaphor for interacting with a dual-group. When a dual-group is selected for translation, a connected-component search finds all group members who are attached to the selected object by dual-constraints in the approximate direction of translation. Those objects that are not attached in the direction of translation are un-grouped. With this technique, a row of cabinets that are connected by dual groups can be split into two groups by selecting a cabinet in the center and pulling in the direction that the new group is to translate.
Preliminary testing of the system is very promising. After a very short demo of the system, first time users were able to recreated a reasonably complicated scene in a matter minutes. Future plans are to test the system rigorously and compare results to a system with conventional interaction techniques.},
keywords = {3D manipulation},
}
@misc{stcyr2000knowledge,
title = {A Knowledge-Based Agent for CAD systems},
author = {St-Cyr+, Olivier and Lesperance, Yves and Stuerzlinger, Wolfgang},
booktitle = {Graphics Interface},
series = {GI '00},
howpublished = {Poster},
year = {2000},
month = {May},
numpages = {2},
pdf = {papers/agentposter.pdf},
abstract = {This poster describes an approach in improving the usability of computer-aided design (CAD) applications by adding an intelligent agent that assists the user in his/her interaction with the system. To implement the agent, I used ConGolog [GLL97, LLR99] – a very high-level programming language for developing knowledge-based agents that are embedded in complex environments. ConGolog supports the specification of a task-level model of a dynamic environment, the description of complex behaviours, and the synthesis of new plans at run-time. A prototype intelligent agent is being developed to work with an existing 3D CAD system [GS99]. This agent is intended to help the user in designing an office layout that satisfies his goals.
The CAD system [GS99] that our intelligent agent works with is built to allow the user to design a 3D virtual environment (office, kitchen, living room, etc.). The system's graphical user interface is quite simple. Interactions consist primarily of using the mouse to pick and place various types of objects (desk, chair, lamp, inkwell, etc.) in the room layout. In this, it resembles the Object Associations system [BS95]. The system handles the details of interactions based on a model of objects and the physical constraints that hold in the scene, for instance, an object being supported by a particular surface. But the system lacks a model of the user, of the task that he/she is trying to perform, and of the objectives that he/she is trying to achieve. It cannot really assist the user in quickly creating the desired room layout.
An early example for a system that attempts to aid the user in creating a room layout is CRACK [FM88]. This 2D system critiques the current design with text messages that explain the problem. The domain knowledge embedded in the critiquing system is not used to actively aid the user for placing objects.
It is believed that the use of intelligent agent technology can provide many benefits in the area of layout systems. An agent would maintain a high-level representation of the application domain, including object behaviour and user knowledge and goals. This could be used to enforce complex application specific constraints on the way objects are manipulated and on the layouts
that are produced. Secondly, such a model could be used for disambiguation and consistency checking. Humans often communicate information about a task very inaccurately because they understand the context of the task and its goals from previous experience. An agent could use its domain knowledge to resolve ambiguities, as well as ask more meaningful questions when user input is required. Moreover, the user goal model could be exploited to detect inadvertent errors. Thirdly, the agent could also aid the user in constructing the virtual design using its knowledge of the domain and user goals. Because it is aware of the current state of the design, it can provide suggestions and advice to the user, guide him through the task, and respond to user's questions. All this would lead towards much more natural and intuitive interaction between the user and the CAD system.},
keywords = {3D manipulation, design},
}
@misc{stcyr2000intelligent,
title = {An Intelligent Assistant for Computer-Aided Design},
author = {St-Cyr+, Olivier and Lesperance, Yves and Stuerzlinger, Wolfgang},
booktitle = {Smart Graphics: Papers from the AAAI Spring Symposium},
series = {SG '00},
isbn = {978-157735110-8},
howpublished = {Extended Abstract},
year = {2000},
month = {Mar},
pages = {24-28},
url = {https://aaai.org/Library/Symposia/Spring/ss00-04.php},
pdf = {papers/intelagent.pdf},
abstract = {This paper describes an approach in improving the usability of computer-aided design (CAD) applications by adding an intelligent agent that assists the user in his/her interaction with the system. To implement the agent, we use ConGolog [GLL97, LLR99] – a very high-level programming language for developing knowledge-based agents that are embedded in complex environments. ConGolog supports the specification of a task-level model of a dynamic environment, the description of complex behaviors, and the synthesis of new plans at run-time. A prototype intelligent agent is being developed to work with an existing 3D CAD system [GS99]. This agent is intended to help the user in designing an office layout that satisfies his goals.
The CAD system [GS99] that our intelligent agent works with is built to allow the user to design a 3D virtual environment (office, kitchen, living room, etc.). The system's graphical user interface is quite simple. Interactions consist primarily of using the mouse to pick and place various types of objects (desk, chair, lamp, inkwell, etc.) in the room layout. In this it resembles the Object Associations system [BS95]. The system handles the details of interactions based on a model of objects and the physical constraints that hold in the scene, for instance, an object being supported by a particular surface. But the system lacks a model of the user, of the task that he is trying to perform, and of the objectives that he is trying to achieve. It cannot really assist the user in quickly creating the desired room layout.
An early example for a system that attempts to aid the user in creating a room layout is CRACK [FM88]. This 2D system critiques the current design with text messages that explain the problem. The domain knowledge embedded in the critiquing system is not used to actively aid the user for placing objects.
We believe that the use of intelligent agent technology can provide many benefits in the area of layout systems. An agent would maintain a high-level representation of the application domain, including object
behavior and user knowledge and goals. This could be used to enforce complex application specific constraints on the way objects are manipulated and on the layouts that are produced. Secondly, such a model could be used for disambiguation and consistency checking. Humans often communicate information about a task very inaccurately, because they understand the context of the task and its goals from previous experience. An agent could use its domain knowledge to resolve ambiguities, as well as ask more meaningful questions when user input is required. Moreover, the user goal model could be exploited to detect inadvertent errors. Thirdly, the agent could also aid the user in constructing the virtual design using its knowledge of the domain and user goals. Because it is aware of the current state of the design, it can provide suggestions and advice to the user, guide him through the task, and respond to user questions. All this would lead to much more natural and intuitive interaction between the user and the CAD system.},
keywords = {3D modeling, 3D manipulation, constraints},
}
@comment{c, c={leave the "_stuerzlinger" in the ID to enable umlaut-free search!}}
@techreport{bastos_stuerzlinger1998forward,
title = {Forward Mapped Planar Mirror Reflections},
author = {Bastos*, Rui and Stürzlinger, Wolfgang},
institution = {Univ. of North Carolina at Chapel Hill},
type = {Technical Report},
year = {1998},
month = {Aug},
number = {TR98-026},
numpages = {12},
pdf = {papers/TR98-026.pdf},
abstract = {This paper presents a new technique, which we call depth-preserving reflection mapping, to render mirror-like reflections on planar surfaces in constant time. It is a hybrid solution which combines geometry-based rendering and image-based rendering into a two-pass mirror reflection rendering approach. The technique extends the traditional reflection mapping to preserve depth per texel and uses forward warping to approximate the mirror-like reflections on planar surfaces. For clarity, to distinguish these texels from the ones of traditional reflection mapping, we call them zexels.},
keywords = {rendering, real-time},
}
@comment{c, c={leave the "_stuerzlinger" in the ID to enable umlaut-free search!}}
@techreport{raskar_stuerzlinger1998efficientimage,
title = {Efficient Image Generation for Multiprojector and Multisurface Displays},
author = {Raskar*, Ramesh and Cutts*, Matt and Welch, Greg and Stürzlinger, Wolfgang},
institution = {Univ. of North Carolina at Chapel Hill},
type = {Technical Report},
year = {1998},
month = {Apr},
number = {TR98-016},
numpages = {12},
pdf = {papers/TR98-016.pdf},
abstract = {We describe an efficient approach to rendering a perspectively correct image on a potentially irregular display surface that may be illuminated with one or more distinct devices. The first pass of the technique generates an image of the desired graphics model using conventional rendering. The second pass projects that image as a texture onto a model of the display surface, then re-renders the textured display surface model from the viewpoint of each display device. The algorithm scales with the complexity of the display surface, and is constant with respect to the complexity of the graphics model.},
keywords = {rendering, projector, real-time},
footnote = {Extended version of EGSR '98 paper with theoretical analysis},
}
@comment{c, c={leave the "_stuerzlinger" in the ID to enable umlaut-free search!}}
@misc{schaufler_stuerzlinger1998hierarchical,
title = {{3D} Hierarchical Image Cache},
author = {Schaufler*, Gernot and Stürzlinger, Wolfgang},
booktitle = {Workshop on Image-Based Rendering and Modeling},
howpublished = {Poster},
year = {1998},
month = {Mar},
commented-url = {http://www.gup.uni-linz.ac.at:8001/staff/schaufler/papers/octimp},
keywords = {rendering, real-time},
}
@techreport{aliaga_stuerzlinger1998framework,
title = {A Framework for the Real-Time Walkthrough of Massive Models},
author = {Aliaga*, Daniel and Cohen*, Jon and Wilson*, Andrew and Zhang*, Hansong and Erikson*, Carl and Hoff*, Kenny and Hudson*, Tom and Stürzlinger, Wolfgang and Baker*, Eric and Bastos*, Rui and Whitton, Mary and Brooks, Fred and Manocha, Dinesh},
institution = {Univ. of North Carolina at Chapel Hill},
type = {Technical Report},
year = {1998},
month = {Mar},
number = {TR98-013},
numpages = {12},
url = {https://techreports.cs.unc.edu/papers/98-013.pdf},
pdf = {papers/TR98-013.pdf},
abstract = {We present a framework for rendering very large 3D models at nearly interactive rates. The framework scales with model size. Our framework can integrate multiple rendering acceleration techniques, including visibility culling, geometric levels of detail, and image-based approaches. We describe the database representation scheme for massive models used by the framework. We provide an effective pipeline to manage the allocation of system resources among different techniques. We demonstrate the system on a model of a coal-fired power plant composed of more than 15 million triangles.},
keywords = {rendering, real-time},
}
@techreport{stuerzlinger1998imaging,
title = {Imaging all Visible Surfaces Or How many Reference Images are needed for Image-Based Modeling?},
author = {Stürzlinger, Wolfgang},
institution = {Univ. of North Carolina at Chapel Hill},
type = {Technical Report},
year = {1998},
month = {Mar},
number = {TR98-010},
numpages = {11},
pdf = {papers/TR98-010.pdf},
abstract = {Today many systems exist to generate geometric models of existing scenes and objects. However, no accurate data about surface appearance such as colors and textures is stored in this process. Such data can be captured as a series of images that, collectively, capture all surfaces of the object.
This work introduces a method to compute a minimal set of camera positions for this purpose. Taking images from the computed positions can then be used to derive a complete set of surface appearance data. A slightly different application of the presented method is the computation of a minimal set of viewpoints for reference images to be used in image-based rendering methods.
First a method to determine an optimal set of viewpoint regions for a given scene is introduced. It uses a hierarchical visibility method to preprocess the scene. Then a technique to find an optimal set of viewpoint regions is presented and the solution is used to derive an optimal set of viewpoints. Results and visualizations of the computed solutions are presented.},
keywords = {3D scanning, visibility},
}
@techreport{stuerzlinger1995discontinuity,
title = {Discontinuity Meshing for a Radiosity Algorithm},
author = {Stürzlinger, Wolfgang},
institution = {GUP, Johannes Kepler Universität Linz, Austria},
type = {Technical Report},
year = {1995},
month = {Oct},
number = {CEI PACT D4V-8},
url = {https://www.jku.at/forschung/forschungs-dokumentation/publikation/2155},
keywords = {rendering, global illumination},
}
@techreport{stuerzlinger1995form,
title = {Form Factor Calculation for a Parallel Radiosity Algorithm},
author = {Stürzlinger, Wolfgang},
institution = {GUP, Johannes Kepler Universität Linz, Austria},
type = {Technical Report},
year = {1995},
month = {Jul},
number = {CEI-PACT D4V-6},
url = {https://www.jku.at/forschung/forschungs-dokumentation/publikation/2142},
keywords = {rendering, global illumination, parallel, visibility},
}
@comment{c, c={leave the "_stuerzlinger" in the ID to enable umlaut-free search!}}
@misc{schaufler_stuerzlinger1995parallelposter,
title = {Parallel Radiosity},
author = {Schaufler*, Gernot and Stürzlinger, Wolfgang and Volkert, Jens},
booktitle = {Workshop on Algorithms for Future Technologies},
howpublished = {Poster},
year = {1995},
month = {Mar},
commented-location = {Prague, CZ},
keywords = {rendering, global illumination, parallel},
}
@comment{c, c={leave the "_stuerzlinger" in the ID to enable umlaut-free search!}}
@techreport{schaufler_stuerzlinger1995load,
title = {Load Balancing for a Parallel Radiosity Algorithm},
author = {Schaufler*, Gernot and Stürzlinger, Wolfgang and Wild*, Christoph},
institution = {GUP, Johannes Kepler Universität Linz, Austria},
type = {Technical Report},
year = {1995},
month = {Jan},
number = {CEI PACT D4V-3},
url = {https://www.jku.at/forschung/forschungs-dokumentation/publikation/2134},
keywords = {rendering, global illumination, parallel, visibility},
}
@techreport{stuerzlinger1994description,
title = {Description and Implementation of a Parallel Radiosity Algorithm},
author = {Stürzlinger, Wolfgang and Wild*, Christoph and Schaufler*, Gernot},
institution = {GUP, Johannes Kepler Universität Linz, Austria},
type = {Technical Report},
year = {1994},
month = {Jul},
number = {CEI PACT D4V-1},
url = {https://www.jku.at/forschung/forschungs-dokumentation/publikation/2129},
keywords = {rendering, global illumination, parallel},
}
@misc{stuerzlinger1994parallelvisibility,
title = {Parallel Visibility Calculations for Parallel Radiosity},
author = {Stürzlinger, Wolfgang and Wild*, Christoph},
booktitle = {Workshop Paragraph},
howpublished = {Poster},
year = {1994},
month = {Mar},
pages = {32-40},
commented-location = {Hagenberg, AT},
abstract = {The radiosity method models the interaction of light between diffuse reflecting surfaces, thereby accurately predicting global illumination effects. Due to the high computational effort to calculate the transfer of light between surfaces and the memory requirements for the scene description, a distributed, parallelized version of the algorithm is needed for scenes consisting of thousands of surfaces. We present a distributed, parallel progressive radiosity algorithm. Then we parallelize the visibility calculations and present a scheme for the communication structure. Finally we analyze the results.},
keywords = {rendering, global illumination, parallel, visibility},
}
@techreport{stuerzlinger1993fxfire,
title = {FXFIRE - Global Illumination with Radiosity},
author = {Stürzlinger, Wolfgang},
institution = {GUP, Johannes Kepler Universität Linz, Austria},
type = {Technical Report},
year = {1993},
month = {Dec},
keywords = {rendering, global illumination},
}
@techreport{stuerzlinger1993flirt,
title = {FLIRT - Faster than Light Ray Tracer},
author = {Stürzlinger, Wolfgang and Tobler*, Robert and Schindler*, Michael},
institution = {Vienna University of Technology, Austria},
type = {Technical Report},
year = {1993},
month = {Aug},
keywords = {rendering, ray tracing},
}
@mastersthesis{stuerzlinger1999habilitation,
title = {Bildgenerierung},
author = {Stürzlinger, Wolfgang},
publisher = {Johannes Kepler Universität Linz, Austria},
year = {1999},
month = {Apr},
abstract = {A fundamental task in computer graphics is the generation of images. Given a geometric model of an object or scene the user wants a visual representation for a given viewpoint. This visualization process is also known as rendering images of a model.
An active research area in rendering is the generation of images with high visual realism. Important visual cues like highlights on surfaces and shadows cast by light sources aid the viewer in understanding an image. Images with high realism are produced with global illumination methods, which approximate the light distribution in an environment to varying degrees.
The major challenge in real-time rendering is to generate images as quickly as possible. Frame rates higher than 20 frames per second are needed to ensure that users perceive smooth motion. Although image generation hardware is widely available, it is hard to visualize very large structures at interactive rates even on high-end platforms. Furthermore, model sizes are growing quicker than graphics hardware capabilities. Several classes of techniques for optimized rendering have been devised to achieve high frame rates.
This text places most publications of the author in the context of these two research areas in computer graphics.},
keywords = {rendering, real-time, ray tracing},
note = {Austrian Habilitation},
}
@phdthesis{stuerzlinger1992dissertation,
title = {Radiosity mit Voronoi-Diagrammen und Diskontinuitäts-Meshes},
author = {Stürzlinger, Wolfgang},
school = {Vienna University of Technology, Austria},
year = {1992},
month = {Dec},
url = {https://catalogplus.tuwien.at/permalink/f/qknpf/UTW_alma2156324830003336},
abstract = {In dieser Arbeit wird ein Verfahren vorgestellt, das es ermöglicht, die genaue Beleuchtung einer Szene zu berechnen, die von flächigen Lichtquellen beleuchtet wird und die durch Polygone beschrieben ist, deren Oberflächen diffus sind. Zuerst wird eine Oberflächenrepräsentation mit Voronoi-Diagrammen vorgestellt, die es erlaubt beim Progressive Refinement Radiosity-Verfahren die Oberflächen adaptiv zu unterteilen, ohne dass die aus der Literatur bekannten Probleme auftreten. Dann wird ein Verfahren zur Berechnung von Schatten- und Halbschatten-Bereichen besprochen. Dieses Verfahren konstruiert eine Oberflächen-Repräsentation, die auf die verschiedenen Diskontinuitäten der Helligkeitsfunktion auf einer Oberfläche Rücksicht nimmt. Durch die neu vorgestellte Kombination der beiden Verfahren kann nun sowohl die Helligkeitsfunktion auf den Oberflächen sehr exakt approximiert werden, als auch die Radiosity von diesen Flächen genau weiterverteilt werden. Dadurch wird das Problem der diffusen globalen Beleuchtung gelöst. Zusätzlich wird eine Methode vorgestellt, die es erlaubt, nur die relevanten Diskontinuitäten zu berechnen, wodurch eine Beschleunigung des Verfahrens erzielt wird.},
keywords = {rendering, global illumination},
note = {Dissertation, in German},
}
@mastersthesis{stuerzlinger1989ccompiler,
title = {C-Compiler für den VIP-Prozessor},
author = {Stürzlinger, Wolfgang},
school = {Vienna University of Technology, Austria},
year = {1989},
month = {Nov},
url = {https://catalogplus.tuwien.at/permalink/f/qknpf/UTW_alma2145146200003336},
abstract = {An der Technischen Universität Wien ist in den Jahren 1985 bis 1988 das VIP-System ("Vienna Integrated Prolog") entstanden. Speziell für die schnelle Interpretation der Prolog-Programme wurde nun dazu der VIP-Prozessor entworfen. Beim Design des Prozessors wurden, um den Durchsatz zu steigern, einige RISC-Technologien verwendet. Vienna Integrated Prolog ist in der Programmiersprache C implementiert. Zur Portierung auf den VIP-Prozessor wurde nun ein Entwicklungssystem benötigt. Im Rahmen dieser Arbeit wurde ein existierender C-Compiler auf den Prozessor angepasst. Als Compiler wurde ein Produkt der Free Software Foundation ausgewählt, das unter dem Namen GNU-C bekannt ist. Dieser optimierende Compiler ist durch das Erstellen einer sogenannten Maschinenbeschreibung auf einen neuen Prozessor portierbar. Der Compiler wird kontinuierlich erweitert und ist kostenlos erhältlich.},
keywords = {compiler, optimization},
note = {Diplomarbeit, in German},
}

3D Visualization
For some types of data, including spatio-temporal data, 3D visualizations have been shown to offer clear benefits. We investigate how interaction with such 3D visualizations, including Space-Time Cubes, can facilitate Visual Analytics processes.
@comment{c, c={STYLE: Author entry should be in "[von] Last [Jr.], First and ..." format}}
@comment{c, c={STYLE: Author trailing* on last name is grad, trailing+ is undergrad student}}
@comment{c, c={STYLE: no year or series or publisher name in booktitle}}
@comment{c, c={STYLE: series should have format "ACRONYM '##", with 2-digit year}}
@comment{c, c={STYLE: conference articles published in journal have conference name in note= and journal acronym in series=}}
@comment{c, c={STYLE: articleno= and numpages= are both supported}}
@comment{c, c={STYLE: pdf= is link to PDF, video= is link to video, teaser= is link to teaser image}}
@comment{c, c={STYLE: doi= is link to doi (or publisher page), url= is link to webpage}}
@comment{c, c={STYLE: note= shows up in the list, footnote= shows up in the individual pages}}
@comment{c, c={STYLE: footnote= is the right place for pdf2, url2, video2, other supplementary materials, etc.}}
@comment{c, c={STYLE: to comment out a field, just prefix it with "commented-", e.g., "commented-year"}}
@comment{c, c={canonical field order: 'title', 'author', 'journal', 'booktitle', 'publisher', 'series', 'issn', 'isbn', 'institution', 'school', 'type', 'howpublished', 'year', 'month', 'volume', 'number', 'pages', 'articleno', 'numpages', 'doi', 'url', 'pdf', 'video', 'teaser', 'abstract', 'keywords', 'award', 'note', 'footnote'}}
@comment{***************************books&special_issues*******************************}
@comment{zachman2025special,
title = {Special Section on the Best Papers of the 20th EuroXR International Conference (EuroXR 2023)},
author = {Walczak, Krzysztof and Zachmann, Gabriel and Niamut, Omar A. and Johnsen, Kyle and Stuerzlinger, Wolfgang and Bourdot, Patrick and Welch, Greg and Alcaniz Raya, Mariano},
journal = {Computers & Graphics},
publisher = {Elsevier},
series = {C&G},
year = {2025},
month = {Nov},
commented-volume = {48},
commented-number = {C},
pages = {1-2},
commented-doi = {https://doi.org/10.1016/j.cag.2025.00.000},
abstract = {We are delighted to introduce this special section of Computers & Graphics, which presents extended versions of the best papers selected from the 20th EuroXR International Conference (EuroXR 2023). The conference was held in Rotterdam, The Netherlands, from November 29 to December 1, 2023, co-located with the Immersive Tech Week. It continues a rich tradition of EuroXR events focused on advances in Virtual, Augmented, and Mixed Reality (VR, AR, MR), collectively referred to as Extended Reality (XR). Since its inception in 2004 under the INTUITION Network of Excellence and subsequent evolution into the EuroXR International Conference, the event has consistently served as a platform to present cutting-edge research, foster collaborations among academia, industry, and public institutions, and promote the adoption of XR technologies across various domains.
The scientific track of EuroXR 2023 maintained a rigorous review process to ensure high quality and impact. A total of 42 papers were submitted to the scientific program, out of which 14 were accepted (an acceptance rate of 33%) across different categories: long, medium, and short papers. Each submission underwent a thorough double-blind peer review process by at least three independent experts, followed by a rebuttal phase and final discussions among the reviewers. The scientific program chairs then made final decisions based on comprehensive meta-reviews. A dedicated Best Papers Awards Committee subsequently evaluated the accepted papers, identifying outstanding contributions, which were then invited for significant extension and re-review for publication in this special section of Computers & Graphics.
The two articles presented here exemplify the diversity and high quality of research at EuroXR 2023:
Enhancing anatomy learning through collaborative VR? An advanced investigation by Haya Almaree, Roland Fischer, René Weller, Verena Uslar, Dirk Weyhe, and Gabriel Zachmann explores the potential benefits of collaborative VR learning environments in medical education. The authors developed a multi-user VR Anatomy Atlas and conducted two comprehensive user studies comparing individual and collaborative learning modes. Their findings offer valuable insights into the effectiveness, usability, and motivational aspects of collaborative VR learning, suggesting that although collaboration does not necessarily enhance learning outcomes or motivation in anatomy education, it opens important questions regarding cognitive load and system usability that require further research.
Psychophysiology of rhythmic stimuli and time experience in virtual reality by Stéven Picard and Jean Botev investigates how rhythmic auditory and visual stimuli influence users' perception of time and task performance within VR environments. The authors systematically analyze the interplay between sensory stimuli, physiological responses (such as eye-tracking data and body temperature), and subjective time estimation. Their results reveal nuanced relationships between stimulus modality, tempo, fatigue, and time perception, offering promising directions for designing VR environments that strategically modulate user experience through rhythm and sensory cues.
Collectively, these papers highlight valuable advancements at the intersection of XR technology, human factors, education, and psychophysiology. They demonstrate how XR can be leveraged not only to improve learning and interaction but also to deepen our understanding of human cognitive and sensory experiences in immersive contexts.
We express our sincere gratitude to all the authors for their outstanding contributions and to the reviewers for their thorough work in maintaining the high standards of Computers & Graphics. We also extend special thanks to the EuroXR 2023 Organizing Committee and the Immersive Tech Week team for hosting a vibrant conference that successfully bridged research, practice, and innovation in Extended Reality.
For further information about EuroXR and future conferences, please visit the official EuroXR Association website at https://www.euroxr-association.org.
We hope that readers will find these contributions as inspiring and thought-provoking as we did.},
keywords = {3D user interfaces, virtual reality, augmented reality},
note = {To appear},
}
@proceedings{zachman2023euroxr,
title = {Virtual Reality and Mixed Reality, 20th EuroXR International Conference},
author = {Zachmann, Gabriel and Walczak, Krzysztof and Niamut, Omar A. and Johnsen, Kyle and Stuerzlinger, Wolfgang and Alcaniz Raya, Mariano and Bourdot, Patrick and Welch, Greg},
publisher = {Springer},
series = {EuroXR '23},
volume = {LNCS 14410},
year = {2023},
month = {Nov},
doi = {https://doi.org/10.1007/978-3-031-48495-7},
teaser = {teasers/EuroXR23.png},
abstract = {We are pleased to present in this LNCS volume the scientific proceedings of the 20th EuroXR International Conference (EuroXR 2023), organized in colocation with the Immersive Tech Week, Rotterdam, the Netherlands, and held during November 29 – December 1, 2023.
This conference follows a series of successful international conferences initiated in 2004 by the INTUITION Network of Excellence on Virtual and Augmented Reality, which was supported by the European Commission until 2008. From 2009 through 2013, it was embedded in the Joint Virtual Reality Conferences (JVRC). Since then, it was known as EuroVR, then EuroXR International Conference, in line with the renaming of the umbrella association.
The focus and aim of the EuroXR conferences is to present, each year, novel results and insights in Virtual Reality (VR), Augmented Reality (AR), and Mixed Reality (MR), commonly referred to under the umbrella of Extended Reality (XR), including software systems, immersive rendering technologies, 3D user interfaces, and applications. EuroXR also aims to foster engagement between European industries, academia, and the public sector, to promote the development and deployment of XR techniques in new and emerging, but also in existing fields. To this end, all EuroXR conferences include not only a scientific track, but also an application-oriented track, with its own proceedings.
Since 2017, the EuroXR Association has collaborated with Springer to publish the proceedings of the scientific track of its annual conference. In order to maintain the scientific standards to be expected from such a conference, we established a number of committees overseeing the process of creating a scientific program: the scientific program chairs, leading an International Program Committee (IPC) made up of international experts in the field, and the EuroXR academic task force.
For the 2023 issue, a total of 42 papers were submitted, out of which 14 papers were accepted (4 long, 8 medium, and 2 short papers). This amounts to an acceptance ratio of 33%. The selection process involved a double-blind peer-review process (each and every paper was reviewed by at least 3 members of the IPC, in many cases even 4), followed by a rebuttal phase, and a final discussion and scoring phase amongst the revewiers. Based on the review reports, the scores, and the reviewers’ discussions, the scientific program chairs took the final decision and wrote a meta-review for each paper.
This year, the scientific program of EuroXR and, hence, this LNCS volume, is organized into three sections: Interaction in Virtual Reality, Designing XR Experiences, and Human Factors in VR: Performance, Acceptance, and Design.
In addition to the regular scientific papers track, EuroXR invited three keynote speakers: Tabitha C. Peck (Davidson College, Davidson, NC, USA), Ferran Argelaguet (Research Scientist, Hybrid team, IRISA/Inria, Rennes, France), and Zerrin Yumak (Assistant Professor of Utrecht University, The Netherlands). Furthermore, the conference hosted an application track, demos and posters sessions, and lab tours. Finally, there were dedicated sessions, for instance, by Greg Welch on VERA, and a workshop on “Vocational Training”.
We would like to thank all the IPC members and external reviewers for their insightful reviews, which helped ensure the high quality of papers selected for the scientific track. Furthermore, we would like to thank the application chairs, demos and posters chairs, and the local organizers of EuroXR 2023.
We are also grateful to the staff of Springer for their support and advice during the preparation of this LNCS volume.},
keywords = {virtual reality, augmented reality, extended reality},
}
@proceedings{teather2020vrstproceedings,
title = {26th Symposium on Virtual Reality Software and Technology 2020},
author = {Teather, Robert J. and Joslin, Chris and Stuerzlinger, Wolfgang and Figueroa, Pablo and Hu, Yaoping and Batmaz, Anil Ufuk and Lee, Wonsook and Ortega, Francisco},
publisher = {ACM},
series = {VRST '20},
year = {2020},
month = {Nov},
doi = {https://doi.org/10.1145/3385956},
teaser = {teasers/VRST2020.png},
abstract = {Welcome to the 26th ACM Symposium on Virtual Reality Software and Technology (VRST 2020) for exchanging knowledge and experience. It is our pleasure to virtually host VRST 2020 from Ottawa, Canada, for the safety of attendees, due to the on-going COVID-19 pandemic.
As a premier international forum for advanced in virtual reality technology, VRST 2020 received 132 paper submissions from all continents. Its program committee (PC) consisted of 27 esteemed researchers to coordinate additional 176 expert reviewers. Each submission underwent at least three reviews for its novelty, technical quality, and impact to the field. The final program of VRST 2020 was thus composed of 28 full papers and 7 short papers, yielding an overall acceptance rate of 26%. The topics of these papers ranged from simulation & graphics, 3D reconstruction & computer vision, haptics, navigation & locomotion, collaborations, avatars, and display & visual perception, to applications. In addition, a total of 59 posters and demos were submitted, and 43 of these were accepted to the technical program.
Moreover, the program was honoured by two distinguished keynote speakers: Doug Bowman from Virginia Tech University (USA) and Mary Whitton of the University of North Carolina at Chapel Hill (USA). As two of the foremost names in the field of virtual reality, they presented stimulating insights to energize the program and provide invaluable insights to new and seasoned researchers alike.
Special thanks are extended to the PC members and expert reviewers for all their dedicated efforts and thoughtful reviews. Their hard work uniquely empowered the program to be interesting.
We hope that attendees will find VRST 2020 inspiring, as it spotlights the latest research in the growing field of Virtual Reality. The event aims to foster collaboration and instigate further growth in this exciting field.},
keywords = {3D user interfaces, virtual reality},
}
@book{marriott2018immersiveanalytics,
title = {Immersive Analytics},
author = {Marriott, Kim and Schreiber, Falk and Dwyer, Tim and Klein, Karsten and Henry Riche, Nathalie and Itoh, Takayuki and Stuerzlinger, Wolfgang and Thomas, Bruce H.},
publisher = {Springer},
year = {2018},
month = {Oct},
volume = {LNCS 11190},
numpages = {371},
doi = {https://doi.org/10.1007/978-3-030-01388-2},
teaser = {teasers/iabook.png},
abstract = {We live in an age where the amount and complexity of data available to us far surpass our ability to understand or to utilise them in decision-making. Analysis of such data is not only common in the physical, social, and life sciences, but is becoming an integral part of effective planning in business, government, e-health, and many other aspects of modern society. Furthermore data analytics is no longer solely the preserve of scientists and professional analysts as personalised data analytics becomes increasingly common.
Visual analytics has become a key technology for human-in-the-loop data analysis. While the standard definition for visual analytics is agnostic of the actual interface devices employed by visual analytics systems, the affordances of the display and input devices used for analysing data strongly affect the experience of the users of such systems and, thereby, their degree of engagement and productivity. For practical visual analytics tools, the platform for interaction is almost always a standard desktop computer. A systematic approach to developing analysis and decision support tools that move beyond the desktop is lacking.
Immersive analytics is a new interdisciplinary field that brings together researchers and practitioners from data visualisation, visual analytics, virtual and mixed reality, human–computer interaction, and human-in-the-loop algorithmics to explore these new forms of analytics tools. The goal is to remove barriers between people, their data, and the tools they use for analysis by developing more engaging, embodied analysis tools that support data understanding and decision-making everywhere and by everyone, either working individually or collaboratively.
This book is the outcome of two coordinated workshops on immersive analytics held in 2016. The first in Shonan, Japan, took place in February and organised by Takayuki Itoh, Kim Marriott, Falk Schreiber, and Uwe Wössner with the help of Karsten Klein, the second was held in June at Dagstuhl, Germany, and was organised by Tim Dwyer, Nathalie Henry Riche, Wolfgang Stuerzlinger, and Bruce H. Thomas, again with the help of Karsten Klein. In all, 25 leading international experts in data visualisation, visual analytics, human–computer interaction, virtual reality and augmented reality attended the first workshop, with another 38 experts attending the second. There was a sizeable overlap of experts between the two workshops that provided a sensible continuity of concepts.
The two workshops explored the definition of immersive analytics and identified the structure and focus of this book. A working group for each chapter was formed at the workshops, with the participation of invited experts as needed, and the groups wrote the chapters contained in this book. A critical goal was to develop a vision of the research domain for immersive analytics and a roadmap for future investigations. Authors submitted manuscripts for their chapters in mid-2017. These initial versions were first reviewed "internally" by one of the book editors. After an initial round of revision based on these internal reviews, the updated manuscripts were sent to expert reviewers invited from the community. We are grateful to these people for their detailed and insightful reviews.},
keywords = {immersive analytics, visual analytics, visualization},
}
@proceedings{arif2018socio,
title = {Socio-Technical Aspects of Text Entry: {MobileHCI} 2018 Workshop},
author = {Arif, Ahmed Sabbir and Stuerzlinger, Wolfgang and Dunlop, Mark D. and Yi, Xin and Seim, Caitlyn},
series = {TEXT '18},
year = {2018},
month = {Sep},
url = {http://ceur-ws.org/Vol-2183},
teaser = {teasers/TEXT2018.png},
abstract = {Mobile text entry has become an integral part of our daily life. We regularly input text on smartphones, laptops, desktops and increasingly on smartwatches, VR systems, interactive tabletops/walls, and kiosks. This text entry is done in all social settings, from solo individuals writing private notes, through social networking in bars with friends, to jointly writing on collaborative devices in public spaces. Traditional tap-based input is increasingly being replaced with or supplemented by voice input or multimodal control. With the ubiquity of text entry, it is becoming increasingly important to consider socio-technical systems perspectives in the design, development, and evaluation of new techniques. The purpose of this one-day workshop is to share and encourage research exploring various socio-technical aspects of text entry, including social and cultural impacts, developing socially and culturally acceptable techniques, and techniques to support all users of varying ages, social and technical backgrounds, language, and physical abilities.},
keywords = {text entry},
}
@proceedings{banic2015suiproceedings,
title = {3rd Symposium on Spatial User Interaction 2015},
author = {Banic, Amy and Suma, Evan and Steinicke, Frank and Stuerzlinger, Wolfgang},
publisher = {ACM},
series = {SUI '15},
year = {2015},
month = {Aug},
doi = {https://doi.org/10.1145/2788940},
teaser = {teasers/SUI2015.png},
abstract = {It is our great pleasure to welcome you to the third ACM Symposium on Spatial User Interaction. This event focuses on the user interface challenges that appear when users interact in the space where the flat, two-dimensional, digital world meets the volumetric, physical, three-dimensional (3D) space we live in. The symposium considers both spatial input as well as output, with an emphasis on the issues around the interaction between humans and systems. Due to the advances in 3D technologies, spatial interaction is now more relevant than ever. Powerful graphics engines and high-resolution screens are now ubiquitous in everyday devices, such as tablets and mobile phones. Moreover, new forms of input, such as multi-touch, finger and body tracking technologies are now easily available, and more and more commercial 3D systems with spatial interaction capabilities exist, many priced at the consumer level. However, the challenges, limitations, and advantages of leveraging this third dimension in human-computer interfaces are still not yet fully understood. These questions will only become more relevant as these emerging technologies continue to cross the barrier towards wide adoption.
The call for papers attracted 48 submissions from Asia, Europe, Australia, and North and South America in all areas of Spatial User Interaction research. The international program committee consisting of 19 experts in the topic areas and the three program chairs handled the review process. Eight submissions were reviewed by the program chairs and rejected without further review due to being incomplete, insufficient quality, or inappropriate for the symposium topic. All other submissions received at least four detailed reviews, two from members of the international program committee and two or more from external reviewers. The reviewing process was double-blind, with the authors' identities visible only to the program chairs and the primary program committee member assigned to the paper. In the end, the program committee accepted 17 papers (10 long, 7 short), corresponding to an overall acceptance rate of 35%. Additionally, 11 posters complement the program and appear in the proceedings. Furthermore, three research demonstrations were accepted and will be presented at the symposium. We also encourage attendees to attend the keynote talk, TRANSFORM: Beyond Tangible Bits, Towards Radical Atoms, presented by Hiroshi Ishii from the MIT Media Lab.},
keywords = {3D user interfaces, virtual reality},
}
@article{steinicke2015spatial,
title = {Spatial Interfaces},
author = {Steinicke, Frank and Stuerzlinger, Wolfgang},
journal = {Computer Graphics and Applications},
publisher = {IEEE},
series = {CG&A},
year = {2015},
month = {Jul},
volume = {35},
number = {4},
pages = {6-7},
doi = {https://doi.org/10.1109/MCG.2015.92},
abstract = {CG&A welcomes Frank Steinicke (University of Hamburg) and Wolfgang Stuerzlinger (Simon Fraser University) as new members to its editorial board and as the new coeditors of the Spatial Interfaces department.},
keywords = {3D user interfaces, virtual reality},
}
@article{steinicke2015special,
title = {Special Section on Spatial User Interaction},
author = {Steinicke, Frank and Stuerzlinger, Wolfgang and Suma, Evan},
journal = {Computers & Graphics},
publisher = {Elsevier},
series = {C&G},
year = {2015},
month = {May},
volume = {48},
number = {C},
pages = {A1-A2},
doi = {https://doi.org/10.1016/j.cag.2015.03.002},
abstract = {It is our great pleasure to present you with the Computers & Graphics special section on Spatial User Interaction (SUI). The special section contains extended versions of the best scientific papers from the 2nd ACM Symposium on Spatial User Interaction (SUI׳14), which was held Oct. 4–5, 2014 in Honolulu, USA. The SUI symposium focuses on the user interface challenges that appear when users interact in the space where the flat, two-dimensional, digital world meets the volumetric, physical, three-dimensional (3D) space we live in. This considers both spatial input as well as output, with an emphasis on the issues around the interaction between humans and systems. The goal of the symposium is to provide an intensive exchange between academic and industrial researchers working in the area of SUI and to foster discussions among participants.
The symposium call for papers attracted 62 submissions from Asia, Europe, Australia, and North and South America in all areas of Spatial User Interaction research. The international program committee consisting of 19 experts in the topic areas and the two program chairs handled the highly competitive and selective review process. In the end, the program committee accepted overall 18 (11 long papers plus 7 short papers) out of 62 submissions, which corresponds to an acceptance rate of 29% in total.
The SUI׳14 award chairs, Bruce Thomas from the University of South Australia and Patrick Baudisch from the Hasso-Plattner-Institut in Germany, selected the best full and best short papers from these 18 submissions, which received the invitation to be published as extended articles in this special section:
The article "Coordinated 3D Interaction in Tablet- and HMD-Based Hybrid Virtual Environments" written by Jia Wang, Robert Lindeman proposes a novel spatial interactive solution using a coordinated, tablet- and HMD-based, hybrid virtual environment system.
The article "Principles, Interactions and Devices for Real-World Immersive Modeling" co-authored by Mark Mine, Arun Yoganandan, and Dane Coffey presents an approach that combines the natural and intuitive power of virtual reality interaction, the precision and control of 2D touch surfaces, and the richness of a commercial modeling package.
The article "VideoHandles: Searching through Action Camera Videos by Replicating Hand Gestures" by Jarrod Knibbe, Sue Ann Seah, and Mike Fraser introduces a detailed exploration of VideoHandles, a novel interaction technique to support rapid review of wearable video camera data by re-performing gestures as a search query.},
keywords = {3D user interfaces, virtual reality},
}
@proceedings{steinicke2014suiproceedings,
title = {2nd Symposium on Spatial User Interaction 2014},
author = {Steinicke, Frank and Stuerzlinger, Wolfgang and Suma, Evan},
publisher = {ACM},
series = {SUI '14},
year = {2014},
month = {Oct},
doi = {https://doi.org/10.1145/2659766},
teaser = {teasers/SUI2014.png},
abstract = {It is our great pleasure to welcome you to the second ACM Symposium on Spatial User Interaction - SUI'14. This event focuses on the user interface challenges that appear when users interact in the space where the flat, two-dimensional, digital world meets the volumetric, physical, threedimensional (3D) space we live in. This considers both spatial input as well as output, with an emphasis on the issues around the interaction between humans and systems. The goal of the symposium is to provide an intensive exchange between academic and industrial researchers working in the area of SUI and to foster discussions among participants. The SUI symposium was held October 4-5, 2014, in Honolulu, USA.
The call for papers attracted 62 submissions from Asia, Europe, Australia, and North and South America in all areas of Spatial User Interaction research. The international program committee consisting of 19 experts in the topic areas and the three program chairs handled the highly competitive and selective review process. Every submission received at least four detailed reviews, two from members of the international program committee and two or more from external reviewers. The reviewing process was double-blind, where only the program chairs as well as the program committee member, who was assigned to each paper to identify external reviewers, knew the identity of the authors. In the end, the program committee accepted overall 18 (11 long papers plus 7 short papers) out of 62 submissions, which corresponds to an acceptance rate of 29% in total. Additionally, 25 posters complement the program and appear in the proceedings. Furthermore, several demos were presented at the symposium. The topics range from spatial interaction techniques, gestures, vision in 3D space, spatial applications, to interaction with multi-touch technologies and spatial interaction in augmented reality. We hope that these proceedings will serve as a valuable reference for Spatial User Interaction researchers and developers.},
keywords = {3D user interfaces, virtual reality},
}
@proceedings{daiber2013isis3dproceedings,
title = {Interactive Surfaces for Interaction with Stereoscopic {3D}: Tutorial and Workshop at {ITS} 2013},
author = {Daiber, Florian and de Araujo, Bruno Rodrigues and Steinicke, Frank and Stuerzlinger, Wolfgang},
booktitle = {Conference on Interactive Tabletops and Surfaces},
publisher = {ACM},
series = {ISIS3D '13},
year = {2013},
month = {Oct},
pages = {483–486},
doi = {https://doi.org/10.1145/2512349.2512351},
abstract = {With the increasing distribution of multi-touch capable devices multi-touch interaction becomes more and more ubiquitous. Multi-touch interaction offers new ways to deal with 3D data allowing a high degree of freedom (DOF) without instrumenting the user. Due to the advances in 3D technologies, designing for 3D interaction is now more relevant than ever. With more powerful engines and high resolution screens also mobile devices can run advanced 3D graphics, 3D UIs are emerging beyond the game industry, and recently, first prototypes as well as commercial systems bringing (auto-) stereoscopic display on touch-sensitive surfaces have been proposed. With the Tutorial and Workshop on ``Interactive Surfaces for Interaction with Stereoscopic 3D (ISIS3D)'' we aim to provide an interactive forum that focuses on the challenges that appear when the flat digital world of surface computing meets the curved, physical, 3D space we live in.},
keywords = {3D user interfaces, virtual reality},
}
@proceedings{stuerzlinger2013suiproceedings,
title = {1st Symposium on Spatial User Interaction 2013},
author = {Stuerzlinger, Wolfgang and Steinicke, Frank},
publisher = {ACM},
series = {SUI '13},
year = {2013},
month = {Jul},
doi = {https://doi.org/10.1145/2491367},
teaser = {teasers/SUI2013.png},
abstract = {It is our great pleasure to welcome you to the first ACM Symposium on Spatial User Interaction - SUI'13. This new event focuses on the user interface challenges that appear when users interact in the space where the flat, twodimensional, digital world meets the volumetric, physical, three-dimensional (3D) space we live in. This considers both spatial input as well as output, with an emphasis on the issues around the interaction between humans and systems. The goal of the symposium is to provide an intensive exchange between academic and industrial researchers working in the area of SUI and to foster discussions among participants. The first SUI symposium was held July 20-21, 2013 in Los Angeles, USA.
The call for papers attracted 31 submissions from Asia, Europe, Australia, and North and South America in all areas of Spatial User Interaction research. The international program committee consisting of 15 experts in the topic areas and the two program chairs handled the highly competitive and selective review process. Every submission received at least four detailed reviews, two from members of the international program committee and two or more from external reviewers. The reviewing process was double-blind, where only the program chairs as well as the program committee member, who was assigned to each paper to identify external reviewers, knew the identity of the authors.
In the end, the program committee accepted overall 12 (8 full papers plus 4 short papers) out of 31 submissions, which corresponds to an acceptance rate of 26% for full papers (and 38% in total). Additionally 12 posters and demonstrations will complement the program and appear in the proceedings. The topics range from spatial interaction techniques, vision in 3D space, applications, to interaction with multi-touch technologies and in augmented reality. We hope that these proceedings will serve as a valuable reference for Spatial User Interaction researchers and developers.
Putting together the content for SUI'13 was a team effort. We first thank the authors for providing the content of the program. Special thanks go to the members of the international program committee, who successfully dealt with the reviewing load. We also thank the external reviewers.},
keywords = {3D user interfaces, virtual reality},
}
@proceedings{stuerzlinger2012vrstproceedings,
title = {Symposium on Virtual Reality Software and Technology 2012},
author = {Stuerzlinger, Wolfgang and Latoschik, Marc Erich and Kapralos, Bill},
publisher = {ACM},
series = {VRST '12},
year = {2012},
month = {Dec},
doi = {https://doi.org/10.1145/2407336},
teaser = {teasers/VRST2012.png},
abstract = {It is our great pleasure to welcome you to the 2012 ACM Symposium on Virtual Reality Software and Technology - VRST'12. VRST has become one of the major scientific events in the area of virtual reality since its debut in 1994 in Singapore. The symposium continues its tradition as an international forum for the presentation of research results and experience reports on leading edge issues of software, hardware and systems for Virtual Reality. The mission of the symposium is to share novel technologies that fulfill the needs of Virtual Reality applications and environments and to identify new directions for future research and development. VRST gives researchers and practitioners a unique opportunity to share their perspectives with others interested in the various aspects of Virtual Reality and owes its existence to a vibrant and productive research community. This year, VRST was held December 10-12, 2012 in Toronto, Ontario, Canada.
The call for papers attracted 88 submissions from Asia, Europe, Australia, and North and South America in all areas of Virtual Reality research. Particular attention was given to work on system with a special track focusing on architectures, frameworks, reusability, adaptivity, and performance testing and evaluation. An international program committee consisting of 16 experts in the topic areas and the three program chairs handled the highly competitive and selective review process. Almost every submission received four or more reviews, two from members of the international program committee and two from external reviewers. Reviewing was double-blind, where only the program chairs and the program committee member assigned to identify external reviewers knew the identity of the authors.
In the end, the program committee was able to accept 25 out of 88 submissions, which corresponds to an acceptance rate of 28%. For posters, 15 out of 32 submissions will appear in the proceedings. The topics range from tracking, augmented and mixed reality, interaction, navigation and locomotion, collaboration, haptics, simulation, agents and behaviors to two sessions for a systems track. We hope that these proceedings will serve as a valuable reference for Virtual Reality researchers and developers.},
keywords = {virtual reality, 3D user interfaces},
}
@article{bowman2009special,
title = {Special Issue on Current Trends in {3D} User Interface Research},
author = {Bowman, Doug and Fröhlich, Bernd and Kitamura, Yoshifumi and Stuerzlinger, Wolfgang},
journal = {Int. Journal of Human-Computer Studies},
publisher = {Elsevier},
series = {IJHCS},
year = {2009},
month = {Mar},
volume = {67},
number = {3},
pages = {223-224},
doi = {https://doi.org/10.1016/j.ijhcs.2008.10.003},
abstract = {Hardware, software, and in particular users now seem ready to engage with computer-generated 3D worlds and the appropriate 3D user interfaces (3D UIs) for interacting with such worlds. 3D UIs have traditionally only been used in very specific application domains such as virtual reality (VR) and augmented reality (AR) environments, digital content creation (DCC) systems, computer-aided design (CAD) systems, visualization systems, and computer games. Now they are beginning to appear in operating systems, on personal digital assistants (PDAs) and mobile phones, and in console gaming systems (e.g., Nintendo's Wii). Even 3D cinema has been given a second chance, and stereoscopic versions of movies are produced on a regular basis. Consequently, new television systems are being equipped with 3D functionality. These examples show that the demand for and the use of 3D UIs is significantly increasing.
The IEEE Symposium on 3D User Interfaces (3DUI) was established in 2006 following two successful workshops—the 2004 workshop "Beyond Wand and Glove Based Interaction" and the 2005 workshop "New Directions in 3D User Interfaces." Today, the 3DUI symposium is the premier conference for all types of 3D user interface research for desktop and off-the-desktop environments, including novel input device designs, interaction techniques, evaluation methods, and user studies.
In this special issue of IJHCS, we are pleased to present extended versions of three outstanding papers that were originally presented at the 3DUI 2007 and 3DUI 2008. An additional paper resulting from an open call was also accepted to this special issue.
The first paper, by Hachet et al. (2009), describes a set of widgets that provide a comprehensive solution for point of interest (POI) navigation in 3D environments. It allows users to quickly navigate to a particular view, explore a 3D scene, or investigate a single object in detail, and it can be used on a variety of display devices. These basic concepts are also extended to other uses beyond navigation alone.
The work by Vanacken et al. (2009) presents two new 3D selection techniques, 3D Bubble Cursor and Depth Ray. Both are targeted at selection in dense and occluded 3D virtual environments. The user studies vary both environment density and target visibility to evaluate the new techniques against a standard 3D point cursor. The effect of auditory and haptic feedback on the selection process is also investigated in a study. The results show that the new techniques enable efficient selection of hidden objects.
The paper by Pusch et al. (2009) presents a new method for providing a pseudo-haptic sensation in an augmented reality setting. The central idea is to displace the virtual representation of the hand from the actual position of the real hand depending on the strength of a virtual flow field. When a user places the hand in a virtual flow field and tries to maintain the hand's position at a cued location, a flow pressure-like sensation is perceived. Experimental results show that different force field strength levels can be discriminated.
Finally, Sharlin et al. (2009) present a novel system and a set of measures for assessing cognitive mapping abilities in the context of a wayfinding task. The hardware setup consists of a projection display for the presentation of virtual environments and a tangible tabletop interface for building a physical model of a seen environment. The cognitive mapping abilities of the users are assessed by recording and analyzing the building progress of the physical model. Since this setup has proven to be sensitive to factors affecting cognitive mapping it allows the computer-supported assessment of this important human ability.
All of these papers contain high-quality contributions to the growing field of 3D user interfaces. We thank the authors for their stimulating work and the reviewers for their constructive and detailed comments.},
keywords = {3D user interfaces, virtual reality},
}
@comment{c, c={leave the "_stuerzlinger" in the ID to enable umlaut-free search!}}
@proceedings{coquillart_stuerzlinger20083duiproceedings,
title = {Symposium on {3D} User Interfaces 2008},
author = {Coquillart, Sabine and Stürzlinger, Wolfgang and Kiyokawa, Kiyoshi},
publisher = {IEEE},
series = {3DUI '08},
year = {2008},
month = {Mar},
doi = {https://doi.org/10.1109/3DUI.2008.4476581},
teaser = {teasers/3DUI2008.png},
abstract = {Welcome to the IEEE Symposium on 3D User Interfaces 2008 (3DUI 2008), organized in Reno, Nevada on March 8-9, 2008. The symposium is co-located with IEEE Virtual Reality 2008 and with the symposium on Haptic Interfaces. 3DUI 2008 is the third international symposium focused on the topic of 3D UIs. It builds on successful 3DUI workshops in 2004 and 2005, as well as the IEEE 3DUI Symposiums in 2006 and 2007. Although a recent area of research, 3DUI is already a very well established topic and rapidely expanding. The submissions covered a variety of approaches ranging from handheld devices, desktop solutions, gesture, sound, haptics, augmented/mixed reality, to immersive systems.
This year, the program co-chairs received 67 submissions (45 papers and 22 technotes) in all areas of three-dimensional user interfaces. Each paper or technote was reviewed by at least two reviewers from the international program committee and two external reviewers. The review summary written by the primary reviewer provided the basis for a discussion among the reviewers when necessary. Reviewing was double-blind, i.e. the identity of the authors was known only to the program chairs and the program committee members responsible for choosing external reviewers for the submission. The acceptance rate was very selective at 28 % (31 % for papers and 23 % for technotes), and only 19 submissions were accepted (14 papers and 5 technotes). In addition, this year the proceedings also include 2 pages presentations for each of the 18 posters presented during the symposium.
We wish to thank all the persons who made 3DUI 2008 possible. Special thanks go to the program committee members and the reviewers for their insightful and thorough reviews of the submitted papers in a very short review period. We want to thank the posters chairs Raimund Dachselt, Robert Lindeman and Kouichi Matsuda who did handled the hard job of managing the posters. We also acknowledge the support by IEEE, the IEEE Visualization and Graphics Technical Committee as well as the VR steering committee. Most of the organization of IEEE 3DUI as well as local arrangement is shared with IEEE VR. We are grateful to Bill Sherman and the IEEE VR organizing committee for taking care of the organization of IEEE 3DUI 2008. Many thanks to James Stewart of Precision Conference Systems for his support of the reviewing process. Thanks also to Torsten Möllen and especially Meghan Haley for managing the printing process. Finally, we thank all the authors for their excellent submissions, without which this symposium could not exist.
We hope that this symposium will continue to connect researchers of all backgrounds in 3D user interface research and be enjoyable, interesting and stimulating for the participants. Please enjoy the 2008 3DUI Symposium !},
keywords = {3D user interfaces, virtual reality},
}
@proceedings{stuerzlinger20073duiproceedings,
title = {Symposium on {3D} User Interfaces 2007},
author = {Stürzlinger, Wolfgang and Kitamura, Yoshifumi and Coquillart, Sabine},
publisher = {IEEE},
series = {3DUI '07},
year = {2007},
month = {Mar},
doi = {https://doi.org/10.1109/3DUI.2007.340764},
teaser = {teasers/3DUI2007.png},
abstract = {Welcome to the IEEE Symposium on 3D User Interfaces 2007 (3DUI 2007), which took place in Charlotte, North Carolina on March 10-11, 2007. The symposium was held just before IEEE Virtual Reality 2007. The event owes its existence to a vibrant and productive research community in 3D user interfaces. This area has emerged from many different disciplines, including virtual reality, mixed and augmented reality, human-computer interaction, computer graphics, cognitive and perceptual psychology, and 3D games. 3DUI 2007 is sponsored by the IEEE Visualization and Graphics Technical Committee and is the second symposium in this series and follows two successful IEEE VR workshops on this topic in 2004 and 2005 as well as 3DUI 2006.
The program co-chairs received 81 submissions in all areas of three-dimensional user interfaces. The review process was highly competitive and selective. This year, we changed the review process and involved an international program committee consisting of 18 experts in 3D user interfaces. Each submission received at least 4 reviews, two of which were from members of the international program committee and two from external reviewers. Reviewing was double-blind this year, and the identity of the authors was known only to the program chairs and the program committee member responsible for choosing external reviewers for the submission. The program committee members were often able to solicit reviews from some of the top experts in a particular area of research. In the end, we were able to accept 18 full papers and 7 technotes (short papers), which corresponds to an acceptance rate of 31%. The accepted papers cover a wide range of topics in 3D user interfaces, including navigation, 3D movement, 3D selection, devices, gestures, mixed & augmented reality, force-feedback interfaces, and entertainment. We would like to thank all people who made 3DUI 2007 possible. Special thanks go to the program committee members who donated their time to ensure a fair selection process. Additional thanks go to the external reviewers who participated in the review process. We also acknowledge the support by IEEE, the IEEE Visualization and Graphics Technical Committee as well as the VR steering committee for support. Finally, we would like to thank Raimund Dachselt for handling the posters. Particular thanks go to IEEE VR's general chairs, especially Doug Bowman, for their great help with the organization of this event as well as the IEEE VR local arrangement chairs and other people involved in the local organization. Many thanks to James Stewart of Precision Conference Systems for his support of the reviewing process. Thanks also to Torsten Möller and especially Meghan Haley for creating the proceedings. Finally, we thank all the authors and researchers who submitted their work to the symposium.
We believe that 3DUI 2007 connects researchers of all backgrounds in 3D user interface research and collects and disseminates the best results in this area. Enjoy the symposium!},
keywords = {3D user interfaces, virtual reality},
}
@comment{c, c={leave the "_stuerzlinger" in the ID to enable umlaut-free search!}}
@proceedings{kitamura_stuerzlinger20063duiproceedings,
title = {Symposium on {3D} User Interfaces 2006},
author = {Kitamura, Yoshifumi and Bowman, Doug and Fröhlich, Bernd and Stürzlinger, Wolfgang},
publisher = {IEEE},
series = {3DUI '06},
year = {2006},
month = {Mar},
url = {https://ieeexplore.ieee.org/servlet/opac?punumber=10952},
teaser = {teasers/3DUI2006.png},
abstract = {We are extremely pleased and honored to present the proceedings of the First IEEE Symposium on 3D User Interfaces.
3DUI 2006 owes its existence to a vibrant and productive research community. Emerging from many different disciplines, such as virtual reality, mixed reality, computer graphics, human-computer interaction, and cognitive and perceptual psychology, 3D interaction has now become a coherent research area itself. Extremely successful workshops on this topic at IEEE Virtual Reality in 2004 and 2005 convinced us and the IEEE Visualization and Graphics Technical Committee that the time was right to give the 3D user interface community its own specialized venue. Our vision for the symposium is to connect researchers of all backgrounds working on 3D user interface issues, and to collect and disseminate the best 3D interaction research in the world.
Although this is the very first 3DUI symposium, the review of papers was highly competitive and selective. The program includes 18 full papers and 8 technotes (short papers), selected from 81 submissions (a 32% acceptance rate overall). The accepted papers cover a wide range of topics in 3D user interface, including navigation, applications and implementation, collaborative and bimanual interfaces, 3D interaction techniques, augmented reality and devices.
Dr. Ravin Balakrishnan of the University of Toronto will provide the keynote address for the Symposium. Dr. Balakrishnan is well-known for his research on effective and powerful 3D interaction techniques for emerging technologies such as volumetric displays and wall-sized displays. He is also a leader in the international human-computer interaction community. Dr. Balakrishnan's presentation will challenge researchers in 3D user interfaces to think more deeply about the application of their work to real-word problems.
We would like to thank all of the people who made this first-ever 3DUI Symposium possible. First, a big thank you to all of the dedicated reviewers who participated in the peer review process - your service helped to ensure the high quality of this technical program. Thanks are due to Simon Julier and Jim Chen, general chairs of IEEE VR 2006, who helped us make the transition from workshop to symposium smoothly and easily. We also thank the IEEE, the VGTC, and the VR steering committee for their support, as well as James Steward of Precision Conference Systems. Finally we thank all of the authors and researchers who submitted their work to the Symposium.
We trust that 3DUI 2006 will be the first in a long line of successful and influential events. Enjoy the Symposium!},
keywords = {3D user interfaces, virtual reality},
}
@comment{c, c={leave the "_stuerzlinger" in the ID to enable umlaut-free search!}}
@proceedings{bowman_stuerzlinger2005newdirections,
title = {New Directions in {3D} User Interfaces},
author = {Bowman, Doug and Fröhlich, Bernd and Kitamura, Yoshifumi and Stürzlinger, Wolfgang},
publisher = {Shaker Verlag},
year = {2005},
month = {Mar},
url = {https://www.shaker.de/de/content/catalogue/index.asp?lang=en&ID=8&ISBN=978-3-8322-3830-8},
pdf = {papers/3dui_workshop.pdf},
teaser = {teasers/3dui_workshop.png},
abstract = {This workshop focuses on novel research in three-dimensional user interfaces (3D UIs). The workshop builds on and expands the scope of last year's workshop "Beyond Wand and Glove Based Interaction." The theme of the workshop will again be on moving beyond the "common" and "traditional" (if one can use those words with respect to such a young research area) approaches to 3D UIs.
Just as wands, 3D mice, and gloves became traditional input devices for 3D UIs, a handful of well-known interaction techniques and UI metaphors also became de facto standards (often because they were the default interaction techniques in widely-used software toolkits). Most of these basic techniques, however, have been around for 5-10 years. Although this could certainly change, it seems that the discovery of radical new metaphors for the "universal 3D tasks" (navigation, selection, manipulation, system control) has slowed down significantly. This does not mean, however, that we should stop doing research on interaction techniques for these tasks. Rather, it means we have to improve the existing metaphors in subtle ways, experiment with the use of new devices, and consider the use of such techniques in specific domains or by specific types of users. Recent research has shown that there is still much to be learned in this area, and that current techniques can be enhanced to dramatically improve usability .
In this workshop, we will spotlight research that investigates novel and enhanced methods of 3D interaction for immersive virtual environments (VEs), augmented and mixed reality (AR/MR), and desktop 3D systems. Relevant topics include: 3D input devices, 3D display devices, 3D interaction techniques, 3D user interface metaphors, collaborative 3D interaction, evaluation methods for 3D UIs, application of existing devices/techniques in novel contexts (e.g. to AR, UbiComp, etc., migration of existing techniques to new display platforms.},
keywords = {3D user interfaces, virtual reality},
}
@book{stuerzlinger2003practical,
title = {Practical Programming in the Unix Environment},
author = {Stürzlinger, Wolfgang},
publisher = {Pearson Custom},
year = {2003},
month = {Jan},
teaser = {teasers/practicalprogramming.png},
abstract = {Today, software bugs are clearly a constant source of frustration with computers and also pose considerable security and safety concerns. While methods exist to prove the correctness of programs, they are not fully automatic and all requires significant training. Consequently, there is no real alternative to careful and systematic testing of programs to ensure that the software fulfills its designated function (even though testing cannot guarantee the absence of bugs). A further indication of the importance of this topic is that all accepted software development practices, such as Extreme Programming, require that programmers test their systems. While testing is taught abstractly in many courses, few students realized how important thorough testing is in practice. Only in the field do they gain this experience and learn the related skills. Hand in hand with testing goes debugging, the art of finding a problem based on observable symptoms and then fixing the problem. Last, but not least, optimization of programs is a skill that is often necessary for competitive systems.
When faced with the task of helping to re-design a second-year course on practical programming, I decided that C and UNIX were the right platform to teach many of the skills necessary for practical program development. Today, many students learn Java (or similar languages) in their first year, as this provides a relatively good and safe environment for learning the fundamental concepts. However, computer science students need to know how the layers underneath a high-level programming language work. C, besides being a high-performance environment and a prerequisite to C++, exposes students to these underlying layers and hence allows them to get a better understanding of how software works. Furthermore, a lot of safety layers (e.g., automatic handling of arithmetic overflows) are not present here, which makes this an ideal vehicle to teach the importance of testing. UNIX, with its cleverly designed file system, interactive shell and scripting languages, provides an excellent environment for systematic and repeated testing. The current implementation of the course teaches the importance of testing via strict enforcement of adherence to specifications in assignments. This is done with automatic, and hence objective, testing of assignments. As the test cases are revealed only after the deadline, this forces students to think very carefully about the robustness of their programs.
This textbook is designed to be used together with "The C Programming Language" by Kernighan & Ritchie. One of the most frustrating aspects of designing a course on practical programing is that there are very few textbooks that cover important skills, such as testing, debugging, optimization, the use of scripting languages, etc. with adequate examples. Fortunately, I found that parts of a book on the UNIX environment ("The UNIX Programming Environment" by Kernighan & Pike) and parts of a book on the practice of programming ("The Practice of Programming" by Kernighan & Pike) provide a good combination. Together, the new book covers most important issues for practical program development and hence forms a good basis for a course that focuses on such issues.
It is my hope that this book will help instructors to communicate practical programming skills as well as help students to develop better software.},
keywords = {programming},
}
@comment{c, c={leave the "_stuerzlinger" in the ID to enable umlaut-free search!}}
@article{heidrich_stuerzlinger2002special,
title = {Special Issue on Hardware-Accelerated Rendering Techniques},
author = {Heidrich, Wolfgang and Stürzlinger, Wolfgang},
journal = {Journal of Graphics Tools},
series = {JGT},
year = {2002},
month = {Dec},
volume = {7},
number = {4},
pages = {1-1},
doi = {https://doi.org/10.1080/10867651.2002.10487565},
teaser = {teasers/jgt4-2002.png},
abstract = {Real-time rendering systems are approaching a level of quality and economy that surpasses even the most elaborate offline rendering system available only ten years ago. As a consequence, hardware-accelerated rendering has had a strong impact on applications such as computer games, modeling and animation, design, and scientific visualization.
The aim of this special issue of the journal of graphics tools is to provide an overview of the state-of-the-art application of graphics hardware to problems in rendering, modeling, visualization, and other areas. One of the challenges in this area is to transform traditional algorithms into a form that adapts to the restrictions dictated by graphics hardware and takes advantage of its specific processing capabilities. These constraints often mandate significant changes or simplifications to the original algorithms, and sometimes lead to the development of new methods. Often it is possible to take a solution developed for solving a particular problem with the help of graphics hardware and to apply the ideas behind it to a completely different problem. This transfer of ideas is one of the motivations behind this special issue, which brings together work from a variety of application domains.
We received 33 submissions for this special issue, illustrating the recent interest in hardware-assisted techniques. From this, we selected 11 papers to be presented here. These represent a cross section of the different application areas for hardware-accelerated rendering. From realistic illumination algorithms to shadowing, from image-based rendering to non-photorealistic rendering, from digital imaging to digital halftoning, and from geometric modeling to collision detection, the papers in this special issue demonstrate the state-of-the art in hardware-assisted techniques. We hope you will enjoy these contributions as much as we did.},
keywords = {rendering, real-time},
}
@proceedings{stuerzlinger2002giproceedings,
title = {Graphics Interface 2002},
author = {Stürzlinger, Wolfgang and {McCool}, Mike},
publisher = {CHCCS and AK Peters},
series = {GI '02},
year = {2002},
month = {May},
url = {https://graphicsinterface.org/proceedings/gi2002},
teaser = {teasers/GI2002.png},
abstract = {Welcome to Graphics Interface (GI) 2002, a conference that combines coverage of original research results in both Human-Computer Interaction and Graphics. The conference took place in Calgary, Alberta, over 27-29 May 2002, and was held in conjunction with the Artificial Intelligence 2002 and Vision Interface 2002 conferences. GI 2002 is the 28th instance of the longest running conference series in human-computer interaction and computer graphics. This event has previously been held two times in Calgary: in 1977 and in 1991.
The program co-chairs received 96 submissions in all areas of human-computer interaction and computer graphics. The large number of submissions was a pleasant surprise; however, the number of submissions also necessitated an enlargement of the program committee on short notice. We are very grateful to all the additional program committee members who agreed to take time out of their busy schedules late in 2001. By agreeing to serve, these additional members reduced the workload on other committee members and permitted us to maintain our high reviewing standards.
The overall quality of the submissions was very high, which made the selection process difficult. After considerable deliberation, the program committee selected 25 papers for publication. The international program committee consisted of 20 people from around the world. Each paper received at least 4 reviews, two of which were from members of the program committee. The reviewing process was double-blind, and the identity of the authors was known only to program co-chairs and the program committee member responsible for choosing external reviewers for each submission. The program committee members were often able to solicit reviews from some of the topmost experts in a particular area of research. We greatly appreciate the effort of the members of the program committee. We would like to extend additional thanks to the 13 members of the program committee who attended the meeting at York University, Toronto, Canada on 16 February 2002 and funded their own travel.
Graphics Interface customarily has several invited speakers. This year three invited speakers were: Saul Greenberg, Professor at the University of Calgary; John Buchanan, Electronic Arts Canada and Adjunct Professor at the University of Alberta; and David Kirk, Chief Scientist at NVIDIA. We extend our gratitude to them for sharing their inspiration in their respective fields.
We would like to thanks James Stewart for his work on the PCS electronic submission and reviewing system. His help behind the scenes made our job a lot easier! We would also like to thank Pierre Poulin and Kelly Booth for handling the liaison with AI and VI conference organizers, and Kelly Booth again for additional valuable advice. We thank further all referees for their voluntary work, Ravin Balakrishnan for handling the posters, Sara Diamond for organizing the video show, and Fred Peet, treasurer of the Canadian Human-Computer Communication Society, for keeping the finances straight, and Graphics Services at the University of Waterloo for doing such an excellent job on the proceedings. Last but not least, we send a very big thanks to Camille Sinanan, Sheelagh Carpendale, Mario Costa-Sousa, and Joerg Denzinger for the local organization of the joint conferences at the University of Calgary. Without their work, this conference would simply not have been possible.
For further information about the conference series we invite you to visit our web site: http://www.graphicsinterface.org/},
keywords = {human-computer interaction, HCI, computer graphics},
}
@proceedings{stuerzlinger2002egveproceedings,
title = {Eurographics Workshop on Virtual Environments 2002},
author = {Stürzlinger, Wolfgang and Müller, Stefan},
publisher = {ACM SIGGRAPH},
series = {EGVE '02},
year = {2002},
month = {May},
url = {https://dl.acm.org/doi/proceedings/10.5555/509709},
teaser = {teasers/EGVE2002.png},
abstract = {This book contains the proceedings of the Eighth EUROGRAPHICS Workshop on Virtual Environments. The event was held in Barcelona from May 30 to May 31, 2002. The workshop brought together scientists, developers, and users from all over the world to present and discuss the latest scientific advances in the field of Virtual Environments. 60 papers were submitted for reviewing and 22 were selected to be presented at the workshop. Most of the top research institutions working in the area submitted papers and presented their latest results. The presentations were complemented by two keynote talks from Marc Mine (Walt Disney Imagineering - VR Studio) and Eric Badiqué (European Commission - IST program). The research presented at this workshop can be classified into the following aspects of Virtual Environments (VEs): Input and Output Devices, Interaction and Navigation, Evaluation, Collaboration, Systems, and Applications. Devices focus mainly on hardware issues to interface with a simulation, whereas Interaction and Navigation techniques investigate how the raw input is best interpreted so that the user can easily achieve his/her goals. Evaluations provide data about the usability of Virtual Environments, and the importance of objective and reproducible studies can only be stressed. Virtual Environments are often used to communicate and to co-operate and this focus is evident in the research on Collaboration. The area of Systems discusses the various tradeoffs in building complete solutions and last, but not least, applications report on the transfer of research results into the real world. However, the reader should note that many contributions cross these boundaries, which reflects the multidisciplinary nature of Virtual Environments.},
keywords = {virtual reality},
}
@proceedings{stuerzlinger2000giposterproceedings,
title = {Poster Proceedings Graphics Interface 2000},
author = {Stürzlinger, Wolfgang},
series = {GI '00},
year = {2000},
month = {May},
teaser = {teasers/GIposter2000.png},
abstract = {After the success of last year, I am happy to report that Graphics Interface was again able to attract a large number of posters. This year a significant part of the submissions is from all over the world, which underlines the international aspect of the conference. Furthermore, the topics nicely cover the range of research areas that are the focus of the conference: Graphics and Human-Computer Interaction.
Posters are an excellent medium for communicating new and emerging ideas. For many first-time authors it also enables them to meet future colleagues. I encourage all conference participants to go to the poster session and meet the authors in person. Please chat with the students and provide them with feedback!},
keywords = {human-computer interaction, HCI, computer graphics},
}
@comment{************************journal_articles************************}
@comment{c, c={not sure if this is best article or proceedings}}
@comment{barrera2027dagstuhl,
title = {Sketching Beyond 2D in Extended Reality (Dagstuhl Seminar 27022)},
author = {Barrera Machuca, Mayra Donaji and Jackson, Bret and Keefe, Daniel and Habakuk, Johann and Stuerzlinger, Wolfgang},
journal = {Dagstuhl Reports},
publisher = {Schloss Dagstuhl-Leibniz-Zentrum fuer Informatik},
commented-series = {Dagstuhl Seminar 27022},
commented-issn = {2192-5283},
year = {2027},
month = {Jun},
commented-volume = {0},
commented-number = {0},
commented-pages = {1-9},
commented-doi = {https://doi.org/10.4230/DagRep.0.0.1},
commented-pdf = {papers/dagstuhl_IA.pdf},
commented-teaser = {teasers/dagstuhl.png},
commented-abstract = {Advances in virtual, mixed, and augmented reality (VR, MR, AR) have enabled a new form of computer-mediated art expression called 3D sketching, also referred to as "3D painting", "3D drawing", or a variant of "immersive sketching", which allows artists, engineers, designers, and scientists to create 3D works in a body-centric space. One of the unique aspects of 3D sketching is that it requires a computer-based tracking system to record the artist's spatial movements, which create the digital marks, and computer graphics techniques to render these marks in space. Moreover, the resulting sketch is often displayed in this same 3D space, e.g., via the use of immersive computer displays.
This dependency on computer systems to create and display the creations makes 3D sketching a unique medium that requires the union of artists and computer scientists to develop tools that artists can then use to interact with the 3D "canvas". Thus, over the last 30 years, the computing research and digital arts communities have collaborated to study and exhibit 3D sketching techniques, applications, and artifacts.
This Dagstuhl Seminar invites participants to broaden these collaborations by combining computer scientists, cognitive scientists, artists, engineers, and practitioners from both academia and industry.
The seminar will provide the unique opportunity to foster intellectual exchange on three general themes: (1) Technology: the design and implementation of novel user interfaces and hardware that address the needs of artists and other practitioners, (2) Theory: understanding the role of spatial perception and cognition in the act of sketching, and (3) Creative Practice and Education: identifying novel ways to train the next generation of 3D sketching artists. The seminar’s goals include:
- Coalescing an international community of creative practitioners, educators, and researchers working with 3D drawing, including establishing a new online presence at http://3ddrawing.org/
- Mapping and disseminating a future research agenda for 3D sketching, including a position paper and tutorials at top conferences like IEEE VR and ACM CHI.
- Making work with 3D drawing more visible to the public by contributing, exhibiting, and supporting emerging venues for exhibiting 3D drawings in places like ARSElectronica, SIGGRAPH Art Show or the IEEE XR Gallery.
- Describing training and education methods for 3D sketching, including identifying best practices that artists and schools can apply.
By fulfilling these goals, this seminar aims to guide our ability to teach and use 3D sketching tools.},
commented-keywords = {},
}
@article{li2026selectrunning,
title = {Investigating 3D Selection Performance While Running in Extended Reality: an In-depth Study of the Effect of Speed},
author = {Li*, Ang and Knibbe, Jarrod and Tatsuzawa*, Kiichiro and Demartini, Gianluca and Viller, Stephen and Wallis, Guy and Stuerzlinger, Wolfgang and Cordeil, Maxime},
journal = {Transactions on Visualization and Computer Graphics},
publisher = {IEEE},
series = {TVCG},
year = {2026},
month = {Sep},
commented-volume = {32},
commented-number = {0},
numpages = {13},
commented-doi = {https://doi.org/10.1109/ISMAR0000.2026.00000},
commented-pdf = {papers/selectrunning.pdf},
commented-video = {videos/selectrunning.mp4},
commented-teaser = {teasers/selectrunning.png},
abstract = {We explore how running speed affects target selection in immersive environments. Through a Fitts' tapping task, we investigate direct touch selections while participants are standing or running (at speeds up to 9 km/h). We conduct a multifaceted controlled study (n=22) to understand the effect of speed, pointing phase, and foot-strike on selection performance. We find that speed dramatically increases movement time, error rate, perceived exertion, and task load. The increased movement time is driven by the correction phase, which doubles in duration at 9 km/h, while the ballistic phase remains stable. Our exploratory analysis further reveals that a higher cadence reduces the error rate at lower speeds (4.5 km/h), while this effect disappears at higher speeds (9 km/h), as participants' motor control in target selection is significantly disrupted by the movement oscillations. As the selection error rate quickly exceeds 30% when speed increases, even with accurate, fast external tracking, we argue that direct touch interaction is likely inappropriate for running. Further efforts are needed to facilitate selection interaction at higher running speeds.},
keywords = {3D pointing, running, jogging},
note = {To appear},
}
@article{rasoulifar2026dynamicvac,
title = {Dynamic Vergence–Accommodation Conflict: Effects on 3D Selection Performance When Target Depth Changes},
author = {Rasoulifar+, Zahra and Turkmen*, Rumeysa and Barrera Machuca, Mayra D. and Stuerzlinger, Wolfgang and Batmaz, Anil Ufuk},
journal = {Transactions on Visualization and Computer Graphics},
publisher = {IEEE},
series = {TVCG},
year = {2026},
month = {Oct},
commented-volume = {32},
commented-number = {11},
numpages = {11},
commented-doi = {https://doi.org/10.1109/ISMAR0000.2026.00000},
commented-pdf = {papers/dynamicvac.pdf},
commented-video = {videos/dynamicvac.mp4},
commented-teaser = {teasers/dynamicvac.png},
abstract = {The effect of the Vergence--Accommodation Conflict (VAC) in state-of-the-art head-mounted displays on 3D interaction performance is well-studied in scenarios where targets remain stationary at a fixed depth. Yet, many VR applications include targets moving continuously toward or away from the user, causing vergence demand to change over time while accommodation remains fixed at the display focal plane. We study this scenario using an ISO 9241-411 multidirectional target selection task with: \emph{No VAC} (targets at the display focal plane), \emph{Constant VAC} (targets further from the focal plane), \emph{Varying VAC} (targets appear at both No VAC and Constant VAC depths across selections), and \emph{Dynamic VAC} (target depth changes continuously during acquisition) conditions. In a within-subjects study with 24 participants, Dynamic VAC produced slower selections, higher error rates, lower accuracy, and reduced throughput compared with the No VAC condition. To account for target movements in depth, we propose an extension of Fitts’ law that models the additional performance costs introduced by continuously changing vergence demand. Our results provide guidance for modeling and designing interaction techniques in depth-varying 3D environments.},
keywords = {3D pointing},
note = {ISMAR '26, conditionally accepted, to appear},
}
@article{jeong2026throwmodel,
title = {Modeling Throwing Selection in Virtual Reality},
author = {Jeong*, Jae-Yeop and Stuerzlinger, Wolfgang and Jeong, Jin-Woo},
journal = {Transactions on Visualization and Computer Graphics},
publisher = {IEEE},
series = {TVCG},
year = {2026},
month = {Oct},
commented-volume = {32},
commented-number = {11},
numpages = {11},
commented-doi = {https://doi.org/10.1109/ISMAR0000.2026.00000},
commented-pdf = {papers/throwmodel.pdf},
commented-video = {videos/throwmodel.mp4},
commented-teaser = {teasers/throwmodel.png},
abstract = {Throwing is a natural and embodied interaction for selecting distant targets in virtual reality (VR). Unlike conventional pointing, throwing is ballistic: once released, the trajectory can no longer be corrected. Despite its practical importance, throwing-based target selection has received relatively little attention in human behavior and performance modeling, making systematic design and evaluation still difficult. In this paper, we investigate throwing-based target selection in VR and propose predictive models for its behavior and performance. Through a controlled user study manipulating target width ($W$) and movement amplitude ($A$), we measured planning time ($PT$) and endpoint distribution. Our results showed that $PT$ increased systematically with task difficulty, following a pattern similar to movement time in Fitts' law. Throwing endpoints were also generally well approximated by a bivariate Gaussian distribution, and target parameters significantly affected both endpoint bias and variability. Based on these findings, we derived a probabilistic accuracy model that predicts target acquisition performance. The proposed models showed high goodness-of-fit, and the accuracy model was robust under leave-one-condition-out cross-validation. Our findings provide a quantitative understanding of throwing-based target selection and support the design of throwing interactions in immersive environments.},
keywords = {selection, throwing},
note = {ISMAR '26, conditionally accepted, to appear},
}
@article{bashar2026vacgazeconflict,
title = {Evaluating the Vergence–Accommodation Conflict in Gaze-Based 3D Target Selection},
author = {Bashar*, Mohammad Raihanul and Amini*, Mohammadreza and Mutasim, Aunnoy K. and Barrera Machuca, Mayra D. and Stuerzlinger, Wolfgang and Batmaz, Anil Ufuk},
journal = {Transactions on Visualization and Computer Graphics},
publisher = {IEEE},
series = {TVCG},
year = {2026},
month = {Oct},
commented-volume = {32},
commented-number = {11},
numpages = {11},
commented-doi = {https://doi.org/10.1109/ISMAR0000.2026.00000},
commented-pdf = {papers/vacgazeconflict.pdf},
commented-video = {videos/vacganzeconflict.mp4},
commented-teaser = {teasers/vacgazeconflict.png},
abstract = {State-of-the-art head-mounted displays (HMDs) enable gaze-based selection in virtual environments. Yet, these HMDs suffer from the vergence–accommodation conflict (VAC), which is known to affect interaction performance. The VAC might influence gaze-based selection performance because it directly affects eye-movement behavior. Thus, in this paper, we investigate how the VAC influences \gaze-based 3D target selection across varying depth conditions. Our results show that as the (visual) depth increases, user performance significantly decreases with gaze-based selection. Moreover, a previously suggested ``\textit{Variation in Diopter}'' Fitts’ law model captured this performance change better relative to a linear model. These findings provide evidence that gaze-based pointing is negatively affected by the VAC and highlight the importance of accounting for depth-dependent factors when designing gaze-based interaction in 3D environments.},
keywords = {3D pointing, eye gaze},
note = {ISMAR '26, conditionally accepted, to appear},
}
@article{hu2025trackingaccuracysteering,
title = {Exploring and Modeling the Effects of Eye-Tracking Accuracy and Precision on Gaze-Based Steering in Virtual Environments},
author = {Hu*, Xuning and Zhang*, Yichuan and Wei*, Yushi and Zhang*, Liangyuting and Li, Yue and Stuerzlinger, Wolfgang and Liang, Hai-Ning},
journal = {Transactions on Visualization and Computer Graphics},
publisher = {IEEE},
series = {TVCG},
year = {2025},
month = {Oct},
volume = {31},
number = {11},
pages = {9559-9569},
doi = {https://doi.org/10.1109/TVCG.2025.3616824},
pdf = {papers/trackingaccuracysteering.pdf},
teaser = {teasers/trackingaccuracysteering.png},
abstract = {Recent advances in eye-tracking technology have positioned gaze as an efficient and intuitive input method for Virtual Reality (VR), offering a natural and immersive user experience. As a result, gaze input is now leveraged for fundamental interaction tasks such as selection, manipulation, crossing, and steering. Although several studies have modeled user steering performance across various path characteristics and input methods, our understanding of gaze-based steering in VR remains limited. This gap persists because the unique qualities of eye movements—involving rapid, continuous motions—and the variability in eye-tracking make findings from other input modalities nontransferable to a gaze-based context, underscoring the need for a dedicated investigation into gaze-based steering behaviors and performance. To bridge this gap, we present two user studies to explore and model gaze-based steering. In the first one, user behavior data are collected across various path characteristics and eye-tracking conditions. Based on this data, we propose four refined models that extend the classic Steering Law to predict users’ movement time in gaze-based steering tasks, explicitly incorporating the impact of tracking quality. The best-performing model achieves an adjusted R^2 of 0.956, corresponding to a 16% improvement in movement time prediction. This model also yields a substantial reduction in AIC (from 1550 to 1132) and BIC (from 1555 to 1142), highlighting improved model quality and better balance between goodness of fit and model complexity. Finally, data from a second study with varied settings, such as a different eye-tracking sampling rate, illustrate the strong robustness and predictability of our models. Finally, we present scenarios and applications that demonstrate how our models can be used to design enhanced gaze-based interactions in VR systems.},
keywords = {eye tracking, gaze steering},
award = {This work received an Honorable Mention Award},
note = {ISMAR '25},
}
@article{mostajeran2025biophilicsteering,
title = {The Effects of Biophilic Design on Steering Performance in Virtual Reality},
author = {Mostajeran, Fariba and Friedrich*, Moritz and Steinicke, Frank and Kühn, Simone and Stuerzlinger, Wolfgang},
journal = {Scientific Reports},
publisher = {Nature Portfolio},
series = {SciRep},
year = {2025},
month = {Sep},
volume = {15},
commented-number = {1},
articleno = {32485},
numpages = {12},
doi = {https://doi.org/10.1038/s41598-025-19113-4},
pdf = {papers/biophilicsteering.pdf},
teaser = {teasers/biophilicsteering.png},
abstract = {Biophilic design aims to connect people to nature by incorporating natural elements such as plants in built environments. In immersive virtual reality (VR) environments, experiments have shown that, for instance, the presence of virtual plants in VR leads to higher cognitive performance and psychological well-being. However, it has not been investigated so far whether such effects extend to the performance of spatial interaction tasks such as path steering. In this paper, we explore the effects of the presence of virtual plants in an immersive virtual office environment on path steering performance in VR. For this purpose, we combined and replicated two previous studies in this field. The results of our study did not find an effect of the presence of virtual plants on steering time, as our participants performed all steering tasks in a similar amount of time in both biophilic and non-biophilic environments. We could, however, replicate one of the original studies on path steering in VR by Liu et al. and show that the steering time in our study also follows the extension of the steering law proposed in their work. Accordingly, we found not only a significant effect of the length (p < .001, effect size: partial eta squared=.93) and width (p < .001, effect size=.96) of the steering path, but also a significant effect of the path curvature (p=.003, effect size=.64) on the time needed for steering through the path. We also found significant effects of path latitude (p < .001, effect size=.57) and longitude (p=.01, effect size=.18) on steering time. Our findings challenge the previous research, which demonstrated the positive effects of biophilic design in VR on cognitive processes, and therefore, pave the path for future work to better understand the effects of biophilic design on users’ performance in VR.},
keywords = {biophilic design, cognition, well-being},
}
@article{bashar2025depthvac,
title = {The Effect of Visual Depth on the Vergence-Accommodation Conflict on 3D Selection Performance within Virtual Reality Headsets},
author = {Bashar*, Mohammad Raihanul and Barrera Machuca, Mayra Donaji and Stuerzlinger, Wolfgang and Batmaz, Anil Ufuk},
journal = {Visual Computer},
publisher = {Springer},
commented-series = {VisComp},
year = {2025},
month = {May},
volume = {41},
commented-number = {},
pages = {9645-9661},
doi = {https://doi.org/10.1007/s00371-025-03990-x},
pdf = {papers/depthvac.pdf},
teaser = {teasers/depthvac.png},
abstract = {Prior studies have shown that the vergence-accommodation conflict (VAC) negatively affects the interaction performance in Virtual Reality (VR) and Augmented Reality (AR) systems, particularly as object depth increases. This paper examines user selection performance across six different visual depths. Through a study closely resembling prior research, eighteen participants participated in an ISO 9241:411 task with six different depth distances. We observed that with higher depth values, selection times increased while the throughput performance of the participants decreased. Based on this finding, we propose a Fitts' law model based on the focal distances, which models pointing times in VR and AR systems with substantially higher accuracy. We hope that our findings aid developers in creating 3D user interfaces for VR and AR that offer better performance and an improved user experience.},
keywords = {3D pointing, vergence-accomodation conflict},
}
@article{menin2025thematicmobility,
title = {What about thematic information? An analysis of the multidimensional visualization of individual mobility},
author = {Menin*, Aline and Quere*, Clément and Wagner*, Jorge and Chardonnel, Sonia and Davoine, Paule-Annick and Stuerzlinger, Wolfgang and Freitas, Carla Maria Dal Sasso and Nedel, Luciana and Winckler, Marco},
journal = {Visual Informatics},
publisher = {Elsevier},
commented-series = {VisInf},
year = {2025},
month = {Mar},
volume = {9},
number = {1},
pages = {99-115},
doi = {https://doi.org/10.1016/j.visinf.2025.02.002},
pdf = {papers/thematicmobility.pdf},
teaser = {teasers/thematicmobility.png},
abstract = {This paper reviews the literature on the visualization of individual mobility data, with a focus on thematic integration. It emphasizes the importance of visualization in understanding mobility patterns within a population and how it helps mobility experts to address domain-specific questions. We analyze 38 papers published between 2010 and 2024 in GIS and VIS venues that describe visualizations of multidimensional data related to individual movements in urban environments, concentrating on individual mobility rather than traffic data. Our primary aim is to report advances in interactive visualization for individual mobility analysis, particularly regarding the representation of thematic information about people’s motivations for mobility. Our findings indicate that the thematic dimension is only partially represented in the literature, despite its critical significance in transportation. This gap often stems from the challenge of identifying data sources that inherently provide this information, necessitating visualization designers and developers to navigate multiple, heterogeneous data sources. We identify the strengths and limitations of existing visualizations and suggest potential research directions for the field.},
keywords = {visual analytics, visualization, thematic information, individual mobility},
}
@article{mutasim2025gazegem,
title = {The Influence of Eye Gaze Interaction Technique Expertise and the Guided Evaluation Method on Text Entry Performance Evaluations},
author = {Mutasim*, Aunnoy K and Batmaz, Anil Ufuk and Hudhud Mughrabi*, Moaaz and Stuerzlinger, Wolfgang},
journal = {Proceedings of the ACM Human-Computer Interaction},
publisher = {ACM},
series = {PACM-HCI},
year = {2025},
month = {May},
volume = {9},
number = {3},
articleno = {ETRA17},
numpages = {19},
doi = {https://doi.org/10.1145/3725842},
pdf = {papers/gazegem.pdf},
teaser = {teasers/gazegem.png},
video = {videos/gazegem.mp4},
abstract = {Any investigation of learning unfamiliar text entry systems is affected by the need to train participants on multiple new components simultaneously, such as novel interaction techniques and layouts. The Guided Evaluation Method (GEM) addresses this challenge by bypassing the need to learn layout-specific skills for text entry. However, a gap remains as the GEM’s performance has not been assessed in situations where users are unfamiliar with the interaction technique involved, here eye-gaze-based dwell. To address this, we trained participants on only the eye-gaze-based interaction technique over eight days with QWERTY and then evaluated their performance on the OPTI layout with the GEM. Results showed that the unfamiliar OPTI layout outperformed QWERTY, with QWERTY's speed aligning with previous findings, suggesting that interaction technique expertise significantly impacts performance outcomes. Importantly, we also identified that for scenarios where the familiarity with the involved interaction technique(s) is the same, the GEM analyzes the performance of keyboard layouts effectively and quickly identifies the best option.},
keywords = {text entry, layout learning, eye tracking, gaze},
note = {ETRA '25},
}
@article{lee2025scalingtechniques,
title = {Scaling Techniques for Exocentric Navigation Interfaces in Multiscale Virtual Environments},
author = {Lee, Jong-In and Stuerzlinger, Wolfgang},
journal = {Transactions on Visualization and Computer Graphics},
publisher = {IEEE},
series = {TVCG},
year = {2025},
month = {Mar},
volume = {31},
number = {5},
pages = {2704-2714},
doi = {https://doi.org/10.1109/TVCG.2025.3549535},
pdf = {papers/scalingtechniques.pdf},
teaser = {teasers/scalingtechniques.png},
video = {videos/scalingtechniques.mp4},
abstract = {Navigating multiscale virtual environments necessitates an interaction method to travel across different levels of scale (LoS). Prior research has studied various techniques that enable users to seamlessly adjust their scale to navigate between different LoS based on specific user contexts. We introduce a scroll-based scale control method optimized for exocentric navigation, targeted at scenarios where speed and accuracy in continuous scaling are crucial. We pinpoint the challenges of scale control in settings with multiple LoS and evaluate how distinct designs of scaling techniques influence navigation performance and usability. Through a user study, we investigated two pivotal elements of a scaling technique: the input method and the scaling center. Our findings indicate that our scroll-based input method significantly reduces task completion time and error rate and enhances efficiency compared to the most frequently used bi-manual method. Moreover, we found that the choice of scaling center affects the ease of use of the scaling method, especially when paired with specific input methods.},
keywords = {3D navigation, multiscale virtual environment, 3D locomotion},
note = {VR '25},
}
@article{mutasim2024gem,
title = {The Guided Evaluation Method: An Easier Way to Empirically Estimate Trained User Performance for Unfamiliar Keyboard Layouts},
author = {Mutasim*, Aunnoy K and Batmaz, Anil Ufuk and Hudhud Mughrabi+, Moaaz and Stuerzlinger, Wolfgang},
journal = {International Journal of Human-Computer Studies},
publisher = {Elsevier},
series = {IJHCS},
year = {2024},
month = {Oct},
volume = {190},
articleno = {103317},
numpages = {19},
doi = {https://doi.org/10.1016/j.ijhcs.2024.103317},
pdf = {papers/gem.pdf},
teaser = {teasers/gem.png},
abstract = {To determine in a user study whether proposed keyboard layouts, such as OPTI, can surpass QWERTY in performance, extended training through longitudinal studies is crucial. However, addressing the challenge of creating trained users presents a logistical bottleneck. A common alternative involves having participants type the same word or phrase repeatedly. We conducted two separate studies to investigate this alternative. The findings reveal that both approaches, repeatedly typing words or phrases, have limitations in accurately estimating trained user performance. Thus, we propose the Guided Evaluation Method (GEM), a novel approach to quickly estimate trained user performance with novices. Our results reveal that in a matter of minutes, participants exhibited performance similar to an existing longitudinal study — OPTI outperforms QWERTY. As it eliminates the need for resource-intensive longitudinal studies, our new GEM thus enables much faster estimation of trained user performance. This outcome will potentially reignite research on better text entry methods.},
keywords = {text entry, touch typing, soft keyboards, layout learning},
}
@article{hoerantner2024vismet,
title = {Visual training in dry age-related macular degeneration},
author = {Hörantner, Robert and Wolfsgruber, Jürgen and Stürzlinger, Gerald and Stürzlinger, Wolfgang and Hörantner, Paul},
journal = {Spektrum der Augenheilkunde},
publisher = {Springer},
year = {2024},
month = {Aug},
volume = {39},
number = {1},
pages = {4-8},
doi = {https://doi.org/10.1007/s00717-024-00578-z},
pdf = {papers/vismet.pdf},
teaser = {teasers/vismet.png},
abstract = {Purpose: To investigate the efficacy of visual training with stimulation in patients with dry age-related macular degeneration (AMD).
Method: The Medical Eye Trainer (M.E.T.) was tested in 67 patients with dry AMD. By using the training system, the entire visual system is treated. A moving grid is displayed on a standard smartphone or tablet. The training was carried out once a day for 90 seconds over a total period of two months.
Results: The Medical Eye Trainer (M.E.T.) significantly improved visual function after two months. The results of a questionnaire, which was used after the therapy, also showed a satisfactory stabilization or improvement of the findings.
Conclusions: The M.E.T. represents an effective additional treatment option for patients with dry AMD without interfering with established treatment methods.},
keywords = {macular degeneration, dry AMD, visual training, visual perception},
note = {In German},
}
@article{rajabiseraji2024hybridaxes,
title = {Analyzing User Behaviour Patterns in a Cross-virtuality Immersive Analytics System},
author = {Rajabi Seraji*, Mohammad and Piray*, Parastoo and Zahednejad*, Vahid and Stuerzlinger, Wolfgang},
journal = {Transactions on Visualization and Computer Graphics},
publisher = {IEEE},
series = {TVCG},
year = {2024},
month = {Mar},
volume = {30},
number = {5},
pages = {2613-2623},
doi = {https://doi.org/10.1109/TVCG.2024.3372129},
pdf = {papers/hybridaxes2.pdf},
teaser = {teasers/hybridaxes2.png},
video = {videos/hybridaxes2.mp4},
abstract = {Recent work in immersive analytics suggests benefits for systems that support work across both 2D and 3D data visualizations, i.e., cross-virtuality analytics systems. Here, I introduce HybridAxes, an immersive visual analytics system that enables users to conduct their analysis either in 2D on desktop monitors or in 3D within an immersive AR environment - while enabling them to seamlessly switch and transfer their visualizations between the two modes. The results of my user study show that the cross-virtuality sub-systems in HybridAxes complement each other well in helping the users in their data-understanding journey. I show that users preferred using the AR component for exploring the data, while they used the desktop component to work on more detail-intensive tasks. Despite encountering some minor challenges in switching between the two virtuality modes, users consistently rated the whole system as highly engaging, user-friendly, and helpful in streamlining their analytics processes. Finally, I present suggestions for designers of cross-virtuality visual analytics systems and identify avenues for future work.},
keywords = {immersive analytics, cross-reality, augmented reality},
award = {This work received an Honorable Mention Award},
note = {VR '24}
}
@article{barrera2023immersivesketchingframework,
title = {Toward More Comprehensive Evaluations of 3D Immersive Sketching, Drawing, and Painting},
author = {Barrera Machuca, Mayra Donaji and Israel, Johann Habakuk and Keefe, Daniel F. and Stuerzlinger, Wolfgang},
journal = {Transactions on Visualization and Computer Graphics},
publisher = {IEEE},
series = {TVCG},
year = {2024},
month = {Aug},
volume = {30},
number = {8},
pages = {4648-4664},
doi = {https://doi.org/10.1109/TVCG.2023.3276291},
pdf = {papers/immersivesketchingframework.pdf},
teaser = {teasers/immersivesketchingframework.png},
abstract = {To understand current practice and explore the potential for more comprehensive evaluations of 3D immersive sketching, drawing, and painting, we present a survey of evaluation methodologies used in existing 3D sketching research, a breakdown and discussion of important phases (sub-tasks) in the 3D sketching process, and a framework that suggests how these factors can inform evaluation strategies in future 3D sketching research. Existing evaluations identified in the survey are organized and discussed within three high-level categories: 1) evaluating the 3D sketching activity, 2) evaluating 3D sketching tools, and 3) evaluating 3D sketching artifacts. The new framework suggests targeting evaluations to one or more of these categories and identifying relevant user populations. In addition, building upon the discussion of the different phases of the 3D sketching process, the framework suggests to evaluate relevant sketching tasks, which may range from low-level perception and hand movements to high-level conceptual design. Finally, we discuss limitations and challenges that arise when evaluating 3D sketching, including a lack of standardization of evaluation methods and multiple, potentially conflicting, ways to evaluate the same task and user interface usability; we also identify opportunities for more holistic evaluations. We hope the results can contribute to accelerating research in this domain and, ultimately, broad adoption of immersive sketching systems.},
keywords = {3D sketching, 3D drawing, 3D painting},
}
@article{mostajeran2023biophilic,
title = {Adding Virtual Plants Leads to Higher Cognitive Performance and Psychological Well-being in Virtual Reality},
author = {Mostajeran, Fariba and Steinicke, Frank and Reinhart*, Sarah and Stuerzlinger, Wolfgang and Riecke, Bernhard E. and Kühn, Simone},
journal = {Scientific Reports},
publisher = {Nature Portfolio},
series = {SciRep},
year = {2023},
month = {May},
volume = {13},
number = {1},
numpages = {12},
doi = {https://doi.org/10.1038/s41598-023-34718-3},
pdf = {papers/biophilic.pdf},
teaser = {teasers/biophilic.png},
abstract = {Previous research has shown the positive effects of exposure to real and virtual nature. To investigate how such benefits might generalize to ever-more-prevalent virtual workplaces, we examined the effects of the absence or presence of virtual plants in an office environment in Virtual Reality (VR) on users’ cognitive performance and psychological well-being. The results of our user study with 39 participants show that in the presence of virtual plants, participants performed significantly better in both short-term memory and creativity tasks. Furthermore, they reported higher psychological well-being scores, including positive affect and attentive coping, whilst reporting lower feelings of anger and aggression after exposure to virtual plants in VR. The virtual office with plants was also perceived as more restorative and induced a higher sense of presence. Overall, these results highlight how the presence of virtual plants in VR can have positive influences on users, and therefore, constitute important design considerations when developing future working and learning spaces.},
keywords = {biophilic design, cognition, well-being},
}
@article{kaya2023covidvis,
title = {Evaluation of an Immersive COVID-19 Data Visualization},
author = {Kaya+, Furkan and Celik+, Elif and Batmaz, Anil Ufuk and Mutasim*, Aunnoy K and Stuerzlinger, Wolfgang},
journal = {Computer Graphics & Applications},
publisher = {IEEE},
series = {CG&A},
year = {2023},
month = {Jan},
volume = {43},
number = {1},
pages = {76-83},
doi = {https://doi.org/10.1109/MCG.2022.3223535},
pdf = {papers/covidvis.pdf},
teaser = {teasers/covidvis.png},
abstract = {COVID-19 restrictions have detrimental effects on the population, both socially and economically. However, these restrictions are necessary as they help reduce the spread of the virus. For the public to comply, easily comprehensible communication between decision-makers and the public is thus crucial. To address this, we propose a novel 3D visualization of COVID-19 data which could increase the awareness of COVID-19 trends in the general population. We conducted a user study and compared a conventional 2D visualization with the proposed method in an immersive environment. Results showed that the our 3D visualization approach facilitated understanding of the complexity of COVID-19. A majority of participants preferred to see the COVID-19 data with the 3D method. Moreover, individual results revealed that our method increases the engagement of users with the data. We hope that our method will help governments to improve their communication with the public in the future.},
keywords = {visualization, 3D visualization, immersive analytics},
}
@article{villanueva2022advancedfatigue,
title = {Advanced Modeling Method for Quantifying Cumulative Subjective Fatigue in Mid-Air Interaction},
author = {Villanueva*, Ana Maria and Jang*, Sujin and Stuerzlinger, Wolfgang and Ambike, Satyajit and Ramani, Karthik},
journal = {International Journal of Human-Computer Studies},
publisher = {Elsevier},
series = {IJHCS},
year = {2023},
month = {Jan},
volume = {169},
commented-number = {0},
articleno = {102931},
numpages = {15},
doi = {https://doi.org/10.1016/j.ijhcs.2022.102931},
pdf = {papers/advancedfatigue.pdf},
teaser = {teasers/advancedfatigue.png},
abstract = {Interaction in mid-air can be fatiguing. A model-based method to quantify cumulative subjective fatigue for such interaction was recently introduced in HCI research. This model separates muscle units into three states: active (MA) fatigued (MF) or rested (MR) and defines transition rules between states. This method demonstrated promising accuracy in predicting subjective fatigue accumulated in mid-air pointing tasks. In this paper, we introduce an improved model that additionally captures the variations of the maximum arm strength based on arm postures and adds linearly-varying model parameters based on current muscle strength. To validate the applicability and capabilities of the new model, we tested its performance in various mid-air interaction conditions, including mid-air pointing/docking tasks, with shorter and longer rest and task periods, and a long-term evaluation with individual participants. We present results from multiple cross-validations and comparisons against the previous model and identify that our new model predicts fatigue more accurately. Our modeling approach showed a 42.5% reduction in fatigue estimation error when the longitudinal experiment data is used for an individual participant’s fatigue. Finally, we discuss the applicability and capabilities of our new approach.},
keywords = {fatigue, mid-air, model, docking, 3D manipulation},
}
@article{yamanaka2022pathsegmentation,
title = {The Effectiveness of Path-segmentation for Modeling Lasso Times in Width-varying Paths},
author = {Yamanaka, Shota and Usuba*, Hiroki and Stuerzlinger, Wolfgang and Miyashita, Homei},
journal = {Proceedings of the ACM Human-Computer Interaction},
publisher = {ACM},
series = {PACM-HCI},
year = {2022},
month = {Dec},
volume = {6},
number = {ISS},
articleno = {584},
pages = {640-659},
doi = {https://doi.org/10.1145/3567737},
pdf = {papers/pathsegmentation.pdf},
video = {videos/pathsegmentation.mp4},
teaser = {teasers/pathsegmentation.png},
abstract = {Models of lassoing time to select multiple square icons exist, but realistic lasso tasks also typically involve encircling non-rectangular objects. Thus, it is unclear if we can apply existing models to such conditions where, e.g., the width of the path that users want to steer through changes dynamically or step-wise. In this work, we conducted two experiments where the objects were non-rectangular with path widths that narrowed or widened, smoothly or step-wise. The results showed that the baseline models for pen-steering movements (the steering and crossing law models) fitted the timing data well, but also that segmenting width-changing areas led to significant improvements. Our work enables the modeling of novel UIs requiring continuous strokes, e.g., for grouping icons.},
keywords = {steering, crossing, lasso, group selection},
note = {ISS '22},
}
@article{batmaz2022throughput,
title = {Effective Throughput Analysis of Different Task Execution Strategies for Mid-Air Fitts' Tasks in Virtual Reality},
author = {Batmaz, Anil Ufuk and Stuerzlinger, Wolfgang},
journal = {Transactions on Visualization and Computer Graphics},
publisher = {IEEE},
series = {TVCG},
year = {2022},
month = {Oct},
volume = {28},
number = {11},
pages = {3939-3947},
doi = {https://doi.org/10.1109/TVCG.2022.3203105},
commented-url = {https://youtu.be/lMUSoiAdwWA},
pdf = {papers/throughputstrategies.pdf},
teaser = {teasers/throughputstrategies.png},
abstract = {Fitts’ law and throughput based on effective measures are two mathematical models frequently used to analyze human motor performance together with a standardized task, e.g., to compare the performance of input and output devices. Even though pointing has been deeply studied in 2D, it is not well understood how different task execution strategies affect throughput in 3D virtual environments. In this work, we examine MacKenzie’s effective throughput measure, claimed to be invariant to task execution strategies, in Virtual Reality (VR) systems with three such strategies, “as fast, as precise, and as fast and as precise as possible” for ray casting and virtual hand interaction, by re-analyzing data from a 3D pointing ISO 9241-411 study. Results show that effective throughput is not invariant for different task execution strategies in VR, which also matches a more recent 2D result. Normalized speed vs accuracy curves also did not fit the data. We suggest that practitioners, developers, and researchers who use MacKenzie’s effective throughput formulation should consider our findings when analyzing 3D user pointing performance in VR systems.},
keywords = {3D pointing, speed-accuracy tradeoff},
note = {ISMAR '22},
}
@article{nowak2021visualanalytics,
title = {Visual Analytics: A Method to Explore Natural Histories of Oral Epithelial Dysplasia},
author = {Nowak*, Stan and Rosin, Miriam and Stuerzlinger, Wolfgang and Bartram, Lyn},
journal = {Frontiers in Oral Health},
publisher = {Frontiers},
year = {2021},
month = {Aug},
volume = {2},
articleno = {703874},
numpages = {10},
doi = {https://doi.org/10.3389/froh.2021.703874},
pdf = {papers/va4oralcancerDRAFT.pdf},
teaser = {teasers/va4oralcancer.png},
abstract = {Risk assessment and follow-up of oral potentially malignant lesions in patients with mild or moderate oral epithelial dysplasia is an ongoing challenge for improved oral cancer prevention. Part of the challenge is a lack of understanding of how observable features of such dysplasia, gathered as data by clinicians during follow-up, relate to underlying biological processes driving progression. Current research is at an exploratory phase where the precise questions to ask are not known. While traditional statistical and the newer machine learning and artificial intelligence methods are effective in well-defined problem spaces with large datasets, these are not the circumstances we face currently. We argue that the field is in need of exploratory methods that can better integrate clinical and scientific knowledge into analysis to iteratively generate viable hypotheses. In this perspective, we propose that visual analytics presents a set of methods well-suited to these needs. We illustrate how visual analytics excels at generating viable research hypotheses by describing our experiences using visual analytics to explore temporal shifts in the clinical presentation of epithelial dysplasia. Visual analytics complements existing methods and fulfills a critical and at-present neglected need in the formative stages of inquiry we are facing.},
keywords = {visual analytics, oral health, visualization, oral cancer},
commented-note = {draft version},
}
@article{wagner2021interaction,
title = {Comparing and Combining Virtual Hand and Virtual Ray Pointer Interactions for Data Manipulation in Immersive Analytics},
author = {Wagner Filho*, Jorge and Stuerzlinger, Wolfgang and Nedel, Luciana},
journal = {Transactions on Visualization and Computer Graphics},
publisher = {IEEE},
series = {TVCG},
year = {2021},
month = {Mar},
volume = {27},
number = {5},
pages = {2513-2523},
doi = {https://doi.org/10.1109/TVCG.2021.3067759},
pdf = {papers/stcinteraction.pdf},
video = {videos/stcinteraction.mp4},
teaser = {teasers/stcinteraction.png},
abstract = {Displaying data visualizations in Virtual Reality environments enables analysts to explore large amounts of information more easily, supported by different perspectives and stereoscopic 3D display. Easy-to-use interaction affords additional benefits, such as more intuitively querying or filtering the data. Many Immersive Analytics systems employ either a virtual hands metaphor, with actions such as grabbing and stretching, or virtual ray pointers, with actions assigned to controller buttons. However, the effect of this choice in immersive visualization systems is unknown. Considering that each approach has different advantages, we implemented and evaluated both as well as a third option: seamlessly integrating both modes and allowing the user to alternate between them without explicit mode switches. We compared these three conditions through a controlled user study in the spatio-temporal data domain. We did not find significant differences between hands and ray-casting in task performance, workload, or interactivity patterns. Yet, 60% of the participants preferred the mixed mode and benefited from it by choosing the best alternative for each low-level task. This mode significantly reduced completion times by 23% for the most demanding task, at the cost of a 5% decrease in overall success rates.},
keywords = {visual analytics, immersive analytics, space-time cube, 3D visualization, 3D interaction},
note = {VR '21},
}
@article{wagner2021navigation,
title = {The Effect of Exploration Mode and Frame of Reference in Immersive Analytics},
author = {Wagner Filho*, Jorge and Stuerzlinger, Wolfgang and Nedel, Luciana},
journal = {Transactions on Visualization and Computer Graphics},
publisher = {IEEE},
series = {TVCG},
year = {2021},
month = {Feb},
volume = {28},
number = {9},
numpages = {3252-3264},
doi = {https://doi.org/10.1109/TVCG.2021.3060666},
pdf = {papers/stcnavigation.pdf},
video = {videos/stcnavigation.mp4},
teaser = {teasers/stcnavigation.png},
abstract = {The design space for user interfaces for Immersive Analytics applications is vast. Designers can combine navigation and manipulation to enable data exploration with ego- or exocentric views, have the user operate at different scales, or use different forms of navigation with varying levels of physical movement. This freedom results in a multitude of different viable approaches. Yet, there is no clear understanding of the advantages and disadvantages of each choice. Our goal is to investigate the affordances of several major design choices, to enable both application designers and users to make better decisions. In this work, we assess two main factors, exploration mode and frame of reference, consequently also varying visualization scale and physical movement demand. To isolate each factor, we implemented nine different conditions in a Space-Time Cube visualization use case and asked 36 participants to perform multiple tasks. We analyzed the results in terms of performance and qualitative measures and correlated them with participants' spatial abilities. While egocentric room-scale exploration significantly reduced mental workload, exocentric exploration improved performance in some tasks. Combining navigation and manipulation made tasks easier by reducing workload, temporal demand, and physical effort.},
keywords = {visual analytics, immersive analytics, space-time cube, 3D visualization, 3D navigation},
}
@comment{c, c={issue appeared in 2021}}
@article{gloumeau2020pinnpivot,
title = {{PinNPivot}: Object Manipulation Using Pins in Immersive Virtual Environments},
author = {Gloumeau*, Paul Christopher and Stuerzlinger, Wolfgang and Han, JungHyun},
journal = {Transactions on Visualization and Computer Graphics},
publisher = {IEEE},
series = {TVCG},
year = {2020},
month = {Apr},
volume = {27},
number = {4},
pages = {2488-2494},
doi = {https://doi.org/10.1109/TVCG.2020.2987834},
pdf = {papers/pinnpivot.pdf},
video = {videos/pinnpivot.mp4},
teaser = {teasers/pinnpivot.png},
abstract = {Object manipulation techniques in immersive virtual environments are either inaccurate or slow. We present a novel technique, PinNPivot, where pins are used to constrain 1DOF/2DOF/3DOF rotations. It also supports 6DOF manipulation and 3DOF translation. A comparison with three existing techniques shows that PinNPivot is significantly more accurate and faster.},
keywords = {3D manipulation, docking},
}
@article{batmaz2020beam,
title = {How Automatic Speed Control Based on Distance Affects User Behaviours in Telepresence Robot Navigation within Dense Conference-like Environments},
author = {Batmaz, Anil Ufuk and Maiero*, Jens and Kruijff, Ernst and Riecke, Bernhard E. and Neustaedter, Carman and Stuerzlinger, Wolfgang},
journal = {PLoS ONE},
publisher = {Public Library of Science},
year = {2020},
month = {Nov},
volume = {15},
number = {11},
articleno = {e0242078},
numpages = {47},
doi = {https://doi.org/10.1371/journal.pone.0242078},
pdf = {papers/beamspeed.pdf},
teaser = {teasers/beamspeed.png},
commented-series = {PLOS One},
abstract = {Telepresence robots allow users to be spatially and socially present in remote environments. Yet, it can be challenging to remotely operate telepresence robots, especially in dense environments such as academic conferences or workplaces. In this paper, we primarily focus on the effect that a speed control method, which automatically slows the telepresence robot down when getting closer to obstacles, has on user behaviors. In our first user study, participants drove the robot through a static obstacle course with narrow sections. Results indicate that the automatic speed control method significantly decreases the number of collisions. For the second study we designed a more naturalistic, conference-like experimental environment with tasks that require social interaction, and collected subjective responses from the participants when they were asked to navigate through the environment. While about half of the participants preferred automatic speed control because it allowed for smoother and safer navigation, others did not want to be influenced by an automatic mechanism. Overall, the results suggest that automatic speed control simplifies the user interface for telepresence robots in static dense environments, but should be considered as optionally available, especially in situations involving social interactions.},
keywords = {telepresence robot, automatic distance, 3D navigation, speed control},
}
@article{alharbi2020frustration,
title = {The Effects of Predictive Features of Mobile Keyboards on Text Entry Speed and Errors},
author = {Alharbi*, Ohoud and Stuerzlinger, Wolfgang and Putze, Felix},
journal = {Proceedings of the ACM Human-Computer Interaction},
publisher = {ACM},
series = {PACM-HCI},
year = {2020},
month = {Nov},
volume = {4},
number = {ISS},
articleno = {183},
numpages = {16},
doi = {https://doi.org/10.1145/3427311},
pdf = {papers/autocorrectfrustration.pdf},
teaser = {teasers/autocorrectfrustration.png},
abstract = {Mobile users rely on typing assistant mechanisms such as prediction and autocorrect. Previous studies on mobile keyboards showed decreased performance for heavy use of word prediction, which identifies a need for more research to better understand the effectiveness of predictive features for different users. Our work aims at such a better understanding of user interaction with autocorrections and the prediction panel while entering text, in particular when these approaches fail. We present a crowd-sourced mobile text entry study with 170 participants. Our mobile web application simulates autocorrection and word prediction to capture user behaviours around these features. We found that using word prediction saves an average of 3.43 characters per phrase but also adds an average of two seconds compared to actually typing the word, resulting in a negative effect on text entry speed. We also identified that the time to fix wrong autocorrections is on average 5.5 seconds but that autocorrection does not have a significant effect on typing speed.},
keywords = {text entry, autocorrect, prediction, errors},
note = {ISS '20},
}
@article{yamanaka2020obstacle,
title = {Necessary and Unnecessary Obstacle Avoidance Movements Affect User Behaviors in Crossing Operations},
author = {Yamanaka, Shota and Stuerzlinger, Wolfgang},
journal = {Transactions on Computer-Human Interaction},
publisher = {ACM},
series = {TOCHI},
year = {2020},
month = {Nov},
volume = {27},
number = {6},
articleno = {44},
numpages = {31},
doi = {https://doi.org/10.1145/3418413},
pdf = {papers/obstacleavoidance.pdf},
teaser = {teasers/obstacleavoidance.png},
abstract = {The "crossing time" to pass between objects in lassoing tasks is predicted by Fitts' law. When an unwanted object, or obstacle, intrudes into the user's path, users curve the stroke to avoid hitting that obstacle. We empirically show that, in the presence of an obstacle, modified Fitts models for pointing with obstacle avoidance can significantly improve the prediction accuracy of movement time compared with standard Fitts' law. Yet, we also found that when an object is (only) close to the crossing path, i.e., a distractor, users still curve their stroke, even though the object does not intrude. We tested the effects of distractor proximity and length. While the crossing motion is modified by a nearby distractor, our results also identify that overall its effect on crossing times was small, and thus Fitts' law can still be applied safely with distractors.},
keywords = {steering, crossing, lasso, group selection, obstacle},
}
@comment{c, c={could be re-classified as misc, see also the blog entry: steed2020covidblog}}
@article{steed2020covid,
title = {Evaluating Immersive Experiences during {COVID-19} and Beyond},
author = {Steed, Anthony and Ortega, Francisco R. and Williams, Adam S. and Kruijff, Ernst and Stuerzlinger, Wolfgang and Batmaz, Anil Ufuk and Stevenson Won, Andrea and Suma Rosenberg, Evan and Simeone, Adalberto L. and Hayes, Aleshia},
journal = {Interactions},
publisher = {ACM},
year = {2020},
month = {Jul},
volume = {27},
number = {4},
pages = {62–67},
doi = {https://doi.org/10.1145/3406098},
pdf = {papers/evaluatingimmersive.pdf},
abstract = {The COVID-19 pandemic has disrupted our daily lives. The safety and well-being of people are paramount, and there is no exception for the human-computer interaction (HCI) field. Most universities and research labs have closed non-critical research labs. With that closure and the student populations having left campus, in-person user studies have been suspended for the foreseeable future. Experiments that involve the usage of specialized technology, such as virtual and augmented reality headsets, create additional challenges. While some head-mounted displays (HMDs) have become more affordable for consumers (e.g., Oculus Quest), there are still multiple constraints for researchers, including the expense of high-end HMDs (e.g., Microsoft Hololens), high-end graphics hardware, and specialized sensors, as well as ethical concerns around reusing equipment that comes in close contact with each participant and may be difficult to sterilize. These difficulties have led the extended reality (XR) community (which includes the virtual reality (VR) and augmented reality (AR) research communities) to ask how we can continue to practically and ethically run experiments under these circumstances. Here, we summarize the status of a community discussion of short-term, medium-term, and long-term measures to deal with the current COVID-19 situation and its potential longer-term impacts. In particular, we outline steps we are taking toward community support of distributed experiments. There are a number of reasons to look at a more distributed model of participant recruitment, including the generalizability of the work and potential access to target-specific, hard-to-reach user groups. We hope that this article will inform the first steps toward addressing the practical and ethical concerns for such studies.},
keywords = {3D user interfaces, COVID-19, virtual reality, augmented reality, extended reality},
}
@article{maiero2019backofdevice,
title = {Back-of-Device Force Feedback Improves Touchscreen Interaction for Mobile Devices},
author = {Maiero*, Jens and Eibich*, David and Kruijff, Ernst and Hinkenjann, André and Stuerzlinger, Wolfgang and Benko, Hrvoje and Ghinea, George},
journal = {Transactions on Haptics},
publisher = {IEEE},
series = {TOH},
year = {2019},
month = {Oct},
volume = {12},
number = {4},
pages = {483-496},
doi = {https://doi.org/10.1109/TOH.2019.2911519},
pdf = {papers/hapticphone.pdf},
teaser = {teasers/hapticphone.png},
abstract = {Touchscreen interaction suffers from occlusion problems as fingers can cover small targets, which makes interacting with such targets challenging. To improve touchscreen interaction accuracy and consequently the selection of small or hidden objects, we introduce a back-of-device force feedback system for smartphones. We introduce a new solution that combines force feedback on the back to enhance touch input on the front screen. The interface includes three actuated pins at the back of a smartphone. All three pins are driven by microservos and can be actuated up to a frequency of 50 Hz and a maximum amplitude of 5 mm. In a first psychophysical user study, we explored the limits of the system. Thereafter, we demonstrate through a performance study that the proposed interface can enhance touchscreen interaction precision, compared to state-of-the-art methods. In particular, the selection of small targets performed remarkably well with force feedback. The study additionally shows that users subjectively felt significantly more accurate with force feedback. Based on the results, we discuss back-to-front feedback design issues and demonstrate potential applications through several prototypical concepts to illustrate where the back-of-device force feedback could be beneficial.},
keywords = {haptics, mobile device, touch},
}
@comment{c, c={issue appeared in 2021}}
@article{nguyenvo2019naviboard,
title = {{NaviBoard} and {NaviChair}: Limited Translation Combined with Full Rotation for Efficient Virtual Locomotion},
author = {Nguyen-Vo*, Thinh and Riecke, Bernhard E. and Stuerzlinger, Wolfgang and Pham*, Duc-Minh and Kruijff, Ernst},
journal = {Transactions on Visualization and Computer Graphics},
publisher = {IEEE},
series = {TVCG},
year = {2019},
month = {Aug},
volume = {27},
number = {1},
pages = {165-177},
doi = {https://doi.org/10.1109/TVCG.2019.2935730},
pdf = {papers/naviboard.pdf},
video = {https://www.youtube.com/watch?v=JCYL2qVFO6M},
teaser = {teasers/naviboard.png},
abstract = {Walking has always been considered as the gold standard for navigation in Virtual Reality research. Though full rotation is no longer a technical challenge, physical translation is still restricted through limited tracked areas. While rotational information has been shown to be important, the benefit of the translational component is still unclear with mixed results in previous work. To address this gap, we conducted a mixed-method experiment to compare four levels of translational cues and control: none (using the trackpad of the HTC Vive controller to translate), upper-body leaning (sitting on a "NaviChair", leaning the upper-body to locomote), whole-body leaning/stepping (standing on a platform called NaviBoard, leaning the whole body or stepping one foot off the center to navigate), and full translation (physically walking). Results showed that translational cues and control had significant effects on various measures including task performance, task load, and simulator sickness. While participants performed significantly worse when they used a controller with no embodied translational cues, there was no significant difference between the NaviChair, NaviBoard, and actual walking. These results suggest that translational body-based motion cues and control from a low-cost leaning/stepping interface might provide enough sensory information for supporting spatial updating, spatial awareness, and efficient locomotion in VR, although future work will need to investigate how these results might or might not generalize to other tasks and scenarios.},
keywords = {3D navigation, speed control},
}
@article{wagner2019evaluating,
title = {Evaluating an Immersive Space-Time Cube Geovisualization for Intuitive Trajectory Data Exploration},
author = {Wagner Filho*, Jorge and Stuerzlinger, Wolfgang and Nedel, Luciana},
journal = {Transactions on Visualization and Computer Graphics},
publisher = {IEEE},
series = {TVCG},
year = {2019},
month = {Oct},
volume = {26},
number = {1},
pages = {514-524},
doi = {https://doi.org/10.1109/TVCG.2019.2934415},
pdf = {papers/stcvirtualdesk.pdf},
video = {videos/stcvirtualdesk.mp4},
teaser = {teasers/stcvirtualdesk.png},
abstract = {A Space-Time Cube enables analysts to clearly observe spatio-temporal features in movement trajectory datasets in geovisualization. However, its general usability is impacted by a lack of depth cues, a reported steep learning curve, and the requirement for efficient 3D navigation. In this work, we investigate a Space-Time Cube in the Immersive Analytics domain. Based on a review of previous work and selecting an appropriate exploration metaphor, we built a prototype environment where the cube is coupled to a virtual representation of the analyst's real desk, and zooming and panning in space and time are intuitively controlled using mid-air gestures. We compared our immersive environment to a desktop-based implementation in a user study with 20 participants across 7 tasks of varying difficulty, which targeted different user interface features. To investigate how performance is affected in the presence of clutter, we explored two scenarios with different numbers of trajectories. While the quantitative performance was similar for the majority of tasks, large differences appear when we analyze the patterns of interaction and consider subjective metrics. The immersive version of the Space-Time Cube received higher usability scores, much higher user preference, and was rated to have a lower mental workload, without causing participants discomfort in 25-minute-long VR sessions.},
keywords = {visual analytics, immersive analytics, space-time cube, 3D visualization},
note = {VIS '19},
}
@article{yamanaka2018analysis,
title = {Analysis and Modeling the Steering Operations in Sequential Linear Path Segments},
author = {Yamanaka*, Shota and Stuerzlinger, Wolfgang and Miyashita, Homei},
journal = {IPSJ Journal},
publisher = {Information Processing Society of Japan},
issn = {1882-7764},
year = {2018},
month = {Feb},
volume = {59},
number = {2},
pages = {633-643},
commented-url = {http://id.nii.ac.jp/1001/00185782},
url = {https://ipsj.ixsq.nii.ac.jp/records/185870},
keywords = {steering, lasso, group selection},
note = {In Japanese},
}
@article{seim2017passivehaptic,
title = {Passive Haptic Training to Improve Speed and Performance on a Keypad},
author = {Seim*, Caitlyn and Doering+, Nick and Zhang+, Yang and Stuerzlinger, Wolfgang and Starner, Thad},
journal = {Proceedings on Interactive, Mobile, Wearable and Ubiquitous Technologies},
publisher = {ACM},
series = {IMWUT},
year = {2017},
month = {Sep},
volume = {1},
number = {3},
articleno = {100},
numpages = {13},
doi = {https://doi.org/10.1145/3132026},
pdf = {papers/passivehapticslearning.pdf},
teaser = {teasers/passivehapticslearning.png},
abstract = {Learning text entry systems is challenging, yet necessary. Many layouts and keyboards exist, but they rely on laborious learning techniques. Passive haptic learning (PHL) has already demonstrated some benefit for learning the Braille text entry system. Could this computing-enabled technique be used to improve desktop keyboard typing skills? It is unknown whether passive haptic training can improve speed on a motor task (as opposed to initial learning). We use a randomized numeric keypad to examine users' typing performance with or without passive haptic training. When users were prevented from looking at the keyboard, the PHL group demonstrated consistent accuracy (-0.011 KSPC) while those in the control group greatly increased their error (+1.26 KSPC on average). This result is consistent with the finding that PHL users looked significantly less at the keyboard. In a second, longer study, users exposed to PHL were found to significantly improve their typing speed (mean increase of 11 WPM) versus control (mean increase of 2.2 WPM).},
keywords = {haptics, learning, text entry},
note = {Ubicomp '17},
}
@article{waese2017eplant,
title = {{ePlant}: Visualizing and Exploring Multiple Levels of Data for Hypothesis Generation in Plant Biology},
author = {Waese*, Jamie and Fan+, Jim and Pasha+, Asher and Yu+, Hans and Fucile, Geoffrey and Shi+, Ian and Cumming+, Matthew and Kelley, Lawrence and Sternberg, Michael and Krishnakumar, Vivek and Ferlanti, Erik and Miller, Jason and Town, Chris and Stuerzlinger, Wolfgang and Provart, Nicholas},
journal = {The Plant Cell},
publisher = {American Society of Plant Biologists},
year = {2017},
month = {Aug},
volume = {29},
number = {8},
pages = {1806-1821},
doi = {https://doi.org/10.1105/tpc.17.00073},
url = {http://bar.utoronto.ca/eplant},
pdf = {papers/eplant.pdf},
teaser = {teasers/eplant.png},
abstract = {A big challenge in current systems biology research arises when different types of data must be accessed from separate sources and visualized using separate tools. The high cognitive load required to navigate such a workflow is detrimental to hypothesis generation. Accordingly, there is a need for a robust research platform that incorporates all data and provides integrated search, analysis, and visualization features through a single portal. Here, we present ePlant (http://bar.utoronto.ca/eplant), a visual analytic tool for exploring multiple levels of Arabidopsis thaliana data through a zoomable user interface. ePlant connects to several publicly available web services to download genome, proteome, interactome, transcriptome, and 3D molecular structure data for one or more genes or gene products of interest. Data are displayed with a set of visualization tools that are presented using a conceptual hierarchy from big to small, and many of the tools combine information from more than one data type. We describe the development of ePlant in this article and present several examples illustrating its integrative features for hypothesis generation. We also describe the process of deploying ePlant as an "app" on Araport. Building on readily available web services, the code for ePlant is freely available for any other biological species research.},
keywords = {visualization, visual analytics},
}
@comment{c, c={not sure if this is best article or proceedings}}
@article{dwyer2016dagstuhl,
title = {Immersive Analytics (Dagstuhl Seminar 16231)},
author = {Dwyer, Tim and Henry Riche, Nathalie and Klein, Karsten and Stuerzlinger, Wolfgang and Thomas, Bruce H.},
journal = {Dagstuhl Reports},
publisher = {Schloss Dagstuhl-Leibniz-Zentrum fuer Informatik},
commented-series = {Dagstuhl Seminar 16231},
issn = {2192-5283},
year = {2016},
month = {Nov},
volume = {6},
number = {6},
pages = {1-9},
doi = {https://doi.org/10.4230/DagRep.6.6.1},
pdf = {papers/dagstuhl_IA.pdf},
teaser = {teasers/dagstuhl.png},
abstract = {This report documents the program and the outcomes of Dagstuhl Seminar 16231 "Immersive Analytics". Close to 40 researchers and practitioners participated in this seminar to discuss and define the field of Immersive Analytics, to create a community around it, and to identify its research challenges. As the participants had a diverse background in a variety of disciplines, including Human-Computer-Interaction, Augmented and Virtual Reality, Information Visualization, and Visual Analytics, the seminar featured a couple of survey talks on the first days, followed by plenary and working group discussions that were meant to shape the field of Immersive Analytics. As an outcome, a book publication is planned with book chapters provided by the participants.},
keywords = {visual analytics, visualization, immersive analytics},
}
@article{liang2013investigation,
title = {An Investigation of Suitable Interactions for {3D} Manipulation of Distant Objects Through a Mobile Device},
author = {Liang, Hai-Ning and Williams*, Cary and Semegen, Myron and Stuerzlinger, Wolfgang and Irani, Pourang},
journal = {International Journal on Innovative Computing, Information and Control},
issn = {1349-4198},
year = {2013},
month = {Dec},
volume = {9},
number = {12},
pages = {4737-4752},
url = {http://www.ijicic.org/vol-9(12).htm},
pdf = {papers/dualsurface2.pdf},
teaser = {teasers/dualsurface2.png},
abstract = {In this paper, we present our research linking two types of technologies that are gaining importance: mobile devices and large displays. Mobile devices now come integrated with a variety of sophisticated sensors, including multi-touch displays, gyroscopes and accelerometers, which allow them to capture rich varieties of gestures and make them ideal to be used as input devices to interact with an external display. In this research we explore what types of sensors are easy and intuitive to use to support people's exploration of 3D objects shown in large displays located at a distance. To conduct our research we have developed a device with two multi-touch displays, one on its front and the other in the back, and motion sensors. We then conducted an exploratory study in which we asked participants to provide interactions that they believe are easy and natural to perform operations with 3D objects. We have aggregated the results and found some common patterns about users' preferred input sensors and common interactions. In this paper we report the findings of the study and describe a new interface whose design is informed by the results.},
keywords = {3D manipulation, docking, mobile device},
}
@article{pintilie2013evaluation,
title = {An Evaluation of Interactive and Automated Next-best View Methods in {3D} Scanning},
author = {Pintilie*, Grigori D. and Stuerzlinger, Wolfgang},
journal = {Computer-Aided Design and Applications},
year = {2013},
month = {Mar},
volume = {10},
number = {2},
pages = {279-291},
doi = {https://doi.org/10.3722/cadaps.2013.279-291},
pdf = {papers/scanUI.pdf},
teaser = {teasers/scanUI.png},
abstract = {Scanning of objects to produce 3D models is becoming more commonplace as the required hardware is becoming less expensive and more widely attainable. The process involves obtaining scans of multiple views so as to create a complete 3D model. This is typically a user-driven process, and an analysis of the difficulty of this task, use of automation, visualization methods, and their effect on the final result has not yet been thoroughly investigated. In this paper we report on a user study related to 3D scanning in which the user is asked to use a simulated, somewhat simplified 3D scanner with a simple user interface. Our investigation focuses on scanning the complete surface of an object with decent sampling density, but does not take all sampling issues, such as reflections, into account. We evaluate different visualization methods, which aim to help the user complete or improve scans, and compare the results obtained by participants to those obtained using an automated approach. The results show that users can easily obtain complete scans or improve existing scans using this simple interface, and that different visualization methods are more or less equally effective; moreover, user performance is on par with automated scanning methods.},
keywords = {3D scanning, next-best view},
}
@article{mcarthur2010examining,
title = {Comparing {3D} Content Creation Interfaces in Two Virtual Worlds: World of Warcraft and Second Life},
author = {{McArthur}*, Victoria and Teather*, Robert J. and Stuerzlinger, Wolfgang},
journal = {Journal of Gaming & Virtual Worlds},
year = {2010},
month = {Dec},
volume = {2},
number = {3},
pages = {239-258},
doi = {https://doi.org/10.1386/jgvw.2.3.239_1},
pdf = {papers/3dui4virtualworldcreation.pdf},
teaser = {teasers/3dui4virtualworldcreation.png},
abstract = {In this article we compare the content creation systems of two popular virtual worlds: World of Warcraft and Second Life. We then discuss recommendations for 3D content creation systems based on current trends in 3D user interface research. We hypothesize that by designing 3D content creation systems that follow these recommendations, virtual world economies based on custom content creation (e.g., Second Life) may be transformed, as more people will be able to create and modify content.},
keywords = {3D modeling},
}
@article{bowman20083dui,
title = {{3D} User Interfaces: New Directions and New Perspectives},
author = {Bowman, Doug and Coquillart, Sabine and Fröhlich, Bernd and Hirose, Michitaka and Kitamura, Yoshifumi and Kiyokawa, Kiyoshi and Stuerzlinger, Wolfgang},
journal = {Computer Graphics & Applications},
publisher = {IEEE},
series = {CG&A},
year = {2008},
month = {Nov},
volume = {28},
number = {6},
pages = {20-36},
doi = {https://doi.org/10.1109/MCG.2008.109},
pdf = {papers/newdirections3dui.pdf},
abstract = {Three-dimensional user interfaces (3D UIs) allow users to interact with virtual objects, environments, or information using direct 3D input in the physical and/or virtual space. With the advent of systems like the Nintendo Wii, 3D UIs have entered the mainstream. Thus, research on 3D UIs is more relevant than ever. In this article, the founders and organizers of the IEEE Symposium on 3D User Interfaces reflect on the current state-of-the-art in several key aspects of 3D UIs, and speculate on future research directions for 3D UIs as well.},
keywords = {3D user interfaces},
}
@article{stuerzlinger2006covid,
title = {The Design and Realization of {CoViD}: A System for Collaborative Virtual {3D} Design},
author = {Stuerzlinger, Wolfgang and Zaman*, Loutfouz and Pavlovych*, Andriy and Oh*, Ji-Young},
journal = {Virtual Reality},
publisher = {Springer},
year = {2006},
month = {Oct},
volume = {10},
number = {2},
pages = {135-147},
doi = {https://doi.org/10.1007/s10055-006-0048-0},
pdf = {papers/covid.pdf},
teaser = {teasers/covid.png},
abstract = {Many important decisions in the design process are made fairly early on, after designers have presented initial concepts. In many domains, these concepts are already realized as 3D digital models. Then, in a meeting, the stakeholders for the project get together and evaluate these potential solutions. Frequently, the participants in this meeting want to interactively modify the proposed 3D designs to explore the design space better. Today's systems and tools do not support this, as computer systems typically support only a single user and computer-aided design tools require significant training.
This paper presents the design of a new system to facilitate a collaborative 3D design process. First, we discuss a set of guidelines which have been introduced by others and that are relevant to collaborative 3D design systems. Then, we introduce the new system, which consists of two main parts. The first part is an easy-to-use conceptual 3D design tool that can be used productively even by naive users. The tool provides novel interaction techniques that support important properties of conceptual design. The user interface is non-obtrusive, easy-to-learn, and supports rapid creation and modification of 3D models. The second part is a novel infrastructure for collaborative work, which offers an interactive table and several large interactive displays in a semi-immersive setup. It is designed to support multiple users working together. This infrastructure also includes novel pointing devices that work both as a stylus and a remote pointing device. The combination of the (modified) design tool with the collaborative infrastructure forms a new platform for collaborative virtual 3D design. Then, we present an evaluation of the system against the guidelines for collaborative 3D design. Finally, we present results of a preliminary user study, which asked naive users to collaborate in a 3D design task on the new system.},
keywords = {3D modeling, collaboration, design},
}
@article{vorozcovs2006hedgehog,
title = {The Hedgehog: A Novel Optical Tracking Method for Spatially Immersive Displays},
author = {Vorozcovs*, Andrew and Stuerzlinger, Wolfgang and Hogue*, Andrew and Allison, Robert},
journal = {Presence: Teleoperators & Virtual Environments},
year = {2006},
month = {Feb},
volume = {15},
number = {1},
pages = {108-121},
doi = {https://doi.org/10.1162/pres.2006.15.1.108},
pdf = {papers/hedgehog2.pdf},
teaser = {teasers/hedgehog2.png},
abstract = {Existing commercial technologies do not adequately meet the requirements for tracking in fully-enclosed Virtual Reality displays. We present a novel six degree of freedom tracking system, the Hedgehog, which overcomes several limitations inherent in existing sensors and tracking technology. The system reliably estimates the pose of the user's head with high resolution and low spatial distortion. Light emitted from an arrangement of lasers projects onto the display walls. An arrangement of cameras images the walls and the two-dimensional centroids of the projections are tracked to estimate the pose of the device. The system is able to handle ambiguous laser projection configurations, static and dynamic occlusions of the lasers, and incorporates an auto-calibration mechanism due to the use of the SCAAT (Single Constraint At A Time) algorithm. A prototype system was evaluated relative to a state-of-the-art motion tracker and showed comparable positional accuracy (1-2 mm RMS) and significantly better absolute angular accuracy (0.1 deg RMS).},
keywords = {3D tracking},
}
@article{seetzen2004hdrdisplay,
title = {High Dynamic Range Display Systems},
author = {Seetzen*, Helge and Heidrich, Wolfgang and Stuerzlinger, Wolfgang and Ward, Greg and Whitehead, Lorne and Trentacoste*, Matthew and Ghosh*, Abhijeet and Vorozcovs*, Andrew},
journal = {Transactions on Graphics},
publisher = {ACM},
series = {TOG},
year = {2004},
month = {Aug},
volume = {23},
number = {3},
pages = {760-768},
doi = {https://doi.org/10.1145/1015706.1015797},
pdf = {papers/hdrdisplays.pdf},
teaser = {teasers/hdrdisplays.png},
abstract = {The dynamic range of many real-world environments exceeds the capabilities of current display technology by several orders of magnitude. In this paper we discuss the design of two different display systems that are capable of displaying images with a dynamic range much more similar to that encountered in the real world. The first display system is based on a combination of an LCD panel and a DLP projector, and can be built from off-the-shelf components. While this design is feasible in a lab setting, the second display system, which relies on a custom-built LED panel instead of the projector, is more suitable for usual office workspaces and commercial applications. We describe the design of both systems as well as the software issues that arise. We also discuss the advantages and disadvantages of the two designs and potential applications for both systems.},
keywords = {high dynamic range, display},
note = {SIGGRAPH '04},
}
@article{oh2004conceptual,
title = {A System for Desktop Conceptual {3D} Design},
author = {Oh*, Ji-Young and Stuerzlinger, Wolfgang},
journal = {Virtual Reality},
publisher = {Springer},
year = {2004},
month = {Jun},
volume = {7},
number = {3-4},
pages = {198-211},
doi = {https://doi.org/10.1007/s10055-004-0128-y},
pdf = {papers/virtuallegodraft.pdf},
teaser = {teasers/virtuallego.png},
abstract = {In the traditional design process for a 3D environment, people usually depict a rough prototype to verify their ideas, and iteratively modify its configuration until they are satisfied with the general layout. In this activity, one of the main operations is the rearrangement of single and composite parts of a scene. With current desktop virtual reality (VR) systems, the selection and manipulation of arbitrary objects in 3D is still difficult. In this work, we present new and efficient techniques that allow even novice users to perform meaningful rearrangement tasks with traditional input devices. The results of our work show that the presented techniques can be mastered quickly and enable users to perform complex tasks on composite objects. Moreover, the system is easy to learn, supports creativity, and is fun to use.},
keywords = {3D modeling, 3D manipulation, 3D positioning, content creation, design},
}
@article{parilov2002perpixel,
title = {Per-pixel divisions},
author = {Parilov*, Sergey and Stuerzlinger, Wolfgang},
journal = {Journal of Graphics Tools},
series = {JGT},
year = {2002},
month = {Jun},
volume = {7},
number = {4},
pages = {53-59},
doi = {https://doi.org/10.1080/10867651.2002.10487572},
pdf = {papers/divisions.pdf},
abstract = {We describe a method to perform per-pixel divisions using graphics hardware, with a simple iterative algorithm. In the worst case, the number of rendering passes is 17 for approximate divisions, and 18 for accurate divisions. The algorithm can be used for 3D vector normalization, evaluating complex lighting models, and image reconstruction.},
keywords = {rendering, real-time},
}
@article{parilov2002layered,
title = {Layered Relief Textures},
author = {Parilov*, Sergey and Stuerzlinger, Wolfgang},
journal = {Journal of WSCG},
issn = {1213-6972},
year = {2002},
month = {Feb},
volume = {10},
number = {2},
pages = {357-364},
url = {http://wscg.zcu.cz/wscg2002/Papers_2002/F87.pdf},
pdf = {papers/lrt.pdf},
teaser = {teasers/lrt.png},
abstract = {In this paper we present an Image-Based Rendering method for post-warping LDI's in real-time on existing systems. The algorithm performs accurate splatting at low computational costs, reduces memory-access bottlenecks, enables us to trade-off the quality for the speed, and is simple to implement.},
keywords = {rendering, real-time, image-based},
note = {WSCG '02},
}
@article{elinas2000realtime,
title = {Real-time Rendering of {3D} Clouds},
author = {Elinas*, Pantelis and Stuerzlinger, Wolfgang},
journal = {Journal of Graphics Tools},
series = {JGT},
year = {2000},
month = {Jul},
volume = {5},
number = {4},
pages = {33-45},
doi = {https://doi.org/10.1080/10867651.2000.10487531},
pdf = {papers/clouds.pdf},
teaser = {teasers/clouds.png},
abstract = {The visual realism of a computer graphics simulation of outdoor scenery is greatly enhanced by realistic display of clouds. In this paper, we present an algorithm based on Gardner's work that can render perspectively correct 3D clouds in real-time on current graphics hardware. The use of 3D ellipsoids as primitives permits even close-ups without the viewer noticing the approximation. We describe an implementation using OpenGL.},
keywords = {rendering, real-time, image-based},
}
@article{stuerzlinger1998raytracing,
title = {Ray-Tracing Triangular Trimmed Free-Form Surfaces},
author = {Stürzlinger, Wolfgang},
journal = {Transactions on Visualization and Computer Graphics},
publisher = {IEEE},
series = {TVCG},
year = {1998},
month = {Jul},
volume = {4},
number = {3},
pages = {202-214},
doi = {https://doi.org/10.1109/2945.722295},
pdf = {papers/rtttffs.pdf},
teaser = {teasers/rtttffs.png},
abstract = {This paper presents a new approach to rendering triangular algebraic free form surfaces. A hierarchical subdivision of the surface with associated tight bounding volumes provides for quick identification of the surface regions likely to be hit by a ray. For each leaf of the hierarchy an approximation to the corresponding surface region is stored. The approximation is used to compute a good starting point for the iteration, which ensures rapid convergence.
Trimming curves are described by a tree of trimming primitives such as squares, circles, polygons and free form curves combined with Boolean operations. For trimmed surfaces an irregular adaptive subdivision is constructed to quickly eliminate all parts outside the trimming curve from consideration during rendering. Cost heuristics are introduced to optimize the rendering time further.},
keywords = {rendering, ray tracing},
}
@comment{c, c={unfortunate-dup, because paper selected by conference for journal, but conference proceedings later also reclassified as journal by publisher}}
@article{stuerzlinger1998calculating,
title = {Calculating Global Illumination for Glossy Surfaces},
author = {Stürzlinger, Wolfgang},
journal = {Computers & Graphics},
publisher = {Elsevier},
series = {C&G},
year = {1998},
month = {Mar},
volume = {22},
number = {2-3},
pages = {175-180},
doi = {https://doi.org/10.1016/S0097-8493(98)00004-1},
pdf = {papers/calcglos.pdf},
teaser = {teasers/calcglos.png},
abstract = {Photorealistic rendering is used to generate views of computer stored scenes. Global illumination algorithms take all transfers of light in the scene into account thereby creating a realistic looking image. Previously several approaches have been presented which are able to deal with global illumination for diffuse surfaces. More general surfaces are handled only by few methods.
This work presents a new algorithm for the generation of photorealistic images for scenes with arbitrary surfaces. Initially particle tracing and a reconstruction phase are used to obtain a good approximation to the directionally dependent illumination in the scene. The illumination information is stored and can be used subsequently to generate images from different viewpoints directly from the stored solution. The whole system is structured into several independent phases and is designed to allow parallel processing and incremental refinement.},
keywords = {rendering, global illumination},
}
@comment{c, c={unfortunate-dup, because conference proceedings later reclassified as journal volume by WSCG}}
@article{stuerzlinger1997optimized,
title = {Global Illumination with Glossy Surfaces},
author = {Stürzlinger, Wolfgang},
journal = {Journal of WSCG},
issn = {1213-6972},
year = {1997},
month = {Feb},
volume = {5},
number = {3},
pages = {543-551},
url = {http://wscg.zcu.cz/wscg1997/papers97/Stuerzlinger_97.pdf},
pdf = {papers/glossyill.pdf},
teaser = {teasers/glossyill.png},
abstract = {Photorealistic rendering is used to generate views of computer stored scenes. Global illumination algorithms take all transfers of light in the scene into account thereby creating a realistic looking image. Previously several approaches have been presented which are able to deal with global illumination for diffuse surfaces. More general surfaces are handled only by few methods.
This work presents a new algorithm for the generation of photorealistic images for scenes with arbitrary surfaces. Initially particle tracing and a reconstruction phase are used to obtain a good approximation to the directionally dependent illumination in the scene. The illumination information is stored and can be used subsequently to generate images from different viewpoints directly from the stored solution. The whole system is structured into several independent phases and is designed to allow parallel processing and incremental refinement.},
keywords = {rendering, global illumination},
note = {WSCG '97},
footnote = {Conference proceedings later republished as journal volume by publisher},
}
@article{schaufler_stuerzlinger1996three,
title = {Three Dimensional Image Cache for Virtual Reality},
author = {Schaufler*, Gernot and Stürzlinger, Wolfgang},
journal = {Computer Graphics Forum},
year = {1996},
month = {Aug},
volume = {15},
number = {3},
pages = {227-235},
doi = {https://doi.org/10.1111/1467-8659.1530227},
commented-url = {http://www.gup.uni-linz.ac.at:8001/staff/schaufler/papers/octimp},
pdf = {papers/octimp.pdf},
teaser = {teasers/octimp.png},
abstract = {Despite recent advances in rendering hardware, large and complex virtual environments cannot be displayed with a sufficiently high frame rate, because of limitations in the available rendering performance. This paper presents a new approach of software accelerated rendering which draws from the concepts of impostors, hierarchical scene subdivision and levels of detail. So far software optimization in real-time rendering has merely considered individual objects. This work is actually optimizing the rendering of the whole virtual environment by implementing a three dimensional image cache. It speeds up rendering for large portions of the scene by exploiting the coherence inherent in any smooth frame sequence. The implementation of the three dimensional image cache is discussed and the savings in rendering load achievable on a suitable hardware platform are presented.},
keywords = {rendering, real-time},
award = {This work received a Günther Enderle award for Best Technical Paper},
note = {Eurographics '96},
footnote = {A co-evolution with "Hierarchical image caching for accelerated walkthroughs of complex environments", https://doi.org/10.1145/237170.237209},
}
@comment{c, c={conference proceedings later reclassified as journal volume by publisher}}
@article{stuerzlinger1996optimized,
title = {Optimized Local Pass Using Importance Sampling},
author = {Stürzlinger, Wolfgang},
journal = {Journal of WSCG},
issn = {1213-6972},
year = {1996},
month = {Feb},
volume = {4},
number = {2},
pages = {342-349},
url = {http://wscg.zcu.cz/wscg1996/papers96/Stuerzlinger_96.pdf},
pdf = {papers/localpass.pdf},
teaser = {teasers/localpass.png},
abstract = {Recent approaches to realistic image synthesis split the rendering process into two passes. The first pass calculates an approximate global illumination solution, the second produces an image of high quality (from a user selected view point) using the solution obtained in the first pass by applying the local illumination model to each surface point visible through each pixel.
This paper presents two new methods to compute the local illumination quickly. Instead of recalculating form factors and visibilities the information computed by a hierarchical radiosity solution algorithm is reused. The image generation time is reduced significantly by using stochastic methods.},
keywords = {rendering, global illumination},
note = {WSCG '96},
footnote = {Conference proceedings later republished as journal volume by publisher},
}
@comment{c, c={conference proceedings later reclassified as journal volume by publisher}}
@article{stuerzlinger1994parallel,
title = {Parallel Progressive Radiosity with Parallel Visibility Computations},
author = {Stürzlinger, Wolfgang and Wild*, Christoph},
journal = {Journal of WSCG},
issn = {1213-6972},
year = {1994},
month = {Feb},
volume = {2},
number = {1},
pages = {66-74},
url = {http://wscg.zcu.cz/wscg1994/papers94/Stuerzlinger_Wild_94.pdf},
pdf = {papers/parrad.pdf},
teaser = {teasers/parrad.png},
abstract = {The radiosity method models the interaction of light between diffuse reflecting surfaces, thereby accurately predicting global illumination effects. Due to the high computational effort to calculate the transfer of light between surfaces and the memory requirements for the scene description, a distributed, parallelized version of the algorithm is needed for scenes consisting of thousands of surfaces. We present a distributed, parallel radiosity algorithm, which can subdivide the surfaces adaptively. Additionally we present a scheme for parallel visibility calculations. Adaptive load redistribution is also discussed.},
keywords = {rendering, global illumination, parallel, visibility},
note = {WSCG '94},
footnote = {Conference proceedings later republished as journal volume by publisher},
}
@comment{c, c={leave the "_stuerzlinger" in the ID to enable umlaut-free search!}}
@article{barth_stuerzlinger1993efficient,
title = {Efficient Ray Tracing for Bezier and B-Spline Surfaces},
author = {Barth, Wilhem and Stürzlinger, Wolfgang},
journal = {Computers & Graphics},
publisher = {Elsevier},
series = {C&G},
year = {1993},
month = {Jul},
volume = {17},
number = {4},
pages = {423-430},
doi = {https://doi.org/10.1016/0097-8493(93)90031-4},
pdf = {papers/rtbez.pdf},
teaser = {teasers/rtbez.png},
abstract = {Generating realistic pictures by raytracing requires intersecting the objects with many rays (1~ million or more). With Bezier or B-Spline surfaces as objects the intersections must be calculated by an iterative method. This paper describes an algorithm which performs these calculations efficiently. In a preprocessing step the surface is subdivided adaptively into parts and a tight enclosure is calculated for each part. We selected parallelepipeds (first order approximations) as enclosures, their orientation and the angles between their edges are chosen in such a way that they enclose the respective part as tightly as possible, they are not rectangular in general. A binary tree built with these enclosures allows to test very fast which parts of the surface may be hit by a given ray. The leaves of the tree contain small, almost plane parts of the surface. For each part a linear approximation is calculated, this is a parallelogram, in general not rectangular. For each ray which hits the enclosure the intersection with this approximation is calculated first, yielding an accurate starting point for the following iteration.},
keywords = {rendering, ray tracing},
}
@comment{************************articles_in_books************************}
@inbook{seetzen2023hdrdisplay,
title = {High Dynamic Range Display Systems},
author = {Seetzen*, Helge and Heidrich, Wolfgang and Stuerzlinger, Wolfgang and Ward, Greg and Whitehead, Lorne and Trentacoste*, Matthew and Ghosh*, Abhijeet and Vorozcovs*, Andrew},
booktitle = {Seminal Graphics Papers: Pushing the Boundaries},
publisher = {ACM},
year = {2023},
month = {Aug},
volume = {2},
articleno = {5},
numpages = {9},
edition = {1},
doi = {https://doi.org/10.1145/3596711.3596717},
pdf = {papers/hdrdisplays2.pdf},
teaser = {teasers/hdrdisplays.png},
abstract = {The dynamic range of many real-world environments exceeds the capabilities of current display technology by several orders of magnitude. In this paper we discuss the design of two different display systems that are capable of displaying images with a dynamic range much more similar to that encountered in the real world. The first display system is based on a combination of an LCD panel and a DLP projector, and can be built from off-the-shelf components. While this design is feasible in a lab setting, the second display system, which relies on a custom-built LED panel instead of the projector, is more suitable for usual office workspaces and commercial applications. We describe the design of both systems as well as the software issues that arise. We also discuss the advantages and disadvantages of the two designs and potential applications for both systems.},
keywords = {high dynamic range, display},
note = {Republished by ACM},
}
@inbook{batmaz2022rotposjitter,
title = {Rotational and Positional Jitter in Virtual Reality Interaction},
author = {Batmaz, Anil Ufuk and Stuerzlinger, Wolfgang},
booktitle = {Everyday Virtual Reality},
publisher = {Springer},
year = {2022},
month = {May},
pages = {89–118},
doi = {https://doi.org/10.1007/978-3-031-05804-2_4},
pdf = {papers/rotposjitter.pdf},
teaser = {teasers/rotposjitter.png},
abstract = {One of the elements that affect 3D tracking performance in Virtual Reality (VR) systems is fluctuations in the signal, called jitter, which occurs regardless of the sensor technology used. In real-life VR systems, positional and rotational jitter can be found in all tracked objects, including the headset, controllers, or other trackers. Previous work had identified that ±0.5° rotational jitter negatively affects user performance for distal pointing. Yet, they also found that even using a second controller to reduce the “Heisenberg effect” introduced by the button press does not address the problem completely. Moreover, with jitter on the position of a virtual object, user performance significantly decreases with jitter above one fourth of the size of that virtual object. Still, users preferred to have positional jitter on a virtual target rather than rotational jitter on a VR controller. In this paper, we extended the previous literature by conducting a user study on angular jitter with controllers held with two different grip styles and targets at two different depth distances. The results revealed that user performance decreases (already) with ±0.25° jitter. Thus, we suggest that practitioners/developers who design 3D user interfaces, controllers, and interaction techniques for daily 3D VR usage should focus on reducing jitter. Decreasing jitter not only improves user performance, but also decreases frustration, which improves the user experience.},
keywords = {3D pointing, mid-air, jitter},
}
@inbook{dwyer2018immersive,
title = {Immersive analytics: An Introduction},
author = {Dwyer, Tim and Marriott, Kim and Isenberg, Tobias and Klein, Karsten and Riche, Nathalie and Schreiber, Falk and Stuerzlinger, Wolfgang and Thomas, Bruce H.},
booktitle = {Immersive Analytics},
publisher = {Springer},
year = {2018},
month = {Oct},
volume = {LNCS 11190},
pages = {1-23},
doi = {https://doi.org/10.1007/978-3-030-01388-2_1},
pdf = {papers/IAchapter1_Intro.pdf},
teaser = {teasers/iabook.png},
abstract = {Immersive Analytics is a new research initiative that aims to remove barriers between people, their data and the tools they use for analysis and decision making. Here we clarify the aims of immersive analytics research, its opportunities and historical context, as well as providing a broad research agenda for the field. In addition, we review how the term immersion has been used to refer to both technological and psychological immersion, both of which are central to immersive analytics research.},
keywords = {immersive analytics, visualization, visual analytics},
}
@inbook{marriott2018immersive,
title = {Immersive Analytics: Time to Reconsider the Value of {3D} for Information Visualisation},
author = {Marriott, Kim and Chen, Jian and Hlawatsch, Marcel and Itoh, Takayuki and Nacenta, Miguel A. and Reina, Guido and Stuerzlinger, Wolfgang},
booktitle = {Immersive Analytics},
publisher = {Springer},
year = {2018},
month = {Oct},
volume = {LNCS 11190},
pages = {25-55},
doi = {https://doi.org/10.1007/978-3-030-01388-2_2},
pdf = {papers/IAchapter2_3DVis.pdf},
teaser = {teasers/iabook.png},
abstract = {Modern virtual reality display technologies engender spatial immersion by using a variety of depth cues such as perspective and head-tracked binocular presentation to create visually realistic 3D worlds. While 3D visualisations are common in scientific visualisation, they are much less common in information visualisation. In this chapter we explore whether immersive analytic applications should continue to use traditional 2D information visualisations or whether there are situations when 3D may offer benefits. We identify a number of potential applications of 3D depth cues for abstract data visualisation: using depth to show an additional data dimension, such as in 2.5D network layouts, views on non-flat surfaces and egocentric views in which the data is placed around the viewer, and visualising abstract data with a spatial embedding. Another important potential benefit is the ability to arrange multiple views in the 3D space around the user and to attach abstract visualisations to objects in the real world.},
keywords = {immersive analytics, visual analytics, 3D visualization},
}
@inbook{bueschel2018interaction,
title = {Interaction for Immersive Analytics},
author = {Büschel, Wolfgang and Chen, Jian and Dachselt, Raimund and Drucker, Steven and Dwyer, Tim and Görg, Carsten and Isenberg, Tobias and Kerren, Andreas and North, Chris and Stuerzlinger, Wolfgang},
booktitle = {Immersive Analytics},
publisher = {Springer},
year = {2018},
month = {Oct},
volume = {LNCS 11190},
pages = {95-138},
doi = {https://doi.org/10.1007/978-3-030-01388-2_4},
pdf = {papers/IAchapter4_Interaction.pdf},
teaser = {teasers/iabook.png},
abstract = {In this chapter, we briefly review the development of natural user interfaces and discuss their role in providing human-computer interaction that is immersive in various ways. Then we examine some opportunities for how these technologies might be used to better support data analysis tasks. Specifically, we review and suggest some interaction design guidelines for immersive analytics. We also review some hardware setups for data visualization that are already archetypal. Finally, we look at some emerging system designs that suggest future directions.},
keywords = {immersive analytics, visualization, visual analytics},
}
@inbook{stuerzlinger2018immersive,
title = {Immersive human-centered computational analytics},
author = {Stuerzlinger, Wolfgang and Dwyer, Tim and Drucker, Steven and Görg, Carsten and North, Chris and Scheuermann, Gerik},
booktitle = {Immersive Analytics},
publisher = {Springer},
year = {2018},
month = {Oct},
volume = {LNCS 11190},
pages = {139-163},
doi = {https://doi.org/10.1007/978-3-030-01388-2_5},
pdf = {papers/IAchapter5_humancentered.pdf},
teaser = {teasers/iabook.png},
abstract = {In this chapter we seek to elevate the role of the human in human-machine cooperative analysis through a careful consideration of immersive design principles. We consider both strategic immersion through more accessible systems as well as enhanced understanding and control through immersive interfaces that enable rapid workflows. We extend the classic sensemaking loop from visual analytics to incorporate multiple views, scenarios, people, and computational agents. We consider both sides of machine/human collaboration: allowing the human to more fluidly control the machine process; and also allowing the human to understand the results, derive insights and continue the analytic cycle. We also consider system and algorithmic implications of enabling real-time control and feedback in immersive human-centered computational analytics.},
keywords = {immersive analytics, visualization, visual analytics, collaboration},
}
@inbook{marriott2018just,
title = {Just 5 Questions: Toward a Design Framework for Immersive Analytics},
author = {Marriott, Kim and Chen, Jian and Hlawatsch, Marcel and Itoh, Takayuki and Nacenta, Miguel A. and Reina, Guido and Stuerzlinger, Wolfgang},
booktitle = {Immersive Analytics},
publisher = {Springer},
year = {2018},
month = {Oct},
volume = {LNCS 11190},
pages = {259-288},
doi = {https://doi.org/10.1007/978-3-030-01388-2_9},
pdf = {papers/IAchapter9_5Questions.pdf},
teaser = {teasers/iabook.png},
abstract = {We present an initial design framework for immersive analytics based on Brehmer and Munzner's "What-Why-How" data visualisation framework. We extend their framework to take into account Who are the people or teams of people who are going to use the system, and Where is the system to be used and what are the available devices and technology. In addition, the How component is extended to cater for collaboration, multisensory presentation, interaction with an underlying computational model, degree of fidelity and organisation of the workspace around the user. By doing so we provide a framework for understanding immersive analytics research and applications as well as clarifying how immersive analytics differs from traditional data visualisation and visual analytics.},
keywords = {immersive analytics, visualization, visual analytics},
}
@inbook{stuerzlinger2014considerations,
title = {Considerations for Targets in {3D} Pointing Experiments},
author = {Stuerzlinger, Wolfgang and Teather*, Robert J.},
booktitle = {{HCI} Korea},
series = {HCIK '15},
year = {2014},
commented-year = {2015},
month = {Dec},
commented-month = {Jan},
pages = {162–168},
url = {https://dl.acm.org/doi/abs/10.5555/2729485.2729510},
pdf = {papers/considerations.pdf},
teaser = {teasers/considerations.png},
abstract = {We identify various tradeoffs in the design of 3D pointing experiments based on Fitts' law and the ISO9241-9 methodology. The advantages and disadvantages of several approaches for such experiments are analyzed and compared against each other. Results of an experiment that investigates various visual aids are presented as evidence. We conclude with recommendations for 3D pointing experiments and avenues of future work.},
keywords = {3D pointing},
}
@inbook{stuerzlinger2011value,
title = {The Value of Constraints for {3D} User Interfaces},
author = {Stuerzlinger, Wolfgang and Wingrave*, Chad},
booktitle = {Virtual Realities},
publisher = {Springer},
year = {2011},
month = {Jan},
pages = {203-224},
doi = {https://doi.org/10.1007/978-3-211-99178-7_11},
pdf = {papers/valueconstraints.pdf},
abstract = {User interfaces to three-dimensional environments are becoming more and more popular. Today this trend is fuelled through the introduction of social communication via virtual worlds, console and computer games, as well as 3D televisions.
We present a synopsis of the relevant abilities and restrictions introduced by both input and output technologies, as well as an overview of related human capabilities and limitations, including perceptual and cognitive issues. Partially based on this, we present a set of guidelines for 3D user interfaces. These guidelines are intended for developers of interactive 3D systems, such as computer and console games, 3D modeling packages, augmented reality systems, computer aided design systems, and virtual environments. The guidelines promote techniques, such as using appropriate constraints, that have been shown to work well in these types of environments.},
keywords = {3D user interfaces, constraints},
}
@comment{************************conference_articles************************}
@inproceedings{gemici2026crossingrealities,
title = {Crossing Realities Has a Cost: Evaluating AR Second Screens for AI-Assisted Desktop Authoring},
author = {Gemici*, Mucahit and Bashar*, Mohammad Raihanul and Stuerzlinger, Wolfgang and Phadnis, Vrushank and Batmaz, Anil Ufuk},
booktitle = {Symposium on Spatial User Interaction},
publisher = {ACM},
series = {SUI '26},
year = {2026},
month = {Oct},
commented-articleno = {2},
numpages = {12},
commented-doi = {https://doi.org/10.1145/00000.00000},
commented-pdf = {papers/crossingrealities.pdf},
commented-teaser = {teasers/crossingrealities.png},
abstract = {AI-assisted authoring requires users to frequently exchange user-generated and AI-generated content between a primary workspace and a Large Language Model (LLM) assistant. Such repetitive actions can fragment attention and compete for limited display space. While Augmented Reality (AR) has been proposed as a way to extend desktop workspaces with virtual displays, just adding a spatial display area does not address the repeated attention shifts, input-focus changes, and content-transfer steps required in LLM-assisted workflows. This creates a gap in understanding whether AR second screens support such workflows or introduce cross-reality transition costs that limit their effectiveness. To investigate this gap, we designed an AR-Second-Screen system around a unified keyboard-and-mouse interaction model and evaluated it against Single-Screen and Dual-Screen desktop setups. Results show that Dual-Screen remained more efficient than AR-Second-Screen, with significantly lower task completion time and switching cost. AR-Second-Screen also produced higher task and LLM idle ratios, indicating re-engagement costs when users crossed between physical and virtual workspaces. At the same time, participants rated AR positively and preferred it significantly over Single-Screen, with no significant difference in preference compared to Dual-Screen. These findings show that spatially extending AI-assisted workflows into AR can be appealing, yet effective cross-reality interfaces must minimize transition costs rather than just simply adding a virtual display space.},
keywords = {extended reality, LLM, crossing realities},
note = {Conditionally accepted, to appear},
}
@inproceedings{noh2026drattention,
title = {Exploring Diminished Reality for Attention Support: A Co-Design Study with Students with ADHD},
author = {Noh+, Alex and Safikhani+, Audrey and Zhu*, Anjun and Stuerzlinger, Wolfgang and Kim, Lawrence},
booktitle = {Designing Interactive Systems},
publisher = {ACM},
series = {DIS '26},
year = {2026},
month = {Jun},
pages = {891-903},
doi = {https://doi.org/10.1145/3800645.3813095},
pdf = {papers/drattention.pdf},
commented-video = {videos/drattention.mp4},
teaser = {teasers/drattention.png},
abstract = {Diminished Reality (DR) modifies or removes elements of the perceived environment. We explored DR for attention support through diary studies, interviews, and speculative co-design with 15 university students with ADHD. Participants described a persistent gap between intention and attention, and the use of externalization strategies that encounter fundamental limits in physical reality. In co-design, rather than reasoning from visual operations, participants articulated which properties of stimuli they needed to perceive versus filter, revealing cases where visual diminishment does not reliably map to attentional diminishment. We contribute rich descriptive data on the attentional challenges and DR preferences of students with ADHD, and propose Attentional Diminishment, a sensitizing concept that reframes DR for attention support from visual outcomes to attentional effects.},
keywords = {diminished reality, filtered reality, adhd, attention deficit hyperactivity disorder},
}
@inproceedings{amini2026steeringthroughput3d,
title = {Improving Steering Law Throughput Calculation by Defining Effective Parameters in 3D Virtual Environments},
author = {Amini*, Mohammadreza and Stuerzlinger, Wolfgang and Yamanaka, Shota and Liang, Hai-Ning and Batmaz, Anil Ufuk},
booktitle = {Conference on Human Factors in Computing Systems},
publisher = {ACM},
series = {CHI '26},
year = {2026},
month = {Apr},
articleno = {1141},
numpages = {20},
doi = {https://doi.org/10.1145/3772318.3790579},
pdf = {papers/steeringthroughput3d.pdf},
video = {videos/steeringthroughput3d.mp4},
teaser = {teasers/steeringthroughput3d.png},
abstract = {Throughput is a widely used performance metric, combining speed and accuracy into a single measure, while reducing the effect of subjective speed–accuracy trade-offs. Despite its wide application in 2D steering tasks, its direct extension to 3D presents unique challenges since 3D trajectories exhibit higher variability, and perceptual–motor factors undermine existing formulations. Consequently, throughput has not been systematically adopted for evaluating steering in 3D virtual environments. In this paper, using a controlled virtual reality user study with a ring-and-wire task, we introduce and validate a novel throughput formulation for 3D steering based on the bivariate standard deviation of the trajectory for the effective width calculation. Our results show that this formulation provides smoother throughput values across subjective speed–accuracy differences and improves model fit compared to traditional approaches. This work advances our theoretical understanding of the Steering law in 3D contexts, provides researchers and practitioners with a robust evaluation method, and establishes a foundation for future studies of complex 3D trajectory interactions.},
keywords = {3D steering, 3D user interface, 3D interaction, trajectory-based interaction, behavior modeling},
}
@inproceedings{turkmen2026handvis,
title = {Investigating Adaptive Hand Visibilities for Accurate 3D User Interactions in Augmented Reality},
author = {Turkmen*, Rumeysa and Hatira*, Nour and Teather, Robert J and Kersten-Oertel, Marta and Stuerzlinger, Wolfgang and Batmaz, Anil Ufuk},
booktitle = {Conference on Virtual Reality and {3D} User Interfaces Abstracts and Workshops, Workshop on Novel Input Devices and Interaction Techniques at {VR}},
publisher = {IEEE},
series = {NIDIT '26},
year = {2026},
month = {Mar},
pages = {338-343},
doi = {https://doi.org/10.1109/VRW70859.2026.00067},
pdf = {papers/handvis.pdf},
teaser = {teasers/handvis.png},
commented-video = {videos/handvis.mp4},
abstract = {Augmented Reality (AR) tasks that require fine motor control often rely on visual hand representations, yet fully visible hands can introduce occlusion and reduce accuracy. In this work, we investigate adaptive hand visualization techniques that dynamically adjust hand visibility based on the current interaction phase to improve accuracy in AR. We designed an AR-based pedicle screw placement task, in which users insert virtual screws into a physical spine model. To evaluate how hand visualization affects task performance, we conducted a user study with 15 participants who performed the task under five hand visualization conditions: Opaque, Transparent, Invisible, Speed-based and Position-based visibility. Our results show that adaptive visualization techniques significantly improve screw placement accuracy compared to the commonly used opaque hand representation. These findings demonstrate the benefits of dynamically adapting hand visibility can support accuracy-critical interactions.},
keywords = {hand visibility, 3D docking},
}
@inproceedings{zhao2026hybridsthfp,
title = {A User-Friendly Accurate Bare-Handed Manipulation Technique for Distant Objects in Virtual Reality},
author = {Zhao*, Di Bill and Stuerzlinger, Wolfgang},
booktitle = {Conference on Virtual Reality and {3D} User Interfaces Abstracts and Workshops, Workshop on Novel Input Devices and Interaction Techniques at {VR}},
publisher = {IEEE},
series = {NIDIT '26},
year = {2026},
month = {Mar},
pages = {373-378},
doi = {https://doi.org/10.1109/VRW70859.2026.00073},
pdf = {papers/hybridsthfp.pdf},
teaser = {teasers/hybridsthfp.png},
video = {videos/hybridsthfp.mp4},
abstract = {Bare-hand interaction is now common in virtual reality, but does not afford accurate manipulation of distant objects. Prior approaches rely on ray-casting, motion scaling, proxies, or near-field widgets, often trading precision for speed or increasing cognitive and physical demand. We present two bare-hand techniques for distant object manipulation: Scaled Two-Hand Finger-Palm (STHFP), which uses the non-dominant hand as a control surface for precise manipulation, and HYBRID, which combines fast ray-based positioning with two-handed refinement.
Results from our user study comparing STHFP and HYBRID against scaled bare-hand HOMER show that both new techniques significantly improve positional and rotational accuracy while reducing physical workload. While STHFP requires more interaction time, HYBRID achieves a balanced trade-off between speed and precision. Qualitative findings further reveal how constraint-based control and staged workflows shape user strategies and perceived effort. Together, our results demonstrate that leveraging the hand as a control surface can enable accurate, usable, and controller-free manipulation of distant objects in VR.},
keywords = {hand interaction, bare-hand, 3D manipulation, 3D positioning, 3D rotation, 3D pose},
}
@inproceedings{liu2026scaledmouse,
title = {Scaled Mouse: An Efficient and Accurate Interaction Technique for 3D Docking in Seated VR},
author = {Liu*, Xinpeng and Zhao*, Di Bill and Stuerzlinger, Wolfgang},
booktitle = {Conference on Virtual Reality and {3D} User Interfaces},
publisher = {IEEE},
series = {VR '26},
year = {2026},
month = {Mar},
pages = {718-728},
doi = {https://doi.org/10.1109/VR67842.2026.00091},
pdf = {papers/scaledmouse.pdf},
video = {videos/scaledmouse.mp4},
teaser = {teasers/scaledmouse.png},
abstract = {This paper presents an empirical evaluation of mouse-based interaction in seated Virtual Reality (VR) scenarios as an alternative to traditional VR controllers. We introduce Scaled Mouse, an interaction technique that shows the position of the real mouse in VR and maps standard mouse actions to 3D object manipulation using velocity-based scaling. We present two user studies assessing this method. In the first study, we compared a VR controller against our mouse-based method for manipulation tasks. Results show that the mouse consistently achieved higher rotation accuracy in 3D rotation and docking tasks than the controller, while maintaining comparable task completion times. Building on prior scaled interaction techniques, our second study investigated mouse interaction in a productivity-oriented scenario where users could combine 3D manipulation with a 2D adjustment panel. Scaled Mouse interaction was significantly faster and more accurate than the controller for 3D docking tasks and was rated significantly higher in usability and workload measures. Together, these findings establish the mouse as a viable and effective input device for seated VR contexts, offering both familiarity and accuracy advantages over controllers, particularly for professional and productivity-focused applications.},
keywords = {3D pointing, 3D selection, 3D manipulation},
}
@inproceedings{amini2025tunnelsvswires,
title = {Tunnels vs. Wires: A Comparative Analysis of Two 3D Steering Tasks in Virtual Environments},
author = {Amini*, Mohammadreza and Stuerzlinger, Wolfgang and Yamanaka, Shota and Liang, Hai-Ning and Batmaz, Anil Ufuk},
booktitle = {31st Symposium on Virtual Reality Software and Technology},
publisher = {ACM},
series = {VRST '25},
year = {2025},
month = {Nov},
articleno = {15},
numpages = {11},
doi = {https://doi.org/10.1145/3756884.3766023},
pdf = {papers/tunnelsvswires.pdf},
video = {videos/tunnelsvswires.mp4},
teaser = {teasers/tunnelsvswires.png},
abstract = {Steering involves continuous movement along constrained paths, well-studied in 2D. The extensions to 3D using the Ring-and-Wire and Ball-and-Tunnel tasks were often treated as interchangeable in previous work. In this paper, we directly compare these two tasks through a within-subjects user study (n = 18) with varying 3D path orientations. The results show that Ring-and-Wire significantly outperformed Ball-and-Tunnel, with 17.17% lower task time, 21.65% higher throughput, and 21.52% faster average speed. Participants also preferred Ring-and-Wire and reported lower workload. Visual ambiguity, especially near the tunnel's rear surface, complicated spatial perception in the Ball-and-Tunnel task. We thus recommend that future studies choose 3D steering tasks carefully for experiments, as the two tasks are not interchangeable.},
keywords = {3D steering},
award = {This work was nominated for a Best Paper Award},
}
@inproceedings{panda2025evaluatingdyndash,
title = {Evaluating the Utility of Multiple Workspaces and Easy Chart Creation for Visual Analytics},
author = {Panda, Swaroop and Stuerzlinger, Wolfgang},
booktitle = {Human-Computer Interaction},
commented-publisher = {Springer},
series = {HCI International '25},
year = {2025},
month = {May},
volume = {LNCS 15766},
pages = {103-122},
doi = {https://doi.org/10.1007/978-3-031-93835-1_7},
pdf = {papers/evaluatingdyndash.pdf},
teaser = {teasers/evaluatingdyndash.png},
abstract = {Visual Analytics involves interactive visual exploration of data sets. Interaction methods allow data analysts to explore different aspects and investigate various hypotheses. This work investigates if chart creation and multiple tabs enable analysts to pursue multiple hypotheses or analysis paths better than other approaches. To evaluate this, new features were added to an existing Visual Analytics prototype with a multi-tab design. Two user studies with professional data analysts confirmed the utility of our approach within the Visual Analytics process. Analysts can easily work within multiple workspaces, enabling them to frame and track multiple hypotheses about the data and pursue different exploratory analysis paths, ultimately yielding more comprehensive analysis outcomes.},
keywords = {visual analytics},
}
@inproceedings{le2025redirectedstepper,
title = {RedirectedStepper: Exploring Walking-In-Place Locomotion in VR Using a Mini Stepper for Ascents},
author = {Le*, Quang-Tri and Nham*, Huynh-Duc and Tran, Tanh Quang and Fjeld, Morten and Stuerzlinger, Wolfgang and Zank, Markus and Tran, Minh-Triet and Le, Khanh-Duy},
booktitle = {Conference on Human Factors in Computing Systems},
publisher = {ACM},
series = {CHI '25},
year = {2025},
month = {Apr},
articleno = {614},
numpages = {17},
doi = {https://doi.org/10.1145/3706598.3713313},
pdf = {papers/redirectedstepper.pdf},
video = {videos/redirectedstepper.mp4},
teaser = {teasers/redirectedstepper.png},
abstract = {Walking on inclined surfaces is common in some Virtual Reality (VR) scenarios, for instance when moving between floors of a building, climbing a tower, or ascending a virtual mountain. Existing approaches enabling realistic walking experiences in such settings typically require the user to use bulky walking-in-place hardware or to walk in a physical area. Addressing this challenge, we present RedirectedStepper, a locomotion technique leveraging a novel device based on a mini exercise stepper to provide realistic VR staircase walking experiences by alternating the tilt of the two stepper pedals. RedirectedStepper employs a new exponential mapping function to visually morph the user’s real foot motion to a corresponding curved path in the virtual environment (VE). Combining this stepper and the visual mapping function provides an in-place locomotion technique allowing users to virtually ascend an infinite staircase or slope while walking-in-place (WIP). We conducted three within-subject user studies (n=36) comparing RedirectedStepper with a WIP locomotion technique using the Kinect. Our studies indicate that RedirectedStepper improves the users’ sense of realism in walking on staircases in VR. Based on a set of design implications derived from the user studies, we developed SnowRun, a VR exergame application, demonstrating the use of the RedirectedStepper concept.},
keywords = {locomotion, 3d navigation},
}
@inproceedings{amini2025review3dfitts,
title = {A Systematic Review of Fitts' Law in 3D Extended Reality},
author = {Amini*, Mohammadreza and Stuerzlinger, Wolfgang and Teather, Robert J and Batmaz, Anil Ufuk},
booktitle = {Conference on Human Factors in Computing Systems},
publisher = {ACM},
series = {CHI '25},
year = {2025},
month = {Apr},
articleno = {625},
numpages = {25},
doi = {https://doi.org/10.1145/3706598.3713623},
pdf = {papers/review3dfitts.pdf},
teaser = {teasers/review3dfitts.png},
abstract = {Fitts' law is widely used as an evaluation tool for pointing or selection tasks, evolving into diverse applications, including 3D extended reality (XR) environments like virtual, augmented, and mixed reality. Despite standards like ISO 9241:411, the application of Fitts' law varies significantly across studies, complicating comparisons and undermining the reliability of findings in 3D XR research. To address this, we conducted a systematic review of 1957 papers, focusing on 122 studies that used Fitts' law in 3D XR user experiments. Our analysis shows that over half of these studies referenced Fitts' law without thoroughly investigating throughput, movement time, or error rate. We performed an in-depth meta-analysis to examine how Fitts' law is incorporated into research. By highlighting trends and inconsistencies, and making recommendations this review aims to guide researchers in designing and performing more effective and consistent Fitts-based studies in 3D XR, enhancing the quality and impact of future research.},
keywords = {3d pointing, 3d selection},
}
@inproceedings{srabonee2025hexacotext,
title = {Exploring the Impacts of HEXACO Personality Traits on Text Composition and Transcription},
author = {Srabonee*, Jannatul Ferdous and Alharbi, Ohoud and Stuerzlinger, Wolfgang and Arif, Ahmed Sabbir},
booktitle = {Conference on Human Factors in Computing Systems},
publisher = {ACM},
series = {CHI '25},
year = {2025},
month = {Apr},
articleno = {577},
numpages = {24},
doi = {https://doi.org/10.1145/3706598.3714149},
pdf = {papers/hexacotext.pdf},
teaser = {teasers/hexacotext.png},
abstract = {This study investigates the relationship between the HEXACO personality traits and text entry behaviors in composition and transcription tasks. By analyzing metrics such as entry speed, accuracy, editing efforts, and readability, we identified correlations between specific traits and text entry performance. In composition, honesty-humility and agreeableness were the strongest predictors, correlating significantly with composition time, text length, and editing efforts. In transcription, openness, honesty-humility, and agreeableness influenced performance, though no single trait consistently predicted all metrics. Interestingly, extraversion did not show strong correlations in either task, despite its established link to composition performance in academic contexts. These findings suggest that personality traits affect text entry behavior differently depending on the task, with creative tasks like composition being shaped by distinct traits compared to repetitive tasks like transcription. This research provides valuable insights into the relationship between personality and text entry, opening avenues for personalizing interaction systems based on individual traits.},
keywords = {text entry, personality, text composition, transcription},
}
@inproceedings{mutasim2025gazemtd,
title = {There Is More to Dwell Than Meets the Eye: Toward Better Gaze-Based Text Entry Systems With Multi-Threshold Dwell},
author = {Mutasim*, Aunnoy K and Bashar*, Mohammad Raihanul and Lutteroth, Christof and Batmaz, Anil Ufuk and Stuerzlinger, Wolfgang},
booktitle = {Conference on Human Factors in Computing Systems},
publisher = {ACM},
series = {CHI '25},
year = {2025},
month = {Apr},
articleno = {1088},
numpages = {18},
doi = {https://doi.org/10.1145/3706598.3713781},
pdf = {papers/gazemtd.pdf},
video = {videos/gazemtd.mp4},
teaser = {teasers/gazemtd.png},
abstract = {Dwell-based text entry seems to peak at 20 words per minute (WPM). Yet, little is known about the factors contributing to this limit, except that it requires extensive training. Thus, we conducted a longitudinal study, broke the overall dwell-based selection time into six different components, and identified several design challenges and opportunities. Subsequently, we designed two novel dwell keyboards that use multiple yet much shorter dwell thresholds: Dual-Threshold Dwell (DTD) and Multi-Threshold Dwell (MTD). The performance analysis showed that MTD (18.3 WPM) outperformed both DTD (15.3 WPM) and the conventional Constant-Threshold Dwell (12.9 WPM). Notably, absolute novices achieved these speeds within just 30 phrases. Moreover, MTD’s performance is also the fastest-ever reported average text entry speed for gaze-based keyboards. Finally, we discuss how our chosen parameters can be further optimized to pave the way toward more efficient dwell-based text entry.},
keywords = {gaze, eye tracking, text entry},
}
@inproceedings{zhao2025thfp,
title = {A Novel Bare-Handed Manipulation Technique for Distant Objects in Virtual Reality},
author = {Zhao*, Di Bill and Stuerzlinger, Wolfgang},
booktitle = {Conference on Virtual Reality and {3D} User Interfaces Abstracts and Workshops, Workshop on Novel Input Devices and Interaction Techniques at {VR}},
publisher = {IEEE},
series = {NIDIT '25},
year = {2025},
month = {Mar},
pages = {353-360},
doi = {https://doi.org/10.1109/VRW66409.2025.00083},
pdf = {papers/thfp.pdf},
teaser = {teasers/thfp.png},
video = {videos/thfp.mp4},
abstract = {Advancements in bare-hand tracking technology, featured in many modern virtual reality (VR) headsets, have enabled intuitive hand interaction for proximate 3D object manipulation. However, manipulating distant 3D objects in VR with bare hands remains a challenge, and our work explores the potential of two-handed interaction in this context. Previous work highlighted the ease of using the non-dominant wrist as an interactive surface for interaction, by pointing at it with the dominant hand's index finger. Our research expands this paradigm by extending the interactive zone to the entire non-dominant hand so that the user can interact with their index finger on the non-dominant hand’s fingers and palm to adeptly and precisely manipulate a distant 3D object's position and rotation. Through a user study, we compared our Two-Hand Fingertip-Palm technique (THFP) with a bare-hand variant of HOMER (BHOMER) on efficiency, accuracy, and usability. The results demonstrate a notable accuracy improvement (at least 75% better), especially in complex tasks, such as hanging a painting on a slanted wall, albeit at the expense of efficiency (about 47% slower) compared to BHOMER. While BHOMER is faster, it also exhibits more variation in time, and at the average BHOMER end time, our new technique is still substantially more accurate than BHOMER. Further, our method received a more favorable rating on the System Usability Scale (SUS), underscoring our approach's user-centric and intuitive design. Further, the NASA Task Load Index (NASA-TLX) indicates that THFP not only improves the task completion rate and user satisfaction but also reduces the cognitive, physical, and temporal demand for users. In addition, we discuss insights into the integration of constraints, error prevention, and the facilitation of consistent interaction. Our findings lay a solid foundation for using our new method in the quickly advancing VR field.},
keywords = {hand interaction, bare-hand, 3D manipulation, 3D positioning, 3D rotation, 3D pose},
}
@inproceedings{xu2025predictingray,
title = {Predicting Ray Pointer Landing Poses in VR Using Multimodal LSTM-Based Neural Networks},
author = {Xu*, Wenxuan and Wei*, Yushi and Hu*, Xuning and Stuerzlinger, Wolfgang and Wang, Yuntao and Liang, Hai-Ning},
booktitle = {Conference on Virtual Reality and {3D} User Interfaces},
publisher = {IEEE},
series = {VR '25},
year = {2025},
month = {Mar},
pages = {93-103},
doi = {https://doi.org/10.1109/VR59515.2025.00034},
pdf = {papers/predictingray.pdf},
teaser = {teasers/predictingray.png},
abstract = {Target selection is one of the most fundamental tasks in VR interaction systems. Prediction heuristics can provide users with a smoother interaction experience in this process. Our work aims to predict the ray landing pose for hand-based raycasting selection in Virtual Reality (VR) using a Long Short-Term Memory (LSTM)-based neural network with time-series data input of speed and distance over time from three different pose channels: hand, Head-Mounted Display (HMD), and eye. We first conducted a study to collect motion data from these three input channels and analyzed these movement behaviors. Additionally, we evaluated which combination of input modalities yields the optimal result. A second study validates raycasting across a continuous range of distances, angles, and target sizes. On average, our technique's predictions were within 4.6° of the true landing pose when 50% of the way through the movement. We compared our LSTM neural network model to a kinematic information model and further validated its generalizability in two ways: by training the model on one user's data and testing on other users (cross-user) and by training on a group of users and testing on entirely new users (unseen users). Compared to the baseline and a previous kinematic method, our model increased prediction accuracy by a factor of 3.5 and 1.9, respectively, when 40% of the way through the movement.},
keywords = {3D pointing, 3D selection, ray pointing},
}
@inproceedings{gemici2024speedcontrol,
title = {Object Speed Control Based on Signed Distance Field for Mid-Air Object Manipulation in Virtual Reality},
author = {Gemici*, Mucahit and Stuerzlinger, Wolfgang and Batmaz, Anil Ufuk},
booktitle = {International Symposium on Mixed and Augmented Reality},
publisher = {IEEE},
series = {ISMAR '24},
year = {2024},
month = {Oct},
pages = {465-474},
doi = {https://doi.org/10.1109/ISMAR62088.2024.00061},
pdf = {papers/speedcontrol.pdf},
video = {videos/speedcontrol.mp4},
teaser = {teasers/speedcontrol.png},
abstract = {In Virtual Reality (VR) applications, interacting with distant objects relies heavily on mid-air object manipulation. However, the inherent distance between the user and the object often restricts precise movement capabilities. This paper introduces the Signed Distance Field (SDF) algorithm as a method for mid-air object manipulation, and combines it with the ray casting interaction technique to investigate its effect on user performance and user experience. To increase the accuracy of the movements, we leverage the speed-accuracy trade-off to dynamically adjust object manipulation speed based on the SDF algorithm's output. Our study, involving 18 participants, examines the effects of SDF across three different tasks with different complexities. Our results showed that ray casting with SDF reduces the number of errors in complex tasks without slowing down the participants. Further, our proposed method significantly improved the user experience for complex tasks. We hope that our proposed assistive system, designed for tasks and applications, can be used as an interaction technique to enable more accurate manipulation of distant objects in the fields like surgical planning, architecture, and games.},
keywords = {3D manipulation, 3D posing, wire task},
}
@inproceedings{jiang2024flexdoc,
title = {FlexDoc: Flexible Document Adaptation through Optimizing both Content and Layout},
author = {Jiang*, Yue and Lutteroth, Christof and Jain, Rajiv and Tensmeyer, Christopher and Manjunatha, Varun and Stuerzlinger, Wolfgang and Morariu, Vlad},
booktitle = {Symposium on Visual Languages and Human-Centric Computing},
publisher = {IEEE},
series = {VL/HCC '24},
year = {2024},
month = {Sep},
pages={217-222},
doi = {https://doi.org/10.1109/VL/HCC60511.2024.00032},
pdf = {papers/flexdoc.pdf},
video = {videos/flexdoc.mp4},
teaser = {teasers/flexdoc.png},
abstract = {Designing adaptive documents that are visually appealing across various devices and for diverse viewers is a challenging task. This is due to the wide variety of devices and different viewer requirements and preferences. Alterations to a document’s content, style, or layout often necessitate numerous adjustments, potentially leading to a complete layout redesign. We introduce FLEXDOC, a framework for creating and consuming documents that seamlessly adapt to different devices, author, and viewer preferences and interactions. It eliminates the need for manually creating multiple document layouts, as FLEXDOC enables authors to define desired document properties using templates and employs both discrete and continuous optimization in a novel comprehensive optimization process, which leverages automatic text summarization and image carving techniques to adapt both layout and content during consumption dynamically. Further, we demonstrate FLEXDOC in real-world scenarios.},
keywords = {document layout, flexible documents, adaptive documents, responsive documents},
}
@inproceedings{kasahara2024steeringthroughput,
title = {Better Definition and Calculation of Throughput and Effective Parameters for Steering to Account for Subjective Speed-accuracy Tradeoffs},
author = {Kasahara*, Nobuhito and Oba*, Yosuke and Yamanaka, Shota and Batmaz, Anil Ufuk and Stuerzlinger, Wolfgang and Miyashita, Homei},
booktitle = {Conference on Human Factors in Computing Systems},
publisher = {ACM},
series = {CHI '24},
year = {2024},
month = {May},
articleno = {722},
pages = {1-18},
doi = {https://doi.org/10.1145/3613904.3642084},
pdf = {papers/steeringthroughput.pdf},
video = {videos/steeringthroughput.mp4},
teaser = {teasers/steeringthroughput.png},
abstract = {In Fitts' law studies to investigate pointing, throughput is used to characterize the performance of input devices and users, which is claimed to be independent of task difficulty or the user's subjective speed-accuracy bias.
While throughput has been recognized as a useful metric for target-pointing tasks, the corresponding formulation for path-steering tasks and its evaluation have not been thoroughly examined in the past. In this paper, we conducted three experiments using linear, circular, and sine-wave path shapes to propose and investigate a novel formulation for the effective parameters and the throughput of steering tasks. Our results show that the effective width substantially improves the fit to data with mixed speed-accuracy biases for all task shapes. Effective width also smoothed out the throughput across all biases, while the usefulness of the effective amplitude depended on the task shape. Our study thus advances the understanding of user performance in trajectory-based tasks.},
keywords = {steering, throughput},
}
@inproceedings{dash2024me911,
title = {Multimedia-Enabled 911: Exploring 911 Callers’ Experience of Call Taker Controlled Video Calling in Simulated Emergencies},
author = {Dash*, Punyashlok and Axtell, Benett and Geiskkovitch, Denise Y. and Neustaedter, Carman and Stuerzlinger, Wolfgang},
booktitle = {Conference on Human Factors in Computing Systems},
publisher = {ACM},
series = {CHI '24},
year = {2024},
month = {May},
articleno = {500},
pages = {1-15},
doi = {https://doi.org/10.1145/3613904.3643055},
pdf = {papers/me911.pdf},
video = {videos/me911.mp4},
teaser = {teasers/me911.png},
abstract = {Emergency response to large-scale disasters is often supported with multimedia from social media. However, while these features are common in everyday video calls, the complex needs of 911 and other systems make it difficult to directly incorporate these features. We assess an ME911 (Multimedia-Enabled 911) app to understand how the design will need to deviate from common norms and how callers will respond to those non-standard choices. We expand the role of 911 call taker control over emergency situations to the calling interface while incorporating key features like map-based location finding. Participants’ experiences in mock emergencies show the non-standard design helps callers in the unfamiliar setting of emergency calling yet it also causes confusion and delays. We find the need for emergency-specific deviations from design norms is supported by participant feedback. We discuss how broader system changes will support callers to use these non-standard designs during emergencies.},
keywords = {emergency, 911, video calling, teleconference, V4Space},
}
@inproceedings{yamanaka2024latencysteering,
title = {The Effect of Latency on Movement Time in Path-steering},
author = {Yamanaka, Shota and Stuerzlinger, Wolfgang},
booktitle = {Conference on Human Factors in Computing Systems},
publisher = {ACM},
series = {CHI '24},
year = {2024},
month = {May},
articleno = {622},
pages = {1-19},
doi = {https://doi.org/10.1145/3613904.3642316},
pdf = {papers/latencysteering.pdf},
video = {videos/latencysteering_application.mp4},
teaser = {teasers/latencysteering.png},
abstract = {In current graphical user interfaces, there exists a (typically unavoidable) end-to-end latency from each pointing-device movement to its corresponding cursor response on the screen, which is known to affect user performance in target selection, e.g., in terms of movement time (MTs). Previous work also reported that a long latency increases MTs in path-steering tasks, but the quantitative relationship between latency and MT had not been previously investigated for path-steering. In this work, we derive models to predict MTs for path-steering and evaluate them with five tasks: goal crossing as a preliminary task for model derivation, linear-path steering, circular-path steering, narrowing-path steering, and steering with target pointing. The results show that the proposed models yielded an adjusted R^2 > 0.94, with lower AICs and smaller cross-validation RMSEs than the baseline models, enabling more accurate prediction of MTs.},
keywords = {steering, latency},
}
@inproceedings{turkmen2024eyeconguide,
title = {EyeGuide & EyeConGuide: Gaze-based Visual Guides to Improve 3D Sketching Systems},
author = {Turkmen+, Rumeysa and Gelmez+, Zeynep Ecem and Batmaz, Anil Ufuk and Stuerzlinger, Wolfgang and Asente, Paul and Sarac, Mine and Pfeuffer, Ken and Barrera Machuca, Mayra Donaji},
booktitle = {Conference on Human Factors in Computing Systems},
publisher = {ACM},
series = {CHI '24},
year = {2024},
month = {May},
articleno = {178},
pages = {1-14},
doi = {https://doi.org/10.1145/3613904.3641947},
pdf = {papers/eyeconguide.pdf},
video = {videos/eyeconguide.mp4},
teaser = {teasers/eyeconguide.png},
abstract = {Visual guides in Virtual Reality sketching systems help to align strokes and raise accuracy. Guides that appear dynamically where one wants to draw have the potential to both lower the reliance on manual guide activation and improve the sketching experience. We propose novel guide techniques for sketching that exploit eye-tracking to modulate where a grid fragment appears. EyeGuide and EyeConGuide cause this grid fragment to appear spatially close to the user's intended sketches, with one relying on the user's eyes and the other on both the eyes and the hand location. In two user studies, we evaluated the techniques in basic and complex sketching tasks. The results show that gaze-based guides increased sketching accuracy compared to no guides, improved the system usability over manual activation, and were preferred by most users. Our research contributes highly usable techniques to assist accurate sketching and insights into multimodal gaze-contingent sketching.},
keywords = {eye tracking, gaze tracking, 3D sketching, 3D drawing},
}
@inproceedings{rind2024longitudinalehct,
title = {Eye-Hand Coordination Training: A Systematic Comparison of 2D, VR, and AR Screen Technologies and Task Motives},
author = {Rind*, Aliza and Zaugg+, Irene and Celik+, Elif and Stuerzlinger, Wolfgang and Ortega, Francisco and Batmaz, Anil Ufuk and Sarac, Mine},
booktitle = {Conference on Virtual Reality and {3D} User Interfaces},
publisher = {IEEE},
series = {VR '24},
year = {2024},
month = {Mar},
pages = {200-210},
doi = {https://doi.org/10.1109/VR58804.2024.00043},
pdf = {papers/longitudinalehct.pdf},
teaser = {teasers/longitudinalehct.png},
video = {videos/longitudinalehct.mp4},
abstract = {This study compares Augmented Reality (AR), Virtual Reality (VR), and 2D touchscreen approaches for eye-hand coordination training. We thoroughly analyze the motor performance of twenty participants throughout the course of a ten-session longitudinal study. Our study includes five different assessment criteria: speed, error rate, accuracy, precision, and none. We also analyze the participants' performance in terms of effective throughput as a novel evaluation criterion. The results showed that each task execution strategy has a different effect on one or more psychomotor characteristics of the trainee, which highlights the importance of the training program. We also showed that effective throughput is a candidate for monitoring the overall motor performance progress in eye-hand coordination training systems.},
keywords = {3D pointing, vergence-accomodation conflict, virtual hand},
}
@inproceedings{wagner2024taxivis,
title = {Reimagining TaxiVis through an Immersive Space-Time Cube Metaphor and Reflecting on Potential Benefits of Immersive Analytics for Urban Data Exploration},
author = {Wagner Filho*, Jorge and Silva, Claudio and Stuerzlinger, Wolfgang and Nedel, Luciana},
booktitle = {Conference on Virtual Reality and {3D} User Interfaces},
publisher = {IEEE},
series = {VR '24},
year = {2024},
month = {Mar},
pages = {827-838},
doi = {https://doi.org/10.1109/VR58804.2024.00102},
pdf = {papers/immersivetaxivis.pdf},
teaser = {teasers/immersivetaxivis.png},
video = {videos/immersivetaxivis.mp4},
url = {https://arxiv.org/abs/2402.00344},
abstract = {Recent studies suggest that immersion into 3D environments could increase the usability of 3D visualizations by facilitating 3D perception and easier interaction, and also better support collaboration between local or remote analysts. This is particularly relevant for domains with an obvious three-dimensional mapping, such as urban space-time data. To explore how a traditional visualization system could be adapted into an immersive framework, and how it could benefit from this, we decided to revisit a landmark paper presented ten years ago at IEEE VIS. TaxiVis, by Ferreira et al., enabled interactive spatial-temporal querying of a large dataset of taxi trips in New York City. Here, we reimagine how TaxiVis’ functionalities could be implemented and extended in a 3D immersive environment. Among the unique features we identify as being enabled by the Immersive TaxiVis prototype are alternative uses of the additional visual dimension, a fully-visual 3D spatio-temporal query framework, and the opportunity to explore the data at different scales and frames of reference. The intent behind our work is to complement and enhance established forms of visualization, not to replace them. Through reporting on our findings, and on the vision and reasoning behind our design decisions, we hope to contribute to the debate on how conventional and immersive visualization paradigms can help each other and also how the exploration of urban datasets can be facilitated in the coming years.},
keywords = {visual analytics, immersive analytics, space-time cube, 3D visualization, 3D interaction},
}
@inproceedings{batmaz2023gripstyle,
title = {Effect of Grip Style on Pointing in Head Mounted Displays},
author = {Batmaz, Anil Ufuk and Turkmen+, Rumeysa and Sarac, Mine and Barrera Machuca, Mayra Donaji and Stuerzlinger, Wolfgang},
booktitle = {International Symposium on Mixed and Augmented Reality},
publisher = {IEEE},
series = {ISMAR '23},
year = {2023},
month = {Oct},
pages = {425-433},
doi = {https://doi.org/10.1109/ISMAR59233.2023.00057},
pdf = {papers/gripstyle.pdf},
teaser = {teasers/gripstyle.png},
abstract = {When working in Virtual Reality (VR), the user's performance is affected by how the user holds the input device (e.g., controller), typically using either a precision or a power grip. Previous work examined these grip styles for 3D pointing at targets at different depths in peripersonal space. They found that participants had a lower error rate with the precision grip but no difference in movement speed, throughput, or interaction with target depth, but their experiment was potentially affected by tracking differences between devices. This paper reports an experiment that partially replicates and extends this study by evaluating the effect of grip style on the 3D selection of nearby targets with the same device. Furthermore, our experiment investigates the effect of the vergence-accommodation conflict (VAC) present in current stereo displays on 3D pointing in peripersonal space. Our results show that grip style significantly affects user performance. We hope that our results can guide developers, researchers, and designers when creating virtual environments.},
keywords = {3D pointing, vergence-accomodation conflict},
}
@inproceedings{batmaz2023reinvestigatingvac,
title = {Re-investigating the Effect of the Vergence-Accommodation Conflict on 3D Pointing},
author = {Batmaz, Anil Ufuk and Turkmen+, Rumeysa and Sarac, Mine and Barrera Machuca, Mayra Donaji and Stuerzlinger, Wolfgang},
booktitle = {29th Symposium on Virtual Reality Software and Technology},
publisher = {ACM},
series = {VRST '23},
year = {2023},
month = {Oct},
articleno = {8},
numpages = {10},
doi = {https://doi.org/10.1145/3611659.3615686},
pdf = {papers/reinvestigatingvac.pdf},
teaser = {teasers/reinvestigatingvac.png},
abstract = {The vergence-accommodation conflict (VAC) limits user performance in current Virtual Reality (VR) systems. In this paper, we investigate the effects of the VAC in a single focal VR system using three experimental conditions: with no VAC, with a constant VAC, and with a varying VAC. Previous work had yielded conflicting results, so we decided to re-investigate this issue. Eighteen participants performed an ISO 9241:411 task in a study that closely replicates previous work, except that the angle of the task space was rotated 20 degrees downward, to make the task less fatiguing to perform, which addresses a potential confound in previous work. We found that the varying VAC condition had worse performance than the other conditions, which indicates that the contrasting results in previous work were very likely due to biomechanical factors. We hope that our work contributes to the understanding of the influence of the VAC in VR systems and potential strategies for improving user experience and performance in immersive virtual environments.},
keywords = {3D pointing, vergence-accomodation conflict},
}
@inproceedings{han2023drseye,
title = {Dr.’s Eye: The Design and Evaluation of a Video Conferencing System to Support Doctor Appointments in Home Settings},
author = {Han*, Dongqi and Geiskkovitch, Denise Y. and Yuan, Ye and Mills*, Chelsea and Zhong*, Ce and Chen*, Amy Yo Sue and Stuerzlinger, Wolfgang and Neustaedter, Carman},
booktitle = {Conference on Human Factors in Computing Systems},
publisher = {ACM},
series = {CHI '23},
year = {2023},
month = {Apr},
articleno = {343},
numpages = {18},
doi = {https://doi.org/10.1145/3544548.3581350},
pdf = {papers/drseye.pdf},
video = {videos/drseye.mp4},
teaser = {teasers/drseye.png},
abstract = {The spread of COVID-19 has encouraged the practice of using video conferencing for family doctor appointments. Existing applications and devices face challenges in capturing the correct view of patients' bodies and supporting ease of use. We created Dr.’s Eye, a video conferencing prototype to support varying types of body exams in home settings. An exploratory study was conducted with patients in mock appointments to explore the use of our video system. Results show the benefits of providing more flexibility with a decoupled camera and display, and privacy protection by limiting the camera view. Yet, challenges remain in maneuvering two devices, presenting feedback of the camera view, coordinating camera work between the doctor and patient, and coping with discomfort in showing private body regions. This inspires future research on how to design a video system for doctor appointments.},
keywords = {teleconference, doctor},
}
@inproceedings{lee2023multiscaletransitions,
title = {Designing Viewpoint Transition Techniques in Multiscale Virtual Environments},
author = {Lee*, Jong-In and Asente, Paul and Stuerzlinger, Wolfgang},
booktitle = {Conference on Virtual Reality and {3D} User Interfaces},
publisher = {IEEE},
series = {VR '23},
year = {2023},
month = {Mar},
pages = {680-690},
doi = {https://doi.org/10.1109/VR55154.2023.00083},
pdf = {papers/multiscaletransitions.pdf},
video = {videos/multiscaletransitions.mp4},
teaser = {teasers/multiscaletransitions.png},
abstract = {Viewpoint transitions have been shown to improve users' spatial orientation and help them build a cognitive map when they are navigating an unfamiliar virtual environment. Previous work has investigated transitions in single-scale virtual environments, focusing on trajectories and continuity. We extend this work with an in-depth investigation of transition techniques in multiscale virtual environments (MVEs). We identify challenges in navigating MVEs with nested structures and assess how different transition techniques affect spatial understanding and usability. Through two user studies, we investigated transition trajectories, interactive control of transition movement, and speed modulation in a nested MVE. We show that some types of viewpoint transitions enhance users' spatial awareness and confidence in their spatial orientation and reduce the need to revisit a target point of interest multiple times.},
keywords = {3D navigation, multiscale virtual environment, transitions, speed control},
}
@inproceedings{batmaz2023virtualhandvac,
title = {Measuring the Effect of Stereo Deficiencies on Peripersonal Space Pointing},
author = {Batmaz, Anil Ufuk and Hudhud Mughrabi+, Moaaz and Sarac, Mine and Barrera Machuca, Mayra Donaji and Stuerzlinger, Wolfgang},
booktitle = {Conference on Virtual Reality and {3D} User Interfaces},
publisher = {IEEE},
series = {VR '23},
year = {2023},
month = {Mar},
pages = {1-11},
doi = {https://doi.org/10.1109/VR55154.2023.00063},
pdf = {papers/virtualhandvac.pdf},
teaser = {teasers/virtualhandvac.png},
abstract = {State-of-the-art Virtual Reality (VR) and Augmented Reality (AR) headsets rely on singlefocal stereo displays. For objects away from the focal plane, such displays create a vergence-accommodation conflict (VAC), potentially degrading user interaction performance. In this paper, we study how the VAC affects pointing at targets within arm's reach with virtual hand and raycasting interaction in current stereo display systems. We use a previously proposed experimental methodology that extends the ISO 9241-411:2015 multi-directional selection task to enable fair comparisons between selecting targets in different display conditions. We conducted a user study with eighteen participants and the results indicate that participants were faster and had higher throughput in the constant VAC condition with the virtual hand. We hope that our results enable designers to choose more efficient interaction methods in virtual environments.},
keywords = {3D pointing, vergence-accomodation conflict, virtual hand},
}
@inproceedings{shi2022groupalignment,
title = {Group-based Object Alignment in Virtual Reality Environments},
author = {Shi*, Rongkai and Zhang*, Jialin and Stuerzlinger, Wolfgang and Liang, Hai-Ning},
booktitle = {Symposium on Spatial User Interaction},
publisher = {ACM},
series = {SUI '22},
year = {2022},
month = {Dec},
articleno = {2},
numpages = {11},
doi = {https://doi.org/10.1145/3565970.3567682},
pdf = {papers/groupalign3D.pdf},
teaser = {teasers/groupalign3D.png},
abstract = {Group-based object alignment is an essential manipulation task, particularly for complex scenes. In conventional 2D user interfaces, such alignment tasks are generally achieved via a command/menu-based interface. Virtual reality (VR) head-mounted displays (HMDs) provide a rich immersive interaction experience, which opens more design options for group-based object alignment interaction techniques. However, object alignment techniques in immersive environments are underexplored. In this paper, we present four interaction techniques for 3 degrees-of-freedom translational alignments: AlignPanel, AlignWidget, AlignPin, and AlignGesture. We evaluated their performance, workload, and usability in a user study with 20 participants. Our results indicate different benefits and drawbacks of these techniques for group-based alignment in immersive systems. Based on the findings, we distill a set of design choices and recommendations for these techniques in various application scenarios.},
keywords = {3D positioning, 3D manipulation, alignment, 3D user interfaces},
}
@inproceedings{batmaz2022improvingperformance,
title = {Improving Effective Throughput Performance using Auditory Feedback in Virtual Reality Training Systems},
author = {Batmaz, Anil Ufuk and Yu*, Kangyou and Liang, Hai-Ning and Stuerzlinger, Wolfgang},
booktitle = {Symposium on Spatial User Interaction},
publisher = {ACM},
series = {SUI '22},
year = {2022},
month = {Dec},
articleno = {18},
numpages = {11},
doi = {https://doi.org/10.1145/3565970.3567702},
pdf = {papers/audiothroughput.pdf},
teaser = {teasers/audiothroughput.png},
abstract = {During the complex process of motor skill acquisition, novices might focus on different criteria, such as speed or accuracy, in their training. Previous research on virtual reality (VR) training systems has shown that effective throughput could also be used as such an assessment criterion. Effective throughput combines speed, accuracy, and precision into one measure, and can be influenced by auditory feedback. This paper investigates through a user study how to improve participants' effective throughput performance using auditory feedback. In the study, we mapped the speed and accuracy of the participants to the pitch of the auditory error feedback in an ISO 9241-411 multidirectional pointing task and evaluated participants' performance. The results showed it is possible to regulate the time or accuracy performance of the participants and thus the effective throughput. Based on the findings of our work, we also identify that effective throughput is an appropriate assessment criterion for VR training systems. We hope that our results can be used for VR training applications.},
keywords = {3D pointing, auditory feedback, training},
}
@inproceedings{batmaz2022stereodistal,
title = {Effect of Stereo Deficiencies on Virtual Distal Pointing},
author = {Batmaz, Anil Ufuk and Hudhud Mughrabi+, Moaaz and Barrera Machuca, Mayra Donaji and Stuerzlinger, Wolfgang},
booktitle = {28th Symposium on Virtual Reality Software and Technology},
publisher = {ACM},
series = {VRST '22},
year = {2022},
month = {Nov},
articleno = {12},
numpages = {8},
doi = {https://doi.org/10.1145/3562939.3565621},
pdf = {papers/vac_distal.pdf},
teaser = {teasers/vac_distal.png},
abstract = {Previous work has shown that the mismatch between disparity and optical focus cues, i.e., the vergence and accommodation conflict (VAC), affects virtual hand selection in immersive systems. To investigate if the VAC also affects distal pointing with ray casting, we ran a user study with an ISO 9241:411 multidirectional selection task where participants selected 3D targets with three different VAC conditions, no VAC, i.e., targets placed roughly at 75 cm, which matches the focal plane of the VR headset, constant VAC, i.e., at 400 cm from the user, and varying VAC, where the depth distance of targets changed between 75 cm and 400 cm. According to our results, the varying VAC condition requires the most time and decreases the throughput performance of the participants. It also takes longer for users to select targets in the constant VAC condition than without the VAC. Our results show that in distal pointing placing objects at different depth planes has detrimental effect on the user performance.},
keywords = {3D pointing, vergence-accomodation conflict, ray casting},
}
@inproceedings{mutasim2022performance,
title = {Performance Analysis of Saccades for Primary and Confirmatory Target Selection},
author = {Mutasim*, Aunnoy K and Batmaz, Anil Ufuk and Hudhud Mughrabi+, Moaaz and Stuerzlinger, Wolfgang},
booktitle = {28th Symposium on Virtual Reality Software and Technology},
publisher = {ACM},
series = {VRST '22},
year = {2022},
month = {Nov},
articleno = {18},
numpages = {12},
doi = {https://doi.org/10.1145/3562939.3565619},
pdf = {papers/saccadeconfirm.pdf},
video = {videos/saccadeconfirm.mp4},
teaser = {teasers/saccadeconfirm.png},
abstract = {In eye-gaze-based selection, dwell suffers from several issues, e.g., the Midas Touch problem. Here we investigate saccade-based selection techniques as an alternative to dwell. First, we designed a novel user interface (UI) for Actigaze and used it with (goal-crossing) saccades for confirming the selection of small targets (i.e., < 1.5-2°). We compared it with three other variants of Actigaze (with button press, dwell, and target reverse crossing) and two variants of target magnification (with button press and dwell). Magnification-dwell exhibited the most promising performance. Among Actigaze, goal-crossing was the fastest and achieved the highest throughput but suffered the most errors. We then evaluated goal-crossing as a primary selection technique for targets ≥ 2° and implemented a novel UI for such interaction. Results revealed that dwell achieved the best performance. Yet, we identified goal-crossing as a good compromise between dwell and button press. Our findings thus identify novel options for gaze-only interaction.},
keywords = {eye tracking, pointing, saccades},
}
@inproceedings{chidambaram2022editar,
title = {EditAR: A Digital Twin Authoring and Editing Environment for Creation of AR/VR and Video Instructions from a Single Demonstration},
author = {Chidambaram*, Subramanian and Reddy*, Sai Swarup and Rumple*, Matthew David and Ipsita*, Ananya and Villanueva*, Ana M and Redick, Thomas S and Stuerzlinger, Wolfgang and Ramani, Karthik},
booktitle = {International Symposium on Mixed and Augmented Reality},
publisher = {IEEE},
series = {ISMAR '22},
year = {2022},
month = {Oct},
pages = {326-335},
doi = {https://doi.org/10.1109/ISMAR55827.2022.00048},
pdf = {papers/editar.pdf},
video = {videos/editar.mp4},
teaser = {teasers/editar.png},
abstract = {Augmented/Virtual reality and video-based media play a vital role in the digital learning revolution to train novices in spatial tasks. However, creating content for these different media requires expertise in several fields. We present EditAR, a unified authoring and editing workflow to create content for AR, VR, and video with a single demonstration. EditAR captures the user’s interaction within an environment and creates a digital twin enabling users with no prior programming background to develop content. We conducted formative interviews with both subject and media experts to design the system. The prototype then developed was reviewed by experts. We also performed a comparative study on 2D video creation from 3D recordings, via a 3D editor, which uses freehand interaction for in-headset editing vs. traditional video creation. Users took 5x less time to record instructions and preferred EditAR in a qualitative survey, along with giving significantly higher usability scores.},
keywords = {augmented reality, 3d user interfaces, authoring, digital twin},
}
@inproceedings{alharbi2022autocucumber,
title = {Auto-Cucumber: The Impact of Autocorrection Failures on Users' Frustration},
author = {Alharbi*, Ohoud and Stuerzlinger, Wolfgang},
booktitle = {Graphics Interface},
series = {GI '22},
year = {2022},
month = {May},
articleno = {16},
pages = {148-160},
doi = {https://doi.org/10.20380/GI2022.16},
pdf = {papers/autocucumber.pdf},
commented-url = {https://openreview.net/forum?id=dcbsb4qTmnt},
teaser = {teasers/autocucumber.png},
abstract = {Many mobile users rely on autocorrection mechanisms during text entry on their smartphone. Previous studies investigated the effects of autocorrection mechanisms on typing speed and accuracy but did not explore the level of frustration and perceived mental workload often associated with autocorrection. In this paper, we investigate the effect of autocorrection failures on the user’s frustration, mental and physical demand, performance, and effort using a mixed-methods user study. We identified that perceived mental and physical demand, and frustration are directly affected by autocorrection.},
keywords = {text entry, autocorrect, errors, frustration},
}
@inproceedings{batmaz2022vacpointing,
title = {The Effect of the Vergence-Accommodation Conflict on Virtual Hand Pointing in Immersive Displays},
author = {Batmaz, Anil Ufuk and Barrera Machuca, Mayra D. and Sun, Junwei and Stuerzlinger, Wolfgang},
booktitle = {Conference on Human Factors in Computing Systems},
publisher = {ACM},
series = {CHI '22},
year = {2022},
month = {May},
articleno = {633},
numpages = {15},
doi = {https://doi.org/10.1145/3491102.3502067},
pdf = {papers/vacpointing.pdf},
video = {videos/vacpointing.mp4},
teaser = {teasers/vacpointing.png},
abstract = {Previous work hypothesized that for Virtual Reality (VR) and Augmented Reality (AR) displays a mismatch between disparities and optical focus cues, known as the vergence and accommodation conflict (VAC), affects depth perception and thus limits user performance in 3D selection tasks within arm’s reach (peri-personal space). To investigate this question, we built a multifocal stereo display, which can eliminate the influence of the VAC for pointing within the investigated distances. In a user study, participants performed a virtual hand 3D selection task with targets arranged laterally or along the line of sight, with and without a change in visual depth, in display conditions with and without the VAC. Our results show that the VAC influences 3D selection performance in common VR and AR stereo displays and that multifocal displays have a positive effect on 3D selection performance with a virtual hand.},
keywords = {3D pointing, vergence-accomodation conflict, immersive display system, multifocal display},
}
@inproceedings{hudhud2022jitter,
title = {My Eyes Hurt: Effects of Jitter in 3D Gaze Tracking},
author = {Hudhud Mughrabi+, Moaaz and Mutasim*, Aunnoy K and Stuerzlinger, Wolfgang and Batmaz, Anil Ufuk},
booktitle = {Conference on Virtual Reality and {3D} User Interfaces Abstracts and Workshops, Workshop on Novel Input Devices and Interaction Techniques at {VR}},
publisher = {IEEE},
series = {NIDIT '22},
year = {2022},
month = {Mar},
pages = {310-315},
doi = {https://doi.org/10.1109/VRW55335.2022.00070},
pdf = {papers/gazejitter.pdf},
abstract = {Jitter, small fluctuations in the signal, is one of the major sources for a decrease of motor performance and a negative user experience in virtual reality (VR) systems. Current technologies still cannot eliminate jitter in VR systems, especially in the eye-gaze tracking systems embedded in many head-mounted displays. In this work, we used an HTC Vive Pro Eye, artificially added 0.5°, 1°, and 1.5° jitter to the eye-tracking data, and analyzed user performance in a ISO 9241:411 pointing task with targets at 1 or 2 meters visual distance using angular Fitts’ law. The results showed that the user’s error rate significantly increases with increased jitter levels. No significant difference was observed for time and throughput. Additionally, we observed a significant decrease in terms of time, error rate, and throughput for the more distant targets. We hope that our results guide researcher, practitioners, and developers towards better gaze-tracking-based VR applications.},
keywords = {3D pointing, jitter, virtual reality},
}
@inproceedings{batmaz2021anchoring,
title = {When Anchoring Fails: Interactive Alignment of Large Virtual Objects in Occasionally Failing AR Systems},
author = {Batmaz, Anil Ufuk and Stuerzlinger, Wolfgang},
booktitle = {Future Technologies Conference},
publisher = {Springer},
series = {FTC '21},
year = {2021},
month = {Oct},
volume = {LNNS 358},
numpages = {13},
doi = {https://doi.org/10.1007/978-3-030-89906-6_4},
pdf = {papers/aranchoring.pdf},
teaser = {teasers/aranchoring.png},
abstract = {Augmented reality systems show virtual object models overlaid over real ones, which is helpful in many contexts, e.g., during maintenance. Assuming all geometry is known, misalignments in 3D poses will still occur without perfectly robust viewer and object 3D tracking. Such misalignments can impact the user experience and reduce the potential benefits associated with AR systems. In this paper, we implemented several interactive algorithms to make manual virtual object alignment easier, based on previously presented methods, such as HoverCam, SHOCam, and a Signed Distance Field. Our approach also simplifies the user interface for manual 3D pose alignment. The results of our work indicate that our approach can reduce the time needed for interactive 3D pose alignment, which improves the user experience.},
keywords = {augmented reality, 3D navigation, 3D orbiting, 3D tracking, anchoring},
}
@inproceedings{chakraborty2021vizinteract,
title = {VizInteract: Rapid Data Exploration through Multi-Touch Interaction with Multi-Dimensional Visualizations},
author = {Chakraborty*, Supratim and Stuerzlinger, Wolfgang},
booktitle = {Human-Computer Interaction},
publisher = {Springer},
series = {INTERACT '21},
year = {2021},
month = {Aug},
volume = {LNCS 12934},
pages = {610–632},
doi = {https://doi.org/10.1007/978-3-030-85613-7_39},
pdf = {papers/vizinteract.pdf},
url = {https://heysupratim.com/projects/vizinteract},
video = {videos/vizinteract.mp4},
teaser = {teasers/vizinteract.png},
abstract = {Creating and editing multi-dimensional data visualizations with current tools typically involves complex interactions. We present VizInteract, an interactive data visualization tool for touch-enabled displays. VizInteract supports efficient multi-touch data exploration through rapid construction of and interaction with multi-dimensional data visualizations. Building on primitive visualization idioms like histograms, VizInteract addresses the need for easy data exploration by facilitating the construction of multi-dimensional visualizations, such as scatter plots, parallel coordinate plots, radar charts, and scatter plot matrices, through simple multi-touch actions. Touch-based brushing-and-linking as well as attribute-based filter bubbles support “diving into the data” during analysis. We present the results of two explorative studies, one on a tablet and another on a large touchscreen and analyze the usage patterns that emerge while participants conducted visual analytics data exploration tasks in both conditions.},
keywords = {visual analytics, visualization, touch},
}
@inproceedings{chidambaram2021processar,
title = {ProcessAR: An augmented reality-based tool to create in-situ procedural 2D/3D AR Instructions},
author = {Chidambaram*, Subramanian and Huang*, Hank and He*, Fengming and Qian*, Xun and Villanueva*, Ana M and Redick, Thomas S and Stuerzlinger, Wolfgang and Ramani, Karthik},
booktitle = {Designing Interactive Systems},
publisher = {ACM},
series = {DIS '21},
year = {2021},
month = {Jun},
pages = {234-249},
doi = {https://doi.org/10.1145/3461778.3462126},
pdf = {papers/processar.pdf},
video = {videos/processar.mp4},
teaser = {teasers/processar.png},
abstract = {Augmented reality (AR) is an efficient form of delivering spatial information and has great potential for training workers. However, AR is still not widely used due to the technical skills, expertise, required to develop appropriate and interactive AR content. We developed ProcessAR, an AR-based system to develop 2D/3D content by capturing subject matter expert (SME) environment-object interactions, in situ. To enable smooth workflows, ProcessAR locates and identifies different tools/objects in the workspace where the author looks at them, by utilizing a computer vision algorithm. We explored additional features such as embedding 2D videos to detected objects and user-adaptive triggers. The design space for ProcessAR was identified from formative interviews with AR programming experts and SMEs, alongside a comparative design study with SMEs and novice users. A final user evaluation comparing ProcessAR and a baseline AR authoring environment studied, users rated ProcessAR as the better form on qualitative perceptional surveys.},
keywords = {augmented reality, mixed reality, AR authoring},
}
@inproceedings{mutasim2021pinchclickdwell,
title = {Pinch, Click, or Dwell: Comparing Different Selection Techniques for Eye-Gaze-Based Pointing in Virtual Reality},
author = {Mutasim*, Aunnoy K. and Batmaz, Anil Ufuk and Stuerzlinger, Wolfgang},
booktitle = {Symposium on Eye Tracking Research and Applications},
publisher = {ACM},
series = {ETRA '21},
year = {2021},
month = {May},
articleno = {15},
numpages = {7},
doi = {https://doi.org/10.1145/3448018.3457998},
pdf = {papers/pinchclickdwell.pdf},
teaser = {teasers/pinchclickdwell.png},
abstract = {While a pinch action is gaining popularity for selection/activation of virtual objects in eye-gaze-based systems, it is still unknown how well it performs compared to other popular alternatives, e.g., a button click or a dwell action. To determine pinch's performance in terms of execution time, error rate, and throughput, we implemented a Fitts' law task in Virtual Reality (VR) where the subjects pointed with their eye-gaze and selected/activated the targets by either pinch, clicking a button, or dwell. Results revealed that although pinch was slower, resulted in more errors, and had less throughput compared to button clicks, none of these differences between the two conditions were significant. Dwell exhibited the least errors but was significantly slower and achieved less throughput compared to the other conditions. Based on these findings, we conclude that the pinch gesture is a reasonable alternative to button clicks for eye-gaze-based VR systems.},
keywords = {eye tracking, selection, pointing},
}
@inproceedings{jiang2021reverseorc,
title = {{ReverseORC}: Reverse Engineering of Resizable User Interface Layouts with {OR}-Constraints},
author = {Jiang*, Yue and Stuerzlinger, Wolfgang and Lutteroth, Christof},
booktitle = {Conference on Human Factors in Computing Systems},
publisher = {ACM},
series = {CHI '21},
year = {2021},
month = {May},
articleno = {316},
numpages = {18},
doi = {https://doi.org/10.1145/3411764.3445043},
pdf = {papers/reverseorc.pdf},
url = {https://github.com/YueJiang-nj/ReverseORC-CHI2021},
video = {https://youtu.be/uBVRtUvLFSk},
teaser = {teasers/reverseorc.png},
abstract = {Reverse engineering (RE) of user interfaces (UIs) plays an important role in software evolution. However, the large diversity of UI technologies and the need for UIs to be resizable make this challenging.
We propose ReverseORC, a novel RE approach able to discover diverse layout types and their dynamic resizing behaviours independently of their implementation, and to specify them by using OR constraints. Unlike previous RE approaches, ReverseORC infers flexible layout constraint specifications by sampling UIs at different sizes and analyzing the differences between them. It can create specifications that replicate even some non-standard layout managers with complex dynamic layout behaviours. We demonstrate that ReverseORC works across different platforms with very different layout approaches, e.g., for GUIs as well as for the Web. Furthermore, it can be used to detect and fix problems in legacy UIs, extend UIs with enhanced layout behaviours, and support the creation of flexible UI layouts.},
keywords = {GUI, layout, constraints},
}
@inproceedings{batmaz2021pitch,
title = {The Effect of Pitch in Auditory Error Feedback for Fitts' Tasks in Virtual Reality Training Systems},
author = {Batmaz, Anil Ufuk and Stuerzlinger, Wolfgang},
booktitle = {Conference on Virtual Reality and {3D} User Interfaces},
publisher = {IEEE},
series = {VR '21},
year = {2021},
month = {Mar},
pages = {85-94},
doi = {https://doi.org/10.1109/VR50410.2021.00029},
pdf = {papers/pitchfeedback.pdf},
teaser = {teasers/pitchfeedback.png},
abstract = {Fitts' law and the associated throughput measure characterize user pointing performance in virtual reality (VR) training systems and simulators well. Yet, pointing performance can be affected by the feedback users receive from a VR application. This work examines the effect of the pitch of auditory error feedback on user performance in a Fitts' task through a distributed experiment. In our first study, we used middle- and high-frequency sound feedback and demonstrated that high-pitch error feedback significantly decreases user performance in terms of time and throughput. In the second study, we used adaptive sound feedback, where we increased the frequency with the error rate, while asking subjects to execute the task "as fast/as precise/as fast and precise as possible". Results showed that adaptive sound feedback decreases the error rate for "as fast as possible" task execution without affecting the time. The results can be used to enhance and design various VR systems.},
keywords = {3D pointing, feedback, augmented reality, touch},
}
@inproceedings{batmaz2021auditory,
title = {Effects of Different Auditory Feedback Frequencies in Virtual Reality {3D} Pointing Tasks},
author = {Batmaz, Anil Ufuk and Stuerzlinger, Wolfgang},
booktitle = {Conference on Virtual Reality and {3D} User Interfaces, Abstracts and Workshops, Workshop on Novel Input Devices and Interaction Techniques at {VR}},
publisher = {IEEE},
series = {NIDIT '21},
year = {2021},
month = {Mar},
pages = {189-194},
doi = {https://doi.org/10.1109/VRW52623.2021.00042},
pdf = {papers/auditoryfeedback.pdf},
abstract = {Auditory error feedback is commonly used in 3D Virtual Reality (VR) pointing experiments to increase participants' awareness of their misses. However, few papers describe the parameters of the auditory feedback, such as the frequency. In this study, we asked 15 participants to perform an ISO 9241-411 pointing task in a distributed remote experiment. In our study, we used three forms of auditory feedback, i.e., C4 (262 Hz), C8 (4186 Hz) and none. According to the results, we observed a speed-accuracy trade-off for the C8 tones compared to C4 ones: subjects were slower, and their throughput performance decreased with the C8 while their error rate decreased. Still, for larger targets there was no speed-accuracy trade-off, and subjects were only slower with C8 tones. Overall, the frequency of the feedback had a significant impact on the user's performance. We thus suggest that practitioners, developers, and designers report the frequency they used in their VR applications.},
keywords = {3D pointing, feedback, virtual reality},
}
@inproceedings{batmaz2020nojitter,
title = {No Jitter Please: Effects of Rotational and Positional Jitter on {3D} Mid-Air Interaction},
author = {Batmaz, Anil Ufuk and Rajabi Seraji*, Mohammad and Kneifel*, Johanna and Stuerzlinger, Wolfgang},
booktitle = {Future Technologies Conference},
publisher = {Springer},
series = {FTC '20},
year = {2020},
month = {Nov},
volume = {AISC 1289},
commented-volume = {2},
numpages = {16},
doi = {https://doi.org/10.1007/978-3-030-63089-8_52},
pdf = {papers/nojitter.pdf},
teaser = {teasers/nojitter.png},
abstract = {Virtual Reality (VR) 3D tracking systems are susceptible to minor fluctuations in signal (jitter). In this study, we explored how different levels of jitter affect user performance for 3D pointing. We designed a Fitts' Law experiment investigating target positional jitter and cursor rotational jitter at 3 different depth distances. Performance was negatively affected when up to ± 0.5° rotational jitter was applied to the controller and up to ± 0.375 cm positional jitter was applied to the target. At 2.25 m distance, user performance did not improve with decreasing positional jitter or rotational jitter compared to the no jitter condition. Our results can inform the design of 3D user interfaces, controllers, and interaction techniques in VR. Specifically, we suggest a focus on counteracting controller rotational jitter as this would globally increase performance for ray-based selection tasks.},
keywords = {3D pointing, mid-air, jitter},
}
@inproceedings{lee2020automatic,
title = {Evaluating Automatic Parameter Control Methods for Locomotion in Multiscale Virtual Environments},
author = {Lee*, Jong-In and Asente, Paul and Kim, Byungmoon and Kim, Yeojin and Stuerzlinger, Wolfgang},
booktitle = {26th Symposium on Virtual Reality Software and Technology},
publisher = {ACM},
series = {VRST '20},
year = {2020},
month = {Nov},
articleno = {11},
numpages = {10},
doi = {https://doi.org/10.1145/3385956.3418961},
pdf = {papers/navmultiscaleve.pdf},
video = {videos/navmultiscaleve.mp4},
teaser = {teasers/navmultiscaleve.png},
abstract = {Virtual environments with a wide range of scales are becoming commonplace in Virtual Reality applications. Methods to control locomotion parameters can help users explore such environments more easily. For multi-scale virtual environments, point-and-teleport locomotion with a well-designed distance control method can enable mid-air teleportation, which makes it competitive to flying interfaces. Yet, automatic distance control for point-and-teleport has not been studied in such environments. We present a new method to automatically control the distance for point-and-teleport. In our first user study, we used a solar system environment to compare three methods: automatic distance control for point-and-teleport, manual distance control for point-and-teleport, and automatic speed control for flying. Results showed that automatic control significantly reduces overshoot compared with manual control for point-and-teleport, but the discontinuous nature of teleportation made users prefer flying with automatic speed control. We conducted a second study to compare automatic-speed-controlled flying and two versions of our teleportation method with automatic distance control, one incorporating optical flow cues. We found that point-and-teleport with optical flow cues and automatic distance control was more accurate than flying with automatic speed control, and both were equally preferred to point-and-teleport without the cues.},
keywords = {3D navigation, multiscale virtual environment, teleportation, automatic distance, speed control},
}
@inproceedings{batmaz2020eyehand,
title = {Eye-Hand Coordination Training for Sports with Mid-air {VR}},
author = {Batmaz, Anil Ufuk and Sun*, Xintian and Taskiran, Dogu and Stuerzlinger, Wolfgang},
booktitle = {26th Symposium on Virtual Reality Software and Technology},
publisher = {ACM},
series = {VRST '20},
year = {2020},
month = {Nov},
articleno = {19},
numpages = {10},
doi = {https://doi.org/10.1145/3385956.3418971},
pdf = {papers/eyehandsports.pdf},
video = {videos/eyehandsports.mp4},
teaser = {teasers/eyehandsports.png},
abstract = {A relatively recent application area for Virtual Reality (VR) systems is sports training and user performance assessment. One of these applications is eye-hand coordination training systems (EHCTSs). Previous research identified that VR-based training systems have great potential for EHCTSs. While previous work investigated 3D targets on a 2D plane, here we aim to study full 3D movements and extend the application of throughput analysis to EHCTSs. We conducted two user studies to investigate how user performance is affected by different target arrangements, feedback conditions, and handedness in VR-based EHCTSs. In the first study, we explored handedness as well as vertical and horizontal target arrangements, and showed that user performance increases with the dominant hand and a vertical target plane. In the second study, we investigated different combinations of visual and haptic feedback and how they affect user performance with different target and cursor sizes. Results illustrate that haptic feedback did not increase user performance when it is added to visual feedback. Our results inform the creation of better EHCTSs with mid-air VR systems.},
keywords = {3D pointing, eye-hand coordination, sports training},
}
@inproceedings{jiang2020orcsolver,
title = {{ORCSolver}: An Efficient Solver for Adaptive {GUI} Layout with {OR}-Constraints},
author = {Jiang*, Yue and Stuerzlinger, Wolfgang and Zwicker, Matthias and Lutteroth, Christof},
booktitle = {Conference on Human Factors in Computing Systems},
publisher = {ACM},
series = {CHI '20},
year = {2020},
month = {Apr},
articleno = {483},
numpages = {14},
doi = {https://doi.org/10.1145/3313831.3376610},
url = {https://yuejiang-nj.github.io/papers/CHI2020_ORCSolver/project_page.html},
pdf = {papers/orcsolver.pdf},
video = {https://youtu.be/0S77vVG8btE},
teaser = {teasers/orcsolver.png},
abstract = {OR-constrained (ORC) graphical user interface layouts unify conventional constraint-based layouts with flow layouts, which enables the definition of flexible layouts that adapt to screens with different sizes, orientations, or aspect ratios with only a single layout specification. Unfortunately, solving ORC layouts with current solvers is time-consuming and the needed time increases exponentially with the number of widgets and constraints. To address this challenge, we propose ORCSolver, a novel solving technique for adaptive ORC layouts, based on a branch-and-bound approach with heuristic preprocessing. We demonstrate that ORCSolver simplifies ORC specifications at runtime and our approach can solve ORC layout specifications efficiently at near-interactive rates.},
keywords = {GUI, layout, constraints},
}
@inproceedings{putze2020eegautocorrect,
title = {Platform for Studying Self-Repairing Auto-Corrections in Mobile Text Entry Based on Brain Activity, Gaze, and Context},
author = {Putze, Felix and Ihrig*, Tilman and Schultz, Tanja and Stuerzlinger, Wolfgang},
booktitle = {Conference on Human Factors in Computing Systems},
publisher = {ACM},
series = {CHI '20},
year = {2020},
month = {Apr},
numpages = {13},
doi = {https://doi.org/10.1145/3313831.3376815},
pdf = {papers/eegautocorrect.pdf},
teaser = {teasers/eegautocorrect.png},
abstract = {Auto-correction is a standard feature of mobile text entry. While the performance of state-of-the-art auto-correct methods is usually relatively high, any errors that occur are cumbersome to repair, interrupt the flow of text entry, and challenge the user's agency over the process. In this paper, we describe a system that aims to automatically identify and repair auto-correction errors. This system comprises a multi-modal classifier for detecting auto-correction errors from brain activity, eye gaze, and context information, as well as a strategy to repair such errors by replacing the erroneous correction or suggesting alternatives. We integrated both parts in a generic Android component and thus present a research platform for studying self-repairing end-to-end systems. To demonstrate its feasibility, we performed a user study to evaluate the classification performance and usability of our approach.},
keywords = {autocorrect, EEG, errors, text entry},
}
@inproceedings{batmaz2020grip,
title = {Precision vs. Power Grip: A Comparison of Pen Grip Styles for Selection in Virtual Reality},
author = {Batmaz, Anil Ufuk and Mutasim*, Aunnoy K. and Stuerzlinger, Wolfgang},
booktitle = {Conference on Virtual Reality and {3D} User Interfaces, Abstracts and Workshops, Workshop on Novel Input Devices and Interaction Techniques at {VR}},
publisher = {IEEE},
series = {NIDIT '20},
year = {2020},
month = {Mar},
pages = {23-28},
doi = {https://doi.org/10.1109/VRW50115.2020.00012},
pdf = {papers/precisiongrip.pdf},
abstract = {While commercial Virtual Reality (VR) controllers are mostly designed to be held in a power grip, previous research showed that using pen-like devices with a precision grip can improve user performance for selection in VR, potentially even matching that achievable with a mouse. However, it is not known if the improvement is due to the grip style. In this work, 12 subjects performed a Fitts' task at 3 different depth conditions with a pen-like input device used in both a precision and power grip. Our results identify that the precision grip significantly improves user performance in VR through a significant reduction in error rate, but we did not observe a significant effect of the distance of targets from the user. We believe that our results are useful for designers and researchers to improve the usability of and user performance in VR systems.},
keywords = {3D pointing, grip},
}
@inproceedings{batmaz2020touch,
title = {Touch the Wall: Comparison of Virtual and Augmented Reality with Conventional {2D} Screen Eye-hand Coordination Training Systems},
author = {Batmaz, Anil Ufuk and Mutasim*, Aunnoy K. and Malekmakan*, Morteza and Sadr*, Elham and Stuerzlinger, Wolfgang},
booktitle = {Conference on Virtual Reality and {3D} User Interfaces},
publisher = {IEEE},
series = {VR '20},
year = {2020},
month = {Mar},
pages = {184-193},
doi = {https://doi.org/10.1109/VR46266.2020.1581205539914},
pdf = {papers/touchthewall.pdf},
teaser = {teasers/touchthewall.png},
abstract = {Previous research on eye-hand coordination training systems has investigated user performance on a wall, 2D touchscreens, and in Virtual Reality (VR). In this paper, we designed an eye-hand coordination reaction test to investigate and compare user performance in three different virtual environments (VEs) – VR, Augmented Reality (AR), and a 2D touchscreen. VR and AR conditions also included two feedback conditions – mid-air and passive haptics. Results showed that compared to AR, participants were significantly faster and made fewer errors both in 2D and VR. However, compared to VR and AR, throughput performance of the participants was significantly higher in the 2D touchscreen condition. No significant differences were found between the two feedback conditions. The results show the importance of assessing precision and accuracy in eye-hand coordination training and suggest that it is currently not advisable to use AR headsets in such systems.},
keywords = {3D pointing, eye-hand coordination, mid-air, passive haptics, augmented reality, touch},
}
@inproceedings{pham2019mightypen,
title = {Is the Pen Mightier than the Controller? A Comparison of Input Devices for Selection in Virtual and Augmented Reality},
author = {Pham*, Duc-Minh and Stuerzlinger, Wolfgang},
booktitle = {25th Symposium on Virtual Reality Software and Technology},
publisher = {ACM},
series = {VRST '19},
year = {2019},
month = {Nov},
articleno = {35},
numpages = {11},
doi = {https://doi.org/10.1145/3359996.3364264},
pdf = {papers/mightypen.pdf},
teaser = {teasers/mightypen.png},
abstract = {Controllers are currently the typical input device for commercial Virtual Reality (VR) systems. Yet, such controllers are not as efficient as other devices, including the mouse. This motivates us to investigate devices that substantially exceed the controller's performance, for both VR and Augmented Reality (AR) systems. We performed a user study to compare several input devices, including a mouse, controller, and a 3D pen-like device on a VR and AR pointing task. Our results show that the 3D pen significantly outperforms modern VR controllers in all evaluated measures and that it is comparable to the mouse. Participants also liked the 3D pen more than the controller. Finally, we show how 3D pen devices could be integrated into today's VR and AR systems.},
keywords = {3D pointing, input device},
}
@inproceedings{batmaz2019hittingwall,
title = {Hitting the Wall: Mid-Air Interaction for Eye-Hand Coordination},
author = {Batmaz, Anil Ufuk and Sun*, Xintian and Taskiran, Dogu and Stuerzlinger, Wolfgang},
booktitle = {25th Symposium on Virtual Reality Software and Technology},
publisher = {ACM},
series = {VRST '19},
year = {2019},
month = {Nov},
articleno = {30},
numpages = {5},
doi = {https://doi.org/10.1145/3359996.3364249},
pdf = {papers/hittingthewall.pdf},
video = {videos/hittingthewall.mp4},
teaser = {teasers/hittingthewall.png},
abstract = {Reaction time training systems are used to improve user performance. Until now, such setups use physical 2D flat surfaces, e.g., a 2D touch screen or buttons mounted on a wall. We designed and investigated a mid-air reaction time training system with an immersive virtual reality (VR) headset. 12 participants performed an eye-hand coordination reaction test in three conditions: both in mid-air with or without VR controller as well as with passive haptic feedback through hitting a soft-surface wall. We also altered target and cursor sizes and used a Fitts' law task to analyze user performance. According to the results, subjects were slower and their throughput was lower when they hit a solid surface to interact with virtual targets. Our results show that Fitts's model can be applied to these systems to measure and assess participant training.},
keywords = {3D pointing, mid-air, passive haptics, eye-hand coordination, augmented reality},
}
@inproceedings{machuca2019smart3dguides,
title = {{Smart3DGuides}: Making Unconstrained Immersive {3D} Drawing More Accurate},
author = {Barrera Machuca*, Mayra D. and Stuerzlinger, Wolfgang and Asente, Paul},
booktitle = {25th Symposium on Virtual Reality Software and Technology},
publisher = {ACM},
series = {VRST '19},
year = {2019},
month = {Nov},
articleno = {37},
numpages = {13},
doi = {https://doi.org/10.1145/3359996.3364254},
pdf = {papers/smart3dguides.pdf},
video = {videos/smart3dguides.mp4},
teaser = {teasers/smart3dguides.png},
abstract = {Most current commercial Virtual Reality (VR) drawing applications for creativity rely on freehand 3D drawing as their main interaction paradigm. However, the presence of the additional third dimension makes accurate freehand drawing challenging. Some systems address this problem by constraining or beautifying user strokes, which can be intrusive and can limit the expressivity of freehand drawing. In this paper, we evaluate the effectiveness of relying solely on visual guidance to increase overall drawing shape-likeness. We identified a set of common mistakes that users make while creating freehand strokes in VR and then designed a set of visual guides, the Smart3DGuides, which help users avoid these mistakes. We evaluated Smart3DGuides in two user studies, and our results show that non-constraining visual guides help users draw more accurately.},
keywords = {3D drawing, 3D sketching, 3D user interfaces, 3D modeling},
}
@inproceedings{pham2019hawkey,
title = {{HawKEY}: Efficient and Versatile Text Entry for Virtual Reality},
author = {Pham*, Duc-Minh and Stuerzlinger, Wolfgang},
booktitle = {25th Symposium on Virtual Reality Software and Technology},
publisher = {ACM},
series = {VRST '19},
year = {2019},
month = {Nov},
articleno = {21},
numpages = {11},
doi = {https://doi.org/10.1145/3359996.3364265},
pdf = {papers/hawkey.pdf},
teaser = {teasers/hawkey.png},
abstract = {Text entry is still a challenging task in modern Virtual Reality (VR) systems. The lack of efficient text entry methods limits the applications that can be used productively in VR. Previous work has addressed this issue through virtual keyboards or showing the physical keyboard in VR. While physical keyboards afford faster text entry, they usually require a seated user and an instrumented environment. We introduce a new keyboard, worn on a hawker's tray in front of the user, which affords a compact, simple, flexible, and efficient text entry solution for VR, without restricting physical movement. In our new video condition, we also show the keyboard only when the user is looking down at it. To evaluate our novel solution and to identify good keyboard visualizations, we ran a user study where we asked participants to enter both lowercase sentences as well as complex text while standing. The results show that text entry rates are affected negatively by simplistic keyboard visualization conditions and that our solution affords desktop text entry rates, even when standing.},
keywords = {3D user interfaces, text entry, augmented reality},
}
@inproceedings{sun2019sliding,
title = {Extended Sliding in Virtual Reality},
author = {Sun*, Junwei and Stuerzlinger, Wolfgang},
booktitle = {25th Symposium on Virtual Reality Software and Technology},
publisher = {ACM},
series = {VRST '19},
year = {2019},
month = {Nov},
articleno = {38},
numpages = {5},
doi = {https://doi.org/10.1145/3359996.3364251},
pdf = {papers/extendedsliding.pdf},
video = {videos/extendedsliding.mp4},
teaser = {teasers/extendedsliding.png},
abstract = {Although precise 3D positioning is not always necessary in virtual environments, it is still an important task for current and future applications of Virtual Reality (VR), including 3D modelling, engineering, and scientific applications. We focus on 3D positioning techniques in immersive environments that use a 6DOF controller as input device and present a new technique that improves 3D positioning performance in VR, in both speed and accuracy. Towards this goal, we adapted an extended sliding technique to VR systems with a controller as input device and compared it with previously presented 3DOF positioning techniques. The results showed that our new Extended VR Sliding technique significantly improved the accuracy for 3D positioning tasks, especially for targets in contact with the scene.},
keywords = {3D manipulation, 3D positioning, sliding},
}
@inproceedings{hayatpur2019planeraypoint,
title = {Plane, Ray, and Point: Enabling Precise Spatial Manipulations with Shape Constraints},
author = {Hayatpur+, Devamardeep and Heo, Seongkook and Xia, Haijun and Stuerzlinger, Wolfgang and Wigdor, Daniel},
booktitle = {32nd Annual Symposium on User Interface Software and Technology},
publisher = {ACM},
series = {UIST '19},
year = {2019},
month = {Oct},
pages = {1185–1195},
doi = {https://doi.org/10.1145/3332165.3347916},
pdf = {papers/planeraypoint.pdf},
video = {videos/planeraypoint.mp4},
teaser = {teasers/planeraypoint.png},
abstract = {We present Plane, Ray, and Point, a set of interaction techniques that utilizes shape constraints to enable quick and precise object alignment and manipulation in virtual reality. Users create the three types of shape constraints, Plane, Ray, and Point, by using symbolic gestures. The shape constraints are used like scaffoldings and limit and guide the movement of virtual objects that collide or intersect with them. The same set of gestures can be performed with the other hand, which allow users to further control the degrees of freedom for precise and constrained manipulation. The combination of shape constraints and bimanual gestures yield a rich set of interaction techniques to support object transformation. An exploratory study conducted with 3D design experts and novice users found the techniques to be useful in 3D scene design workflows and easy to learn and use.},
keywords = {3D manipulation},
}
@inproceedings{machuca2019spatial,
title = {The Effect of Spatial Ability on Immersive {3D} Drawing},
author = {Barrera Machuca*, Mayra D. and Stuerzlinger, Wolfgang and Asente, Paul},
booktitle = {Conference on Creativity and Cognition},
publisher = {ACM},
series = {C&C '19},
year = {2019},
month = {Jun},
pages = {173–186},
doi = {https://doi.org/10.1145/3325480.3325489},
pdf = {papers/drawingspatialability.pdf},
teaser = {teasers/drawingspatialability.png},
abstract = {Virtual Reality (VR) headsets have made immersive 3D drawing available to the general public. However, compared to 2D drawing, the presence of an additional dimension makes sketching in VR challenging, since creating precise strokes that are positioned as intended in all three dimensions imposes higher demands on the users' perception, motor and spatial skills. Another challenge users face is creating accurate shapes in which strokes are positioned correctly relative to previous ones, as they may need to use different views to plan their next hand movement. In this paper, we analyze the behaviours of users with different spatial abilities while drawing in VR. Our results indicate that there are different types of behaviours that affect different aspects of the sketches. We also found that the user's spatial ability affects the shape of the drawing, but not the line precision. Finally, we give recommendations for designing 3D drawing interfaces.},
keywords = {virtual reality, 3D sketching, 3D drawing, 3D modeling, spatial cognition},
}
@inproceedings{papoi20193dspeedcontrol,
title = {Improved Automatic Speed Control for {3D} Navigation},
author = {Papoi*, Domi and Stuerzlinger, Wolfgang},
booktitle = {Advances in Computer Graphics},
publisher = {Springer},
series = {CGI '19},
year = {2019},
month = {Jun},
volume = {LNCS 11542},
pages = {278-290},
doi = {https://doi.org/10.1007/978-3-030-22514-8_23},
pdf = {papers/navspeed.pdf},
video = {videos/navspeed.mp4},
teaser = {teasers/navspeed.png},
abstract = {As technology progresses, it is possible to increase the size and complexity of 3D virtual environments. Thus, we need deal with multiscale virtual environments today. Ideally, the user should be able to navigate such environments efficiently and robustly, which requires control of the user speed during navigation. Manual speed control across multiple scales of magnitude suffers from issues such as overshooting behaviors and introduces additional complexity. Most previously presented methods to automatically control the speed of navigation do not generalize well to environments with varying scales. We present an improved method to automatically control the speed of the user in 3D virtual environment navigation. The main benefit of our approach is that it automatically adapts the navigation speed in a manner that enables efficient navigation with maximum freedom, while still avoiding collisions. The results of a usability test show a significant reduction in completion time for a multi-scale navigation task.},
keywords = {3D navigation, speed control},
note = {Computer Graphics International},
}
@inproceedings{blum2019immersiveanalytics,
title = {Immersive Analytics Sensemaking on Different Platforms},
author = {Blum*, Sebastian and Cetin*, Gokhan and Stuerzlinger, Wolfgang},
booktitle = {Winter School of Computer Graphics},
series = {WSCG '19, CSRN 2902},
issn = {2464-4617},
year = {2019},
month = {Jan},
pages = {69-80},
url = {http://wscg.zcu.cz/DL/wscg_DL.htm},
doi = {https://doi.org/10.24132/CSRN.2019.2902.2.9},
pdf = {papers/VAonLHRD+VR.pdf},
teaser = {teasers/VAonLHRD+VR.png},
abstract = {In this work we investigated sensemaking activities on different immersive platforms. We observed user behaviours during a classification task on a very large wall-display system (experiment I) and in a modern Virtual Reality headset (experiment II). In experiment II, we also evaluated a condition with a VR headset with an extended field of view, through a sparse peripheral display. We evaluated the results across the two studies by analyzing quantitative and qualitative data, such as task completion time, number of classifications, followed strategies, and shape of clusters. The results showed differences in user behaviours between the different immersive platforms, i.e., the very large display wall and the VR headset. Even though quantitative data showed no significant differences, qualitatively, users used additional strategies on the wall-display, which hints at a deeper level of sensemaking compared to a VR Headset. The qualitative and quantitative results of the comparison between VR Headsets do not indicate that users perform differently with a VR Headset with an extended field of view.},
keywords = {immersive analytics, virtual reality, large display system, immersive display system, large display interaction, V4Space},
}
@inproceedings{alharbi2019wisetype,
title = {{WiseType}: A Tablet Keyboard with Color-Coded Visualization and Various Editing Options for Error Correction},
author = {Alharbi*, Ohoud and Arif, Ahmed Sabbir and Stuerzlinger, Wolfgang and Dunlop, Mark D. and Komninos, Andreas},
booktitle = {Graphics Interface},
series = {GI '19},
year = {2019},
month = {May},
articleno = {4},
numpages = {10},
doi = {https://doi.org/10.20380/GI2019.04},
pdf = {papers/wisetype.pdf},
video = {videos/wisetype.mp4},
teaser = {teasers/wisetype.png},
abstract = {To address the problem of improving text entry accuracy in mobile devices, we present a new tablet keyboard that offers both immediate and delayed feedback on language quality through auto-correction, prediction, and grammar checking. We combine different visual representations for grammar and spelling errors, accepted predictions, and auto-corrections. and also support interactive swiping/tapping features and improved interaction with previous errors, predictions, and auto-corrections. Additionally, we added smart error correction features to the system to decrease the overhead of correcting errors and to decrease the number of operations. We designed our new input method with an iterative user-centered approach through multiple pilots. We conducted a lab-based study with a refined experimental methodology and found that WiseType outperforms a standard keyboard in terms of text entry speed and error rate. The study shows that color-coded text background highlighting and underlining of potential mistakes in combination with fast correction methods can improve both writing speed and accuracy.},
keywords = {text entry, autocorrect, errors},
award = {This work received a Michael J Sweeney Best HCI Student Paper Award},
}
@inproceedings{sun2019selecting,
title = {Selecting and Sliding Hidden Objects in {3D} Desktop Environments},
author = {Sun*, Junwei and Stuerzlinger, Wolfgang},
booktitle = {Graphics Interface},
series = {GI '19},
year = {2019},
month = {May},
articleno = {8},
numpages = {8},
doi = {https://doi.org/10.20380/GI2019.08},
pdf = {papers/transparency.pdf},
video = {videos/transparency.mp4},
teaser = {teasers/transparency.png},
abstract = {Selecting and positioning objects in 3D space are fundamental tasks in 3D user interfaces. We present two new techniques to improve 3D selection and positioning. We first augment 3D user interfaces with a new technique that enables users to select objects that are hidden from the current viewpoint. This layer-based technique for selecting hidden objects works for arbitrary objects and scenes. We then also extend a mouse-based sliding technique to work even if the manipulated object is hidden behind other objects, by making the manipulated object always fully visible through a transparency mask during drag-and-drop positioning. Our user study shows that with the new techniques, users can easily select hidden objects and that sliding with transparency performs faster than the common 3D widgets technique.},
keywords = {3D manipulation, 3D positioning, sliding, transparency},
}
@inproceedings{machuca2019stereo,
title = {The Effect of Stereo Display Deficiencies on Virtual Hand Pointing},
author = {Barrera Machuca*, Mayra D. and Stuerzlinger, Wolfgang},
booktitle = {Conference on Human Factors in Computing Systems},
publisher = {ACM},
series = {CHI '19},
year = {2019},
month = {May},
articleno = {207},
numpages = {14},
doi = {https://doi.org/10.1145/3290605.3300437},
pdf = {papers/virtualhandfitts.pdf},
video = {videos/virtualhandfitts.mp4},
teaser = {teasers/virtualhandfitts.png},
abstract = {The limitations of stereo display systems affect depth perception, e.g., due to the vergence-accommodation conflict or diplopia. We performed three studies to understand how stereo display deficiencies impact 3D pointing for targets in front of a screen and close to the user, i.e., in peripersonal space. Our first two experiments compare movements with and without a change in visual depth for virtual respectively physical targets. Results indicate that selecting targets along the depth axis is slower and has less throughput for virtual targets, while physical pointing demonstrates the opposite result. We then propose a new 3D extension for Fitts' law that models the effect of stereo display deficiencies. Next, our third experiment verifies the model and measures more broadly how the change in visual depth between targets affects pointing performance in peripersonal space and confirms significant effects on time and throughput. Finally, we discuss implications for 3D user interface design.},
keywords = {3D pointing, mid-air, stereo},
}
@inproceedings{yamanaka2019lassomodel,
title = {Modeling Fully and Partially Constrained Lasso Movements in a Grid of Icons},
author = {Yamanaka, Shota and Stuerzlinger, Wolfgang},
booktitle = {Conference on Human Factors in Computing Systems},
publisher = {ACM},
series = {CHI '19},
year = {2019},
month = {May},
articleno = {120},
numpages = {12},
doi = {https://doi.org/10.1145/3290605.3300350},
pdf = {papers/gridlassomodel.pdf},
teaser = {teasers/gridlassomodel.png},
abstract = {Lassoing objects is a basic function in illustration software and presentation tools. Yet, for many common object arrangements lassoing is sometimes time-consuming to perform and requires precise pen operation. In this work, we studied lassoing movements in a grid of objects similar to icons. We propose a quantitative model to predict the time to lasso such objects depending on the margins between icons, their sizes, and layout, which all affect the number of stopping and crossing movements. Results of two experiments showed that our models predict fully and partially constrained movements with high accuracy. We also analyzed the speed profiles and pen stroke trajectories and identified deeper insights into user behaviors, such as that an unconstrained area can induce higher movement speeds even in preceding path segments.},
keywords = {lasso, steering, group selection},
}
@inproceedings{jiang2019orclayout,
title = {{ORC} Layout: Adaptive {GUI} Layout with {OR}-Constraints},
author = {Jiang*, Yue and Du*, Ruofei and Lutteroth, Christof and Stuerzlinger, Wolfgang},
booktitle = {Conference on Human Factors in Computing Systems},
publisher = {ACM},
series = {CHI '19},
year = {2019},
month = {May},
articleno = {413},
numpages = {12},
doi = {https://doi.org/10.1145/3290605.3300643},
pdf = {papers/orclayout.pdf},
video = {videos/orclayout.mp4},
teaser = {teasers/orclayout.png},
abstract = {We propose a novel approach for constraint-based graphical user interface (GUI) layout based on OR-constraints (ORC) in standard soft/hard linear constraint systems. ORC layout unifies grid layout and flow layout, supporting both their features as well as cases where grid and flow layouts individually fail. We describe ORC design patterns that enable designers to safely create flexible layouts that work across different screen sizes and orientations. We also present the ORC Editor, a GUI editor that enables designers to apply ORC in a safe and effective manner, mixing grid, flow and new ORC layout features as appropriate. We demonstrate that our prototype can adapt layouts to screens with different aspect ratios with only a single layout specification, easing the burden of GUI maintenance. Finally, we show that ORC specifications can be modified interactively and solved efficiently at runtime.},
keywords = {GUI, layout, constraints},
}
@inproceedings{kruijff2019flexurface,
title = {Multilayer Haptic Feedback for Pen-Based Tablet Interaction},
author = {Kruijff, Ernst and Biswas*, Saugata and Trepkowski*, Christina and Maiero*, Jens and Ghinea, George and Stuerzlinger, Wolfgang},
booktitle = {Conference on Human Factors in Computing Systems},
publisher = {ACM},
series = {CHI '19},
year = {2019},
month = {May},
articleno = {143},
numpages = {14},
doi = {https://doi.org/10.1145/3290605.3300373},
pdf = {papers/flexurface.pdf},
video = {videos/flexurface.mp4},
teaser = {teasers/flexurface.png},
abstract = {We present a novel, multilayer interaction approach that enables state transitions between spatially above-screen and 2D on-screen feedback layers. This approach supports the exploration of haptic features that are hard to simulate using rigid 2D screens. We accomplish this by adding a haptic layer above the screen that can be actuated and interacted with (pressed on) while the user interacts with on-screen content using pen input. The haptic layer provides variable firmness and contour feedback, while its membrane functionality affords additional tactile cues like texture feedback. Through two user studies, we look at how users can use the layer in haptic exploration tasks, showing that users can discriminate well between different firmness levels, and can perceive object contour characteristics. Demonstrated also through an art application, the results show the potential of multilayer feedback to extend on-screen feedback with additional widget, tool and surface properties, and for user guidance.},
keywords = {haptics, multilayer, pen},
}
@inproceedings{batmaz2019nidit,
title = {Effects of {3D} Rotational Jitter and Selection Methods on {3D} Pointing Tasks},
author = {Batmaz, Anil Ufuk and Stuerzlinger, Wolfgang},
booktitle = {Workshop on Novel Input Devices and Interaction Techniques at {VR}},
publisher = {IEEE},
series = {NIDIT '19},
year = {2019},
month = {Mar},
pages = {1687-1692},
doi = {https://doi.org/10.1109/VR.2019.8798038},
pdf = {papers/rotjitterselection.pdf},
abstract = {3D pointing is an integral part of Virtual Reality interaction. Typical pointing devices rely on 3D trackers and are thus subject to fluctuations in the reported pose, i.e., jitter. In this work, we explored how different levels of rotational jitter affect pointing performance and if different selection methods can mitigate the effects of jitter. Towards this, we designed a Fitts' Law experiment with three selection methods. In the first method, subjects used a single controller to position and select the object. In the second method, subjects used the controller in their dominant hand to point at objects and the trigger button of a second controller, held in their non-dominant hand, to select objects. Finally, subjects used the controller in their dominant hand to point the objects and pressed the space bar on a keyboard to select the object in the third condition. During the pointing task we added five different levels of jitter: no jitter, ±0.5°, ±1°, and ±2° uniform noise, as well as White Gaussian noise with 1° standard deviation. Results showed that the Gaussian noise and ±2° of jitters significantly reduced the throughput of the participants. Moreover, subjects made fewer errors when they performed the experiment with two controllers. Our results inform the design of 3D user interfaces, input devices and interaction techniques.},
keywords = {3D pointing, jitter},
}
@inproceedings{batmaz2019stereo,
title = {Do Head-Mounted Display Stereo Deficiencies Affect {3D} Pointing Tasks in {AR} and {VR}?},
author = {Batmaz, Anil Ufuk and Barrera Machuca*, Mayra D. and Pham*, Duc-Minh and Stuerzlinger, Wolfgang},
booktitle = {Conference on Virtual Reality and {3D} User Interfaces},
publisher = {IEEE},
series = {VR '19},
year = {2019},
month = {Mar},
pages = {585-592},
doi = {https://doi.org/10.1109/VR.2019.8797975},
pdf = {papers/virtualhandARVR.pdf},
video = {videos/virtualhandARVR.mp4},
teaser = {teasers/virtualhandARVR.png},
abstract = {Most AR and VR headsets use stereoscopic displays to show virtual objects in 3D. However, the limitations of current stereo display systems affect depth perception through conflicting depth cues, which then also affect virtual hand interaction in peri-personal space, i.e., within arm's reach. We performed a Fitts' law experiment to better understand the impact of stereo display deficiencies of AR and VR headsets on pointing at close-by targets arranged laterally or along the line of sight. According to our results, the movement direction and the corresponding change in target depth affect pointing time and throughput; subjects' movements towards/away from their head were slower and less accurate than their lateral movements (left/right). However, even though subjects moved faster in AR, we did not observe a significant difference for pointing performance between AR and VR headsets, which means that previously identified differences in depth perception between these platforms seem to have no strong effect on interaction. Our results also help 3D user interface designers understand how changes in target depth affect users' performance in different movement directions in AR and VR.},
keywords = {3D pointing, mid-air, stereo},
}
@inproceedings{marquardt2018audiotactile,
title = {Audio-Tactile Proximity Feedback for Enhancing {3D} Manipulation},
author = {Marquardt*, Alexander and Kruijff, Ernst and Trepkowski*, Christina and Maiero*, Jens and Schwandt, Andrea and Hinkenjann, André and Stuerzlinger, Wolfgang and Schöning, Johannes},
booktitle = {24th Symposium on Virtual Reality Software and Technology},
publisher = {ACM},
series = {VRST '18},
year = {2018},
month = {Nov},
articleno = {2},
numpages = {10},
doi = {https://doi.org/10.1145/3281505.3281525},
pdf = {papers/tactaproximity.pdf},
teaser = {teasers/tactaproximity.png},
abstract = {In presence of conflicting or ambiguous visual cues in complex scenes, performing 3D selection and manipulation tasks can be challenging. To improve motor planning and coordination, we explore audio-tactile cues to inform the user about the presence of objects in hand proximity, e.g., to avoid unwanted object penetrations. We do so through a novel glove-based tactile interface, enhanced by audio cues. Through two user studies, we illustrate that proximity guidance cues improve spatial awareness, hand motions, and collision avoidance behaviors, and show how proximity cues in combination with collision and friction cues can significantly improve performance.},
keywords = {haptics, tactile feedback, 3D manipulation},
}
@inproceedings{marquardt2018guidance,
title = {Tactile Hand Motion and Pose Guidance for {3D} Interaction},
author = {Marquardt*, Alexander and Maiero*, Jens and Kruijff, Ernst and Trepkowski*, Christina and Schwandt, Andrea and Hinkenjann, André and Schöning, Johannes and Stuerzlinger, Wolfgang},
booktitle = {24th Symposium on Virtual Reality Software and Technology},
publisher = {ACM},
series = {VRST '18},
year = {2018},
month = {Nov},
articleno = {3},
numpages = {10},
doi = {https://doi.org/10.1145/3281505.3281526},
pdf = {papers/tactaguide.pdf},
video = {videos/tactaguide.mp4},
teaser = {teasers/tactaguide.png},
abstract = {We present a novel forearm-and-glove tactile interface that can enhance 3D interaction by guiding hand motor planning and coordination. In particular, we aim to improve hand motion and pose actions related to selection and manipulation tasks. Through our user studies, we illustrate how tactile patterns can guide the user, by triggering hand pose and motion changes, for example to grasp (select) and manipulate (move) an object. We discuss the potential and limitations of the interface, and outline future work.},
keywords = {haptics, guidance, tactile feedback, 3D manipulation},
}
@inproceedings{cetin2018valarge,
title = {Visual Analytics on Large Displays: Exploring User Spatialization and How Size and Resolution Affect Task Performance},
author = {Cetin*, Gokhan and Stuerzlinger, Wolfgang and Dill, John},
booktitle = {Symposium on Big Data Visual Analytics},
publisher = {IEEE},
series = {BDVA '18},
year = {2018},
month = {Oct},
pages = {21-30},
doi = {https://doi.org/10.1109/BDVA.2018.8534027},
pdf = {papers/space2VA.pdf},
teaser = {teasers/space2VA.png},
abstract = {Large, high-resolution displays (LHRDs) have been shown to enable increased productivity over conventional monitors. Previous work has identified the benefits of LHRDs for Visual Analytics tasks, where the user is analyzing complex data sets. However, LHRDs are fundamentally different from desktop and mobile computing environments, presenting some unique usability challenges and opportunities, and need to be better understood. There is thus a need for additional studies to analyze the impact of LHRD size and display resolution on content spatialization strategies and Visual Analytics task performance. We present the results of two studies of the effects of physical display size and resolution on analytical task successes and also analyze how participants spatially cluster visual content in different display conditions. Overall, we found that navigation technique preferences differ significantly among users, that the wide range of observed spatialization types suggest several different analysis techniques are adopted, and that display size affects clustering task performance whereas display resolution does not.},
keywords = {visual analytics, visualization, large display system, large display interaction, V4Space},
}
@inproceedings{elmeseery2018dynspace,
title = {Multiple Workspaces in Visual Analytics},
author = {El Meseery*, Maha and Wu*, Yuyao and Stuerzlinger, Wolfgang},
booktitle = {Symposium on Big Data Visual Analytics},
publisher = {IEEE},
series = {BDVA '18},
year = {2018},
month = {Oct},
pages = {70-81},
doi = {https://doi.org/10.1109/BDVA.2018.8534019},
pdf = {papers/dynspace.pdf},
video = {videos/dynspace.mp4},
teaser = {teasers/dynspace.png},
abstract = {Exploratory visual analysis is an iterative process, where analysts often start from an overview of the data. Subsequently, they often pursue different hypotheses through multiple rounds of interaction and analysis. Commercial visualization packages support mostly a model with a single analysis path, where the system view represents only the final state of the users' current analysis. In this paper, we investigate the benefit of using multiple workspaces to support alternative analyses, enabling users to create different workspaces to pursue multiple analysis paths at the same time. We implemented a prototype for multiple workspaces using a multi-tab design in a visual analytics system. The results of our user studies show that multiple workspaces: enable analysts to work on concurrent tasks, work well for organizing an analysis, and make it easy to revisit previous parts of their work.},
keywords = {visual analytics, visualization, alternatives, scenarios},
}
@inproceedings{machuca2018multiplanes,
title = {Multiplanes: Assisted Freehand VR Sketching},
author = {Barrera Machuca*, Mayra D. and Asente, Paul and Lu*, Jingwan and Kim, Byungmoon and Stuerzlinger, Wolfgang},
booktitle = {Symposium on Spatial User Interaction},
publisher = {ACM},
series = {SUI '18},
year = {2018},
month = {Oct},
pages = {36-47},
doi = {https://doi.org/10.1145/3267782.3267786},
pdf = {papers/multiplanes.pdf},
video = {videos/multiplanes.mp4},
teaser = {teasers/multiplanes.png},
abstract = {The presence of a third dimension makes accurate drawing in virtual reality (VR) more challenging than 2D drawing. These challenges include higher demands on spatial cognition and motor skills, as well as the potential for mistakes caused by depth perception errors. We present Multiplanes, a VR drawing system that supports both the flexibility of freehand drawing and the ability to draw accurate shapes in 3D by affording both planar and beautified drawing. The system was designed to address the above-mentioned challenges. Multiplanes generates snapping planes and beautification trigger points based on previous and current strokes and the current controller pose. Based on geometrical relationships to previous strokes, beautification trigger points serve to guide the user to reach specific positions in space. The system also beautifies user's strokes based on the most probable intended shape while the user is drawing them. With Multiplanes, in contrast to other systems, users do not need to manually activate such guides, allowing them to focus on the creative process.},
keywords = {3D sketching, 3D drawing, 3D modeling, 3D user interfaces},
}
@inproceedings{sun2018comparing,
title = {Comparing Input Methods and Cursors for {3D} Positioning with Head-Mounted Displays},
author = {Sun*, Junwei and Stuerzlinger, Wolfgang and Riecke, Bernhard E.},
booktitle = {15th Symposium on Applied Perception},
publisher = {ACM},
series = {SAP '18},
year = {2018},
month = {Aug},
articleno = {8},
numpages = {8},
doi = {https://doi.org/10.1145/3225153.3225167},
pdf = {papers/input4VR.pdf},
teaser = {teasers/input4VR.png},
abstract = {Moving objects is an important task in 3D user interfaces. In this work, we focus on (precise) 3D object positioning in immersive virtual reality systems, especially head-mounted displays (HMDs). To evaluate input method performance for 3D positioning, we focus on an existing sliding algorithm, in which objects slide on any contact surface. Sliding enables rapid positioning of objects in 3D scenes on a desktop system but is yet to be evaluated in an immersive system. We performed a user study that compared the efficiency and accuracy of different input methods (mouse, hand-tracking, and trackpad) and cursor display conditions (stereo cursor and one-eyed cursor) for 3D positioning tasks with the HTC Vive. The results showed that the mouse outperformed hand-tracking and the trackpad, in terms of efficiency and accuracy. Stereo cursor and one-eyed cursor did not demonstrate a significant difference in performance, yet the stereo cursor condition was rated more favourable. For situations where the user is seated in immersive VR, the mouse is thus still the best input device for precise 3D positioning.},
keywords = {3D positioning, input device},
}
@inproceedings{yamanaka2018steering,
title = {Steering Through Successive Objects},
author = {Yamanaka*, Shota and Stuerzlinger, Wolfgang and Miyashita, Homei},
booktitle = {Conference on Human Factors in Computing Systems},
publisher = {ACM},
series = {CHI '18},
year = {2018},
month = {Apr},
articleno = {603},
numpages = {13},
doi = {https://doi.org/10.1145/3173574.3174177},
pdf = {papers/steervscross.pdf},
teaser = {teasers/steervscross.png},
abstract = {We investigate stroking motions through successive objects with styli. There are several promising models for stroking motions, such as crossing tasks, which require endpoint accuracy of a stroke, or steering tasks, which require continuous accuracy throughout the trajectory. However, a task requiring users to repeatedly steer through constrained path segments has never been studied, although such operations are needed in GUIs, e.g., for selecting icons or objects on illustration software through lassoing. We empirically confirmed that the interval, trajectory width, and obstacle size significantly affect the movement speed. Existing models can not accurately predict user performance in such tasks. We found several unexpected results such as that steering through denser objects sometimes required less times than expected. Speed profile analysis showed the reasons behind such behaviors, such as participants' anticipation strategies. We also discuss the applicability of exiting performance models and revisions.},
keywords = {steering, lasso, group selection},
}
@inproceedings{ortega2018wiggle,
title = {Pointing at Wiggle {3D} Displays},
author = {Ortega, Michael and Stuerzlinger, Wolfgang},
booktitle = {Conference on Virtual Reality and {3D} User Interfaces},
publisher = {IEEE},
series = {VR '18},
year = {2018},
month = {Mar},
pages = {335-340},
doi = {https://doi.org/10.1109/VR.2018.8447552},
pdf = {papers/wigglepoint.pdf},
video = {videos/wigglepoint.m4v},
teaser = {teasers/wigglepoint.png},
abstract = {This paper presents two new pointing techniques for wiggle 3D displays, which present the 2D projection of 3D content with automatic (rotatory) motion parallax. Standard pointing at targets in wiggle 3D displays is challenging as the content is constantly in motion. The two pointing techniques presented here take advantage of the cursor's current position or the user's gaze direction for collocating the wiggle rotation center and potential targets. We evaluate the performance of the pointing techniques with a novel methodology that integrates 3D distractors into the ISO-9241-9 standard task. The experimental results indicate that the new techniques are significantly more efficient than standard pointing techniques in wiggle 3D displays. Given that we observed no performance variation for different targets, our new techniques seem to negate any interaction performance penalties of wiggle 3D displays.},
keywords = {3D pointing},
}
@inproceedings{nguyenvo2018referenceframe,
title = {Simulated Reference Frame: A Cost-Effective Solution to Improve Spatial Orientation in {VR}},
author = {Nguyen-Vo*, Thinh and Riecke, Bernhard E. and Stuerzlinger, Wolfgang},
booktitle = {Conference on Virtual Reality and {3D} User Interfaces},
publisher = {IEEE},
series = {VR '18},
year = {2018},
month = {Mar},
pages = {415-422},
doi = {https://doi.org/10.1109/VR.2018.8446383},
pdf = {papers/spatialreferenceframe.pdf},
teaser = {teasers/spatialreferenceframe.png},
abstract = {Virtual Reality (VR) is increasingly used in spatial cognition research, as it offers high experimental control in naturalistic multimodal environments, which is hard to achieve in real-world settings. Although recent technological advances offer a high level of photorealism, locomotion in VR is still restricted because people might not perceive their self-motion as they would in the real world. This might be related to the inability to use embodied spatial orientation processes, which support automatic and obligatory updating of our spatial awareness. Previous research has identified the roles reference frames play in retaining spatial orientation. Here, we propose using visually overlaid rectangular boxes, simulating reference frames in VR, to provide users with a better insight into spatial direction in landmark-free virtual environments. The current mixed-method study investigated how different variations of the visually simulated reference frames might support people in a navigational search task. Performance results showed that the existence of a simulated reference frame yields significant effects on participants completion time and travel distance. Though a simulated CAVE translating with the navigator (one of the simulated reference frames) did not provide significant benefits, the simulated room (another simulated reference frame depicting a rest frame) significantly boosted user performance in the task as well as improved participants preference in the post-experiment evaluation. Results suggest that adding a visually simulated reference frame to VR applications might be a cost-effective solution to the spatial disorientation problem in VR.},
keywords = {3D navigation},
}
@inproceedings{tran2017virtualarm,
title = {Effects of Virtual Arm Representations on Interaction in Virtual Environments},
author = {Tran+, Tanh Quang and Shin*, HyunJu and Stuerzlinger, Wolfgang and Han, JungHyun},
booktitle = {23rd Symposium on Virtual Reality Software and Technology},
publisher = {ACM},
series = {VRST '17},
year = {2017},
month = {Nov},
articleno = {40},
numpages = {9},
doi = {https://doi.org/10.1145/3139131.3139149},
pdf = {papers/armrepresentation.pdf},
teaser = {teasers/armrepresentation.png},
abstract = {Many techniques for visualization and interaction that potentially increase user performance have been studied in the growing field of virtual reality. However, the effects of virtual-arm representations on users' performance and perception in selection tasks have not been studied before. This paper presents the results of a user study of three different representations of the virtual arm: "hand only," "hand+forearm," and "whole arm" which includes the upper arm. In addition to the representations' effects on performance and perception in selection tasks, we investigate how the users' performance changes depending on whether collisions with objects are allowed or not. The relationship between the virtual-arm representations and the senses of agency and ownership are also explored. Overall, we found that the "whole arm" condition performed worst.},
keywords = {3D pointing, presence},
}
@inproceedings{putze2017eeg,
title = {Automatic Classification of Auto-Correction Errors in Predictive Text Entry Based on {EEG} and Context Information},
author = {Putze, Felix and Schünemann*, Maik and Schultz, Tanja and Stuerzlinger, Wolfgang},
booktitle = {19th Conference on Multimodal Interaction},
publisher = {ACM},
series = {ICMI '17},
year = {2017},
month = {Nov},
pages = {137–145},
doi = {https://doi.org/10.1145/3136755.3136784},
pdf = {papers/classifyAutoCorrectEEG.pdf},
teaser = {teasers/classifyAutoCorrectEEG.png},
abstract = {State-of-the-art auto-correction methods for predictive text entry systems work reasonably well, but can never be perfect due to the properties of human language. We present an approach for the automatic detection of erroneous auto-corrections based on brain activity and text-entry-based context features. We describe an experiment and a new system for the classification of human reactions to auto-correction errors. We show how auto-correction errors can be detected with an average accuracy of 85%.},
keywords = {EEG, text entry, autocorrect, errors},
}
@inproceedings{zaman2017mace,
title = {{MACE}: A New Interface for Comparing and Editing of Multiple Alternative Documents for Generative Design},
author = {Zaman, Loutfouz and Stuerzlinger, Wolfgang and Neugebauer+, Christian},
booktitle = {Symposium on Document Engineering},
publisher = {ACM},
series = {DocEng '17},
year = {2017},
month = {Sep},
pages = {67–76},
doi = {https://doi.org/10.1145/3103010.3103013},
pdf = {papers/mace.pdf},
teaser = {teasers/mace.png},
abstract = {We present a new interface for interactive comparisons of more than two alternative documents in the context of a generative design system that uses generative data-flow networks defined via directed acyclic graphs. To better show differences between such networks, we emphasize added, deleted, (un)changed nodes and edges. We emphasize differences in the output as well as parameters using highlighting and enable post-hoc merging of the state of a parameter across a selected set of alternatives. To minimize visual clutter, we introduce new difference visualizations for selected nodes and alternatives using additive and subtractive encodings, which improve readability and keep visual clutter low. We analyzed similarities in networks from a set of alternative designs produced by architecture students and found that the number of similarities outweighs the differences, which motivates use of subtractive encoding. We ran a user study to evaluate the two main proposed difference visualization encodings and found that they are equally effective.},
keywords = {alternatives, difference visualization, design},
}
@inproceedings{zeidler2017automatic,
title = {Automatic Generation of User Interface Layouts for Alternative Screen Orientations},
author = {Zeidler*, Clemens and Weber, Gerald and Stuerzlinger, Wolfgang and Lutteroth, Christof},
booktitle = {Human-Computer Interaction},
publisher = {Springer},
series = {INTERACT '17},
year = {2017},
month = {Sep},
volume = {LNCS 10513},
pages = {13-35},
doi = {https://doi.org/10.1007/978-3-319-67744-6_2},
pdf = {papers/autoorientlayout.pdf},
video = {videos/autoorientlayout.mp4},
teaser = {teasers/autoorientlayout.png},
abstract = {Creating multiple layout alternatives for graphical user interfaces to accommodate different screen orientations for mobile devices is labor intensive. Here, we investigate how such layout alternatives can be generated automatically from an initial layout. Providing good layout alternatives can inspire developers in their design work and support them to create adaptive layouts. We performed an analysis of layout alternatives in existing apps and identified common real-world layout transformation patterns. Based on these patterns we developed a prototype that generates landscape and portrait layout alternatives for an initial layout. In general, there is a very large number of possibilities of how widgets can be rearranged. For this reason we developed a classification method to identify and evaluate "good" layout alternatives automatically. From this set of "good" layout alternatives, designers can choose suitable layouts for their applications. In a questionnaire study we verified that our method generates layout alternatives that appear well structured and are easy to use.},
keywords = {GUI, layout},
award = {This work received a Reviewer's Choice Award},
}
@inproceedings{bjerre2017predictive,
title = {Predictive Model for Group Selection Performance on Touch Devices},
author = {Bjerre+, Per and Christensen+, Allan and Pedersen+, Andreas Køllund and Pedersen+, Simon André and Stuerzlinger, Wolfgang and Stenholt, Rasmus},
booktitle = {Human-Computer Interaction, Interaction Contexts},
publisher = {Springer},
series = {HCI International '17},
year = {2017},
month = {Jul},
volume = {LNCS 10272},
pages = {142-161},
doi = {https://doi.org/10.1007/978-3-319-58077-7_12},
pdf = {papers/lazytouch.pdf},
teaser = {teasers/lazytouch.png},
abstract = {Users spend hours making selections with ineffective tools, we therefore examine selection methods for efficiency in various touch trials. In a preliminary study three alternative selection methods were identified, we compared these to a smart selection tool. The study showed that a single selection method was the fastest; however, when the amount of targets increased, a multiple selection tool became more efficient. A secondary study with more targets revealed similar results. We therefore examined the single selection method against traditional selection methods in a user study. The results reveal a model of the average action and time cost for all methods within the parameters of mental preparation and target addition. The study revealed that the most favored selection methods were a lasso and brush selection tool. The study provides evidence towards a predictive model of selection performance for multiple target selection trials.},
keywords = {group selection, touch},
}
@inproceedings{yamanaka2017steering,
title = {Steering Through Sequential Linear Path Segments},
author = {Yamanaka*, Shota and Stuerzlinger, Wolfgang and Miyashita, Homei},
booktitle = {Conference on Human Factors in Computing Systems},
publisher = {ACM},
series = {CHI '17},
year = {2017},
month = {May},
pages = {232–243},
doi = {https://doi.org/10.1145/3025453.3025836},
pdf = {papers/pathsequencesteering.pdf},
teaser = {teasers/pathsequencesteering.png},
abstract = {The steering law models human motor performance and has been verified to hold for a single linear and/or circular path. Some extensions investigated steering around corners. Yet, little is known about human performance in navigating joined linear paths, i.e., successions of path segments with different widths. Such operations appear in graphical user interface tasks, including lasso operations in illustration software. In this work, we conducted several experiments involving joined paths. The results show that users significantly changed their behavior, and that this strategy change can be predicted beforehand. A simple model summing the two indexes of difficulty (IDs) for each path predicts movement time well, but more sophisticated models were also evaluated. The best model in terms of both of R2 and AIC values includes the ID of the crossing operation to enter the second path.},
keywords = {steering, lasso, group selection},
}
@inproceedings{jang2017fatigue,
title = {Modeling Cumulative Arm Fatigue in Mid-Air Interaction Based on Perceived Exertion and Kinetics of Arm Motion},
author = {Jang*, Sujin and Stuerzlinger, Wolfgang and Ambike, Satyajit and Ramani, Karthik},
booktitle = {Conference on Human Factors in Computing Systems},
publisher = {ACM},
series = {CHI '17},
year = {2017},
month = {May},
pages = {3328–3339},
doi = {https://doi.org/10.1145/3025453.3025523},
url = {https://github.com/CDesignGitHub/Cumulative-Arm-Fatigue_CHI-2017},
pdf = {papers/cumulativearmfatigue.pdf},
teaser = {teasers/cumulativearmfatigue.png},
abstract = {Quantifying cumulative arm muscle fatigue is a critical factor in understanding, evaluating, and optimizing user experience during prolonged mid-air interaction. A reasonably accurate estimation of fatigue requires an estimate of an individual's strength. However, there is no easy-to-access method to measure individual strength to accommodate inter-individual differences. Furthermore, fatigue is influenced by both psychological and physiological factors, but no current HCI model provides good estimates of cumulative subjective fatigue. We present a new, simple method to estimate the maximum shoulder torque through a mid-air pointing task, which agrees with direct strength measurements. We then introduce a cumulative fatigue model informed by subjective and biomechanical measures. We evaluate the performance of the model in estimating cumulative subjective fatigue in mid-air interaction by performing multiple cross-validations and a comparison with an existing fatigue metric. Finally, we discuss the potential of our approach for real-time evaluation of subjective fatigue as well as future challenges.},
keywords = {fatigue, mid-air, model},
}
@inproceedings{yamanaka2017analysis,
title = {Analysis and Modeling of Steering Behavior of Connected Straight Paths},
author = {Yamanaka*, Shota and Stuerzlinger, Wolfgang and Miyashita, Homei},
booktitle = {Interaction},
year = {2017},
month = {Mar},
pages = {17-26},
url = {http://www.interaction-ipsj.org/proceedings/2017},
pdf = {papers/steeringanalysis.pdf},
teaser = {teasers/steeringanalysis.png},
commented-title = {Analysis and Modeling of the Operation of Steering a Connected Linear Route},
abstract = {The steering law models human motor performance and has been verified to hold for a single linear and/or circular path. Some extensions investigated steering around corners. Yet, little is known about human performance in navigating joined linear paths, i.e., successions of path segments with different widths, although such operations appear in our graphical user interface tasks, including lasso operations in illustration software. In this work, we conducted three experiments involving joined paths. The results showed that users significantly changed their behavior, and that that strategy change can be determined beforehand. A simple model summing the two indexes of difficulty (IDs) for each path was efficient to predict the time (R2 > 0.96), but more sophisticated models were also evaluated. The best model includes the ID of the crossing operation to enter the second path, in terms of both of R2 and AIC values.},
keywords = {steering, lasso, group selection},
award = {This work received a Best Paper Award},
note = {In Japanese},
}
@inproceedings{kim2016holostation,
title = {{HoloStation}: Augmented Visualization and Presentation},
author = {Kim*, Minju and Lee*, Jungjin and Stuerzlinger, Wolfgang and Wohn, Kwangyun},
booktitle = {{SIGGRAPH} {ASIA} Symposium on Visualization},
publisher = {ACM},
series = {SA Vis '16},
year = {2016},
month = {Dec},
articleno = {12},
numpages = {9},
doi = {https://doi.org/10.1145/3002151.3002161},
pdf = {papers/holostation.pdf},
teaser = {teasers/holostation.png},
abstract = {As much as stories need to be told, images need to be presented. Although visualizations are meant to be self-explanatory, often enhancing their expressive power by incorporating a certain degree of interactivity, visualized images today often fail to encourage the active engagement of the user/audience. In many cases, interactive interventions by a human presenter have the potential to drastically improve the engagement with visualization. Rather than just showing the content, the presenter then enhances information delivery, e.g., by providing the context of the visualization. In this paper, we propose a novel concept called augmented presentation in which the human presenter occupies the same physical space as the visualized information, thereby presenting and interacting with the visualized images seamlessly. Depending on the level of engagement the presenter's role may vary: from a simple storyteller to an augmented presenter who may be regarded as a part of the visualized entity. To further the development of the new idea of augmented presentation, we have designed, implemented, and user-tested a visualization system named HoloStation. The presenter is placed between two projection screens: the front one is half-mirrored and the rear one is a conventional wall screen. The 3D stereoscopic images are rendered to appear in-between, thereby creating a coherent 3D visualization space filled with digital information and the human presenter. We have conducted a controlled experiment to investigate the subjective level of immersion and engagement of the audience with HoloStation compared to the traditional presentation. Our results suggest that our new form of augmented presentation has a potential not only to enhance the quality of information presentation but also to enrich the user experience on visualizations.},
keywords = {stereo, display, augmented reality},
}
@inproceedings{waese2016rsvp,
title = {An Evaluation of Interaction Methods for Controlling RSVP Displays in Visual Search Tasks},
author = {Waese*, Jamie and Stuerzlinger, Wolfgang and Provart, Nicholas},
booktitle = {Symposium on Big Data Visual Analytics},
publisher = {IEEE},
series = {BDVA '16},
year = {2016},
month = {Nov},
pages = {1-8},
doi = {https://doi.org/10.1109/BDVA.2016.7787041},
pdf = {papers/rsvp.pdf},
teaser = {teasers/rsvp.png},
abstract = {Accurately identifying images with subtly varying features from a large set of similar images can be a challenging task. To succeed, viewers must perceive subtle differences between multiple nearly identical images and react appropriately. The Rapid Serial Visual Presentation (RSVP) display technique has the potential to improve performance as it exploits our ability to preattentively recognize differences between images when they are flashed on a screen in a rapid and serial manner. We compared the speed and accuracy of three RSVP interface methods ("Hover", "Slide Show" and "Velocity") against a traditional "Point & Click" non-RSVP interface to test whether an RSVP display improves performance in visual search tasks. In a follow-up study we compared "Hover" and "Velocity" RSVP interface methods against a "Small Multiples" non-RSVP interface to explore the interaction of interface type and target size on visual search tasks. We found the "Hover" RSVP interface to significantly reduce the time it takes to perform visual search tasks with no reduction in accuracy, regardless of the size of the search targets. Beyond the gene identification task tested here, these experiments inform the design of user interfaces for many other visual search tasks.},
keywords = {visual analytics, rsvp, visualization, search},
}
@inproceedings{sun2016depthpop,
title = {Shift-Sliding and Depth-Pop for {3D} Positioning},
author = {Sun*, Junwei and Stuerzlinger, Wolfgang and Shuralyov*, Dmitri},
booktitle = {Symposium on Spatial User Interaction},
publisher = {ACM},
series = {SUI '16},
year = {2016},
month = {Oct},
pages = {69-78},
doi = {https://doi.org/10.1145/2983310.2985748},
pdf = {papers/depthpop.pdf},
video = {videos/depthpop.mp4},
teaser = {teasers/depthpop.png},
abstract = {Moving objects is an important task in 3D user interfaces. We describe two new techniques for 3D positioning, designed for a mouse, but usable with other input devices. The techniques enable rapid, yet easy-to-use positioning of objects in 3D scenes. With sliding, the object follows the cursor and moves on the surfaces of the scene. Our techniques enable precise positioning of constrained objects. Sliding assumes that by default objects stay in contact with the scene's front surfaces, are always at least partially visible, and do not interpenetrate other objects. With our new Shift-Sliding method the user can override these default assumptions and lift objects into the air or make them collide with other objects. Shift-Sliding uses the local coordinate system of the surface that the object was last in contact with, which is a new form of context-dependent manipulation. We also present Depth-Pop, which maps mouse wheel actions to all object positions along the mouse ray, where the object meets the default assumptions for sliding. For efficiency, both methods use frame buffer techniques. Two user studies show that the new techniques significantly speed up common 3D positioning tasks.},
keywords = {3D manipulation, sliding, 3D positioning},
award = {This work received a Best Demonstration Award},
}
@inproceedings{brown2016inair,
title = {Exploring the Throughput Potential of In-Air Pointing},
author = {Brown*, Michelle A. and Stuerzlinger, Wolfgang},
booktitle = {18th International Conference on Human-Computer Interaction. Interaction Platforms and Techniques, Part {II}},
publisher = {Springer},
series = {HCI International '16},
year = {2016},
month = {Jul},
volume = {LNCS 9732},
pages = {13–24},
doi = {https://doi.org/10.1007/978-3-319-39516-6_2},
pdf = {papers/fingercast.pdf},
teaser = {teasers/fingercast.png},
abstract = {We present an analysis of how pointing performance in in-air un-instrumented pointing can be improved, towards throughput equal to the mouse. Pointing using a chopstick is found to achieve the highest average throughput, with 3.89 bps. This is a substantial improvement over using the finger to point at the screen. Two potential reasons for the throughput gap between chopstick and finger operation were explored: the natural curvature of human fingers and tracking issues that occurs when fingers bend toward the device. Yet, neither one of these factors seems to significantly affect throughput. Thus other, yet unexplored factors must be the cause. Lastly, the effect of unreliable click detection was also explored, as this also affects un-instrumented performance, and was found to have a linear effect.},
keywords = {mid-air, 3D pointing, errors},
}
@inproceedings{bjerre2016transition,
title = {Transition Times for Manipulation Tasks in Hybrid Interfaces},
author = {Christensen+, Allan and Pedersen+, Simon André and Bjerre+, Per and Pedersen+, Andreas Køllund and Stuerzlinger, Wolfgang},
booktitle = {18th International Conference on Human-Computer Interaction. Interaction Platforms and Techniques, Part {II}},
publisher = {Springer},
series = {HCI International '16},
year = {2016},
month = {Jul},
volume = {LNCS 9732},
pages = {138-150},
doi = {https://doi.org/10.1007/978-3-319-39516-6_13},
pdf = {papers/transitions.pdf},
teaser = {teasers/transitions.png},
abstract = {Compared to the mouse, uninstrumented in-air interaction has been shown to be slower and less precise for pointing. Yet, in-air input is preferable or advantageous in some interaction scenarios. Thus, we examine a three-device hybrid setup involving the mouse, keyboard, and a Leap Motion. We performed a user study to quantify the costs associated with transitioning between these interaction devices, while performing simple 2D manipulation tasks using the mouse and Leap Motion. We found that transitioning to and from the Leap Motion takes on average 0.87 s longer than those between the mouse and keyboard.},
keywords = {mid-air, 3D manipulation, 3D positioning},
}
@inproceedings{arif2016smartbackspace,
title = {Evaluation of a Smart-Restorable Backspace Technique to Facilitate Text Entry Error Correction},
author = {Arif, Ahmed Sabbir and Kim, Sunjun and Stuerzlinger, Wolfgang and Lee, Geehyuk and Mazalek, Ali},
booktitle = {Conference on Human Factors in Computing Systems},
publisher = {ACM},
series = {CHI '16},
year = {2016},
month = {Apr},
pages = {5151–5162},
doi = {https://doi.org/10.1145/2858036.2858407},
pdf = {papers/smartrestorablebackspace.pdf},
video = {videos/SmartRestorableBackspace.mp4},
teaser = {teasers/smartrestorablebackspace.png},
abstract = {We present a new smart-restorable backspace technique to facilitate correction of "overlooked" errors on touchscreen-based tablets. We conducted an empirical study to compare the new backspace technique with the conventional one. Results of the study revealed that the new technique improves the overall text entry performance, both in terms of speed and operations per character, by significantly reducing error correction efforts. In addition, results showed that most users preferred the new technique to the one they use on their tablets, and found it easy to learn and use. Most of them also felt that it improved their overall text entry performance, thus wanted to keep using it.},
keywords = {text entry, errors},
}
@inproceedings{chan2016microgestures,
title = {User Elicitation on Single-Hand Microgestures},
author = {Chan*, Edwin and Seyed*, Teddy and Stuerzlinger, Wolfgang and Yang, Xing-Dong and Maurer, Frank},
booktitle = {Conference on Human Factors in Computing Systems},
publisher = {ACM},
series = {CHI '16},
year = {2016},
month = {Apr},
pages = {3403–3414},
doi = {https://doi.org/10.1145/2858036.2858589},
pdf = {papers/singlehandmicrogestureelicitation.pdf},
teaser = {teasers/singlehandmicrogestureelicitation.png},
abstract = {Gestural interaction has become increasingly popular, as enabling technologies continue to transition from research to retail. The mobility of miniaturized (and invisible) technologies introduces new uses for gesture recognition. This paper investigates single-hand microgestures (SHMGs), detailed gestures in a small interaction space. SHMGs are suitable for the mobile and discrete nature of interactions for ubiquitous computing. However, there has been a lack of end-user input in the design of such gestures. We performed a user-elicitation study with 16 participants to determine their preferred gestures for a set of referents. We contribute an analysis of 1,632 gestures, the resulting gesture set, and prevalent conceptual themes amongst the elicited gestures. These themes provide a set of guidelines for gesture designers, while informing the designs of future studies. With the increase in hand-tracking and electronic devices in our surroundings, we see this as a starting point for designing gestures suitable to portable ubiquitous computing.},
keywords = {gesture recognition, gestures, elicitation, mid-air},
award = {This work received a Best Paper Honorable Mention Award},
}
@inproceedings{perteneder2016ambientlight,
title = {Glowworms and Fireflies: Ambient Light on Large Interactive Surfaces},
author = {Perteneder*, Florian and Grossauer*, Eva-Maria Beatrix and Leong*, Joanne and Stuerzlinger, Wolfgang and Haller, Michael},
booktitle = {Conference on Human Factors in Computing Systems},
publisher = {ACM},
series = {CHI '16},
year = {2016},
month = {Apr},
pages = {5849–5861},
doi = {https://doi.org/10.1145/2858036.2858524},
pdf = {papers/glowwormsfireflies.pdf},
video = {videos/glowworms.mp4},
teaser = {teasers/glowworms.png},
abstract = {Ambient light is starting to be commercially used to enhance the viewing experience for watching TV. We believe that ambient light can add value in meeting and control rooms that use large vertical interactive surfaces. Therefore, we equipped a large interactive whiteboard with a peripheral ambient light display and explored its utility for different scenarios by conducting two controlled experiments. In the first experiment, we investigated how ambient light can be used for peripheral notifications, and how perception is influenced by the user's position and the type of work they are engaged in. The second experiment investigated the utility of ambient light for off-screen visualization. We condense our findings into several design recommendations that we then applied to application scenarios to show the versatility and usefulness of ambient light for large surfaces.},
keywords = {ambient light, large display system},
}
@inproceedings{makonin2016mixedinitiative,
title = {Mixed-Initiative for Big Data: The Intersection of Human + Visual Analytics + Prediction},
author = {Makonin, Stephen and {McVeigh}+, Daniel and Stuerzlinger, Wolfgang and Tran*, Khoa and Popowich, Fred},
booktitle = {Hawaii International Conference on System Sciences},
publisher = {IEEE},
series = {HICSS '16},
year = {2016},
month = {Jan},
pages = {1427-1436},
doi = {https://doi.org/10.1109/HICSS.2016.181},
pdf = {papers/mixedinitiativesurvey.pdf},
teaser = {teasers/mixedinitiativesurvey.png},
abstract = {Existing surveys in visual analytics focus on the importance of the topic. However, many do not discuss the increasingly critical area of mixed-initiative systems. In this survey we discuss the importance of research in mixed-initiative systems and how it is different from visual analytics and other research fields. We present the conceptual architecture of a mixed-initiative visual analytics system (MIVAS) and the five key components that make up MIVASs (data wrangling, alternative discovery and comparison, parametric interaction, history tracking and exploration, and system agency and adaptation), which forms our main contribution. We compare and contrast different research that claims to be mixed-initiative against MIVASs and show how there is still a considerable amount of work that needs to be accomplished before any system can truly be mixed-initiative.},
keywords = {visual analytics, visualization, mixed initiative},
}
@inproceedings{strothoff2015pinsntouches,
title = {Pins 'n' Touches: An Interface for Tagging and Editing Complex Groups},
author = {Strothoff*, Sven and Stuerzlinger, Wolfgang and Hinrichs, Klaus},
booktitle = {Conference on Interactive Tabletops & Surfaces},
publisher = {ACM},
series = {ITS '15},
year = {2015},
month = {Nov},
pages = {191–200},
doi = {https://doi.org/10.1145/2817721.2817731},
pdf = {papers/pinsntouches.pdf},
video = {videos/pinsntouches.mp4},
teaser = {teasers/pinsntouches.png},
abstract = {Influenced by mouse/pen-based user interfaces, most touch-based object tagging techniques rely mostly on a single interaction point. Once objects are tagged, typically only individual object inclusions/exclusions are possible. Yet, for tagging larger groups with complex spatial layouts, more refinement may be necessary to achieve the desired result. We apply visual tag markers to objects to visualize their group association. Through a new multi-touch pin gesture that "pins" one or more objects "down" while tagging, our new interface is capable of efficiently grouping objects, as identified in our user studies.},
keywords = {touch, group selection},
}
@inproceedings{ortega2015shocam,
title = {{SHOCam}: A {3D} Orbiting Algorithm},
author = {Ortega, Michael and Stuerzlinger, Wolfgang and Scheurich*, Doug},
booktitle = {28th Annual Symposium on User Interface Software & Technology},
publisher = {ACM},
series = {UIST '15},
year = {2015},
month = {Nov},
pages = {119–128},
doi = {https://doi.org/10.1145/2807442.2807496},
pdf = {papers/shocam.pdf},
video = {videos/SHOcam.mp4},
teaser = {teasers/shocam.png},
abstract = {In this paper we describe a new orbiting algorithm, called SHOCam, which enables simple, safe and visually attractive control of a camera moving around 3D objects. Compared with existing methods, SHOCam provides a more consistent mapping between the user's interaction and the path of the camera by substantially reducing variability in both camera motion and look direction. Also, we present a new orbiting method that prevents the camera from penetrating object(s), making the visual feedback - and with it the user experience - more pleasing and also less error prone. Finally, we present new solutions for orbiting around multiple objects and multi-scale environments.},
keywords = {3D navigation, 3D orbiting},
}
@inproceedings{vuibert2015docking,
title = {Evaluation of Docking Task Performance Using Mid-Air Interaction Techniques},
author = {Vuibert*, Vanessa and Stuerzlinger, Wolfgang and Cooperstock, Jeremy R.},
booktitle = {3rd Symposium on Spatial User Interaction},
publisher = {ACM},
series = {SUI '15},
year = {2015},
month = {Aug},
pages = {44–52},
doi = {https://doi.org/10.1145/2788940.2788950},
pdf = {papers/midairdock.pdf},
teaser = {teasers/midairdock.png},
abstract = {Mid-air interaction has the potential to manipulate objects in 3D with more natural input mappings. We compared the performance attainable using various mid-air interaction methods with a mechanically constrained input device in a 6 degrees-of-freedom (DoF) docking task in both accuracy and completion time. We found that tangible mid-air input devices supported faster docking performance, while exhibiting accuracy close to that of constrained devices. Interaction with bare hands in mid-air achieved similar time performance and accuracy compared to the constrained device.},
keywords = {3D manipulation, 3D positioning, docking, mid-air},
}
@inproceedings{teather2015factors,
title = {Factors Affecting Mouse-Based {3D} Selection in Desktop {VR} Systems},
author = {Teather, Robert J. and Stuerzlinger, Wolfgang},
booktitle = {3rd Symposium on Spatial User Interaction},
publisher = {ACM},
series = {SUI '15},
year = {2015},
month = {Aug},
pages = {10–19},
doi = {https://doi.org/10.1145/2788940.2788946},
pdf = {papers/mousestereo.pdf},
video = {videos/mousestereo.mp4},
teaser = {teasers/mousestereo.png},
abstract = {We present two experiments on mouse-based point selection in a desktop virtual reality system using stereo display and head-tracking. To address potential issues of using a mouse cursor with stereo display, we also evaluate the impact of using a one-eyed (mono) cursor. While a one-eyed cursor visualization eliminates depth conflicts, recent work suggests it offers worse performance than stereo cursors, possibly due to eye discomfort. Our results indicate that presenting the cursor in stereo significantly reduces performance for targets at different depths. The one-eyed cursor eliminates this effect, offering better performance than both screen-plane and geometry-sliding cursors visualized in stereo. However, it also performed slightly worse than stereo cursors in situations without depth conflicts. Our study suggests that this difference is not due exclusively to the relative transparency of such a cursor, hence eye fatigue or similar may be responsible.},
keywords = {3D positioning, stereo},
}
@inproceedings{zaman2015gemni,
title = {{GEM-NI}: A System for Creating and Managing Alternatives In Generative Design},
author = {Zaman*, Loutfouz and Stuerzlinger, Wolfgang and Neugebauer+, Christian and Woodbury, Robert and Elkhaldi*, Maher and Shireen*, Naghmi and Terry, Michael},
booktitle = {33rd Annual ACM Conference on Human Factors in Computing Systems},
publisher = {ACM},
series = {CHI '15},
year = {2015},
month = {Apr},
pages = {1201–1210},
doi = {https://doi.org/10.1145/2702123.2702398},
pdf = {papers/gem-ni.pdf},
video = {videos/GEM-NI.m4v},
teaser = {teasers/gem-ni.png},
abstract = {We present GEM-NI - a graph-based generative-design tool that supports parallel exploration of alternative designs. Producing alternatives is a key feature of creative work, yet it is not strongly supported in most extant tools. GEM-NI enables various forms of exploration with alternatives such as parallel editing, recalling history, branching, merging, comparing, and Cartesian products of and for alternatives. Further, GEM-NI provides a modal graphical user interface and a design gallery, which both allow designers to control and manage their design exploration. We conducted an exploratory user study followed by in-depth one-on-one interviews with moderately and highly skills participants and obtained positive feedback for the system features, showing that GEM-NI supports creative design work well.},
keywords = {alternatives, design},
}
@inproceedings{pfeiffer2015emsfeedback,
title = {{3D} Virtual Hand Pointing with {EMS} and Vibration Feedback},
author = {Pfeiffer*, Max and Stuerzlinger, Wolfgang},
booktitle = {Symposium on {3D} User Interfaces},
publisher = {IEEE},
series = {3DUI '15},
year = {2015},
month = {Mar},
pages = {117-120},
doi = {https://doi.org/10.1109/3DUI.2015.7131735},
pdf = {papers/EMSfeedback.pdf},
teaser = {teasers/EMSfeedback.png},
abstract = {Pointing is one of the most basic interaction methods for 3D user interfaces. Previous work has shown that visual feedback improves such actions. Here we investigate if electrical muscle stimulation (EMS) and vibration is beneficial for 3D virtual hand pointing. In our experiment we used a 3D version of a Fitts' task to compare visual feedback, EMS, vibration, with no feedback. The results demonstrate that both EMS and vibration provide reasonable addition to visual feedback. We also found good user acceptance for both technologies.},
keywords = {3D pointing, haptics},
}
@inproceedings{arif2014pseudopressure,
title = {The Use of Pseudo Pressure in Authenticating Smartphone Users},
author = {Arif*, Ahmed Sabbir and Ali, Mazalek and Stuerzlinger, Wolfgang},
booktitle = {11th International Conference on Mobile and Ubiquitous Systems: Computing, Networking and Services},
publisher = {ICST},
series = {MOBIQUITOUS '14},
year = {2014},
month = {Dec},
pages = {151–160},
doi = {https://doi.org/10.4108/icst.mobiquitous.2014.257919},
pdf = {papers/pressureauthentication.pdf},
teaser = {teasers/pressureauthentication.png},
abstract = {In this article, we present a new user authentication technique for touchscreen-based smartphone users that augments pseudo touch pressure as an extra security measure to the conventional digit-lock technique. The new technique enhances security by offering more unique password combinations than the most popular ones, by making each password specific to its owner, and by reducing the threat of smudge attacks. A study comparing the new technique with the digit-lock technique showed that overall it is slower and more error-prone, but performs substantially better in short term. Also, most users felt more secure using it and wanted to use it dominantly on their smartphones. A second study confirmed that it does enhance security by making it relatively more resistant to smudge attacks and less vulnerable to situations where attackers are already in possession of users' passwords.},
keywords = {authentication, password, mobile device},
}
@inproceedings{teather2014visualaids,
title = {Visual Aids in {3D} Point Selection Experiments},
author = {Teather*, Robert J. and Stuerzlinger, Wolfgang},
booktitle = {2nd Symposium on Spatial User Interaction},
publisher = {ACM},
series = {SUI '14},
year = {2014},
month = {Oct},
pages = {127–136},
doi = {https://doi.org/10.1145/2659766.2659770},
pdf = {papers/visualaidspointing.pdf},
video = {videos/3DvisualAids.mp4},
teaser = {teasers/visualaidspointing.png},
abstract = {We present a study investigating the influence of visual aids on 3D point selection tasks. In a Fitts' law pointing experiment, we compared the effects of texturing, highlighting targets upon being touched, and the presence of support cylinders intended to eliminate floating targets. Results of the study indicate that texturing and support cylinders did not significantly influence performance. Enabling target highlighting increased movement speed, while decreasing error rate. Pointing throughput was unaffected by this speed-accuracy tradeoff. Highlighting also eliminated significant differences between selection coordinate depth deviation and the deviation in the two orthogonal axes.},
keywords = {3D pointing, stereo},
}
@inproceedings{brown2014performance,
title = {The Performance of Un-Instrumented in-Air Pointing},
author = {Brown*, Michelle A. and Stuerzlinger, Wolfgang and de Mendonça Filho+, Euclides José},
booktitle = {Graphics Interface},
series = {GI '14},
year = {2014},
month = {May},
pages = {59–66},
url = {https://dl.acm.org/doi/10.5555/2619648.2619659},
footnote = {https://graphicsinterface.org/proceedings/gi2014/gi2014-8},
pdf = {papers/inairpointing.pdf},
teaser = {teasers/inairpointing.png},
abstract = {We present an analysis of in-air finger and hand controlled object pointing and selection. The study used a tracking system that required no instrumentation on the user. We compared the performance of the two pointing methods with and without elbow stabilization and found that the method that yielded the best performance varied for each participant, such that there was no method that performed significantly better than all others. We also directly compared user performance between un-instrumented in-air pointing and the mouse. We found that the un-instrumented in-air pointing performed significantly worse, at less than 75% of mouse throughput. Yet, the larger range of applications for un-instrumented 3D hand tracking makes this technology still an attractive option for user interfaces.},
keywords = {3D pointing, mid-air},
}
@inproceedings{arif2014adaptation,
title = {User Adaptation to a Faulty Unistroke-Based Text Entry Technique by Switching to an Alternative Gesture Set},
author = {Arif*, Ahmed Sabbir and Stuerzlinger, Wolfgang},
booktitle = {Graphics Interface},
series = {GI '14},
year = {2014},
month = {May},
pages = {183–192},
url = {https://dl.acm.org/doi/10.5555/2619648.2619679},
footnote = {https://graphicsinterface.org/proceedings/gi2014/gi2014-24},
pdf = {papers/faultygestures.pdf},
teaser = {teasers/faultygestures.png},
abstract = {This article presents results of two user studies to investigate user adaptation to a faulty unistroke gesture recognizer of a text entry technique. The intent was to verify the hypothesis that users gradually adapt to a faulty gesture recognition technique' s misrecognition errors and that this adaptation rate is dependent on how frequently they occur. Results confirmed that users gradually adapt to misrecognition errors by replacing the error prone gestures with alternative ones, as available. Also, users adapt to a particular misrecognition error faster if it occurs more frequently than others.},
keywords = {errors, gesture recognition, adaptation},
}
@inproceedings{latoschik2014evaluation,
title = {On the Art of the Evaluation and Presentation of RIS-Engineering},
author = {Latoschik, Marc Erich and Stuerzlinger, Wolfgang},
booktitle = {Software Engineering and Architectures for Realtime Interactive Systems},
publisher = {IEEE},
series = {SEARIS '14},
year = {2014},
month = {Mar},
pages = {9-17},
doi = {https://doi.org/10.1109/SEARIS.2014.7152796},
pdf = {papers/rispresent.pdf},
teaser = {teasers/rispresent.png},
abstract = {This article analyses the tasks of presenting and evaluating relevant scientific research in the field of Real-time Interactive Systems (RIS), i.e., in areas such as Virtual, Mixed, and Augmented Reality (VR, MR, and AR) and advanced Human-Computer Interaction. It identifies different methods for a structured approach to the description and evaluation of systems and their properties, including commonly found best practices as well as dos and don'ts. The article is targeted at authors as well as reviewers to guide both groups in the presentation as well as the appraisal of system engineering work.},
keywords = {systems, evaluation, virtual reality, augmented reality},
}
@inproceedings{arif2013pseudopressure,
title = {Pseudo-Pressure Detection and Its Use in Predictive Text Entry on Touchscreens},
author = {Arif*, Ahmed Sabbir and Stuerzlinger, Wolfgang},
booktitle = {Australian Computer-Human Interaction Conference: Augmentation, Application, Innovation, Collaboration},
series = {OzCHI '13},
year = {2013},
month = {Nov},
pages = {383-392},
doi = {https://doi.org/10.1145/2541016.2541024},
pdf = {papers/pseudopressure.pdf},
teaser = {teasers/pseudopressure.png},
abstract = {In this article we first present a new hybrid technique that combines existing time- and touch-point-based approaches to simulate pressure detection on standard touchscreens. Results of two user studies show that the new hybrid technique can distinguish (at least) two pressure levels, where the first requires on average 1.04 N and the second 3.24 N force on the surface. Then, we present a novel pressure-based predictive text entry technique that utilizes our hybrid pressure detection to enable users to bypass incorrect predictions by applying extra pressure on the next key. For inputting short English phrases with 10% non-dictionary words a comparison with conventional text entry in a study showed that the new technique increases entry speed by 9% and decreases error rates by 25%. Also, most users (83%) favour the new technique.},
keywords = {text entry, pressure, touch},
award = {This work received a Best Paper Award},
}
@inproceedings{arif2013evaluation,
title = {Evaluation of a New Error Prevention Technique for Mobile Touchscreen Text Entry},
author = {Arif*, Ahmed Sabbir and Stuerzlinger, Wolfgang},
booktitle = {Australian Computer-Human Interaction Conference: Augmentation, Application, Innovation, Collaboration},
series = {OzCHI '13},
year = {2013},
month = {Nov},
pages = {397-400},
doi = {https://doi.org/10.1145/2541016.2541063},
pdf = {papers/textpressure.pdf},
teaser = {teasers/textpressure.png},
abstract = {This paper presents a new pressure-based error prevention technique for mobile touchscreen text entry. Two user studies were conducted to compare the new technique with a conventional virtual keyboard, one with novice and another with expert users. Results of the first user study showed that with practice the new technique significantly improves accuracy. Yet, no such indication was observed during the second study.},
keywords = {text entry, errors, pressure, touch},
}
@inproceedings{lindlbauer2013perceptual,
title = {Perceptual Grouping: Selection Assistance for Digital Sketching},
author = {Lindlbauer*, David and Haller, Michael and Hancock, Mark and Scott, Stacey and Stuerzlinger, Wolfgang},
booktitle = {Conference on Interactive Tabletops and Surfaces},
publisher = {ACM},
series = {ITS '13},
year = {2013},
month = {Oct},
pages = {51-60},
doi = {https://doi.org/10.1145/2512349.2512801},
pdf = {papers/suggero.pdf},
video = {videos/Suggero.mp4},
teaser = {teasers/suggero.png},
abstract = {Modifying a digital sketch may require multiple selections before a particular editing tool can be applied. Especially on large interactive surfaces, such interactions can be fatiguing. Accordingly, we propose a method, called Suggero, to facilitate the selection process of digital ink. Suggero identifies groups of perceptually related drawing objects. These "perceptual groups" are used to suggest possible extensions in response to a person's initial selection. Two studies were conducted. First, a background study investigated participant's expectations of such a selection assistance tool. Then, an empirical study compared the effectiveness of Suggero with an existing manual technique. The results revealed that Suggero required fewer pen interactions and less pen movement, suggesting that Suggero minimizes fatigue during digital sketching.},
keywords = {group selection},
}
@inproceedings{zeidler2013ale,
title = {The Auckland Layout Editor: An Improved {GUI} Layout Specification Process},
author = {Zeidler*, Clemens and Lutteroth, Christof and Stuerzlinger, Wolfgang and Weber, Gerald},
booktitle = {26th Annual Symposium on User Interface Software and Technology},
publisher = {ACM},
series = {UIST '13},
year = {2013},
month = {Oct},
pages = {343-352},
doi = {https://doi.org/10.1145/2501988.2502007},
pdf = {papers/layoutALE.pdf},
video = {videos/ALE.mp4},
teaser = {teasers/layoutALE.png},
abstract = {Layout managers are used to control the placement of widgets in graphical user interfaces (GUIs). Constraint-based layout managers are among the most powerful. However, they are also more complex and their layouts are prone to problems such as over-constrained specifications and widget overlap. This poses challenges for GUI builder tools, which ideally should address these issues automatically. We present a new GUI builder - the Auckland Layout Editor (ALE) - that addresses these challenges by enabling GUI designers to specify constraint-based layouts using simple, mouse-based operations. We give a detailed description of ALE's edit operations, which do not require direct constraint editing. ALE guarantees that all edit operations lead to sound specifications, ensuring solvable and non-overlapping layouts. To achieve that, we present a new algorithm that automatically generates the constraints necessary to keep a layout non-overlapping. Furthermore, we discuss how our innovations can be combined with manual constraint editing in a sound way. Finally, to aid designers in creating layouts with good resize behavior, we propose a novel automatic layout preview. This displays the layout at its minimum and in an enlarged size, which allows visualizing potential resize issues directly. All these features permit GUI developers to focus more on the overall UI design.},
keywords = {GUI, layout, constraints, GUI builder},
}
@inproceedings{zabramski2013easy,
title = {Easy vs Tricky: The Shape Effect in Tracing, Selecting, and Steering With Mouse, Stylus, and Touch},
author = {Zabramski*, Stanislaw and Shrestha*, Suman and Stuerzlinger, Wolfgang},
booktitle = {International Conference on Making Sense of Converging Media},
series = {MindTrek '13},
year = {2013},
month = {Oct},
pages = {99-103},
doi = {https://doi.org/10.1145/2523429.2523444},
pdf = {papers/shapeeffect.pdf},
teaser = {teasers/shapeeffect.png},
abstract = {This short paper is a work-in-progress report on an experimental comparison and evaluation of users' performance in four line-tracing tasks based on two shapes and performed with three input methods (mouse, stylus, and touch-input). The shapes' properties used in the study created the two classes of shapes: easy and hard to replicate. As expected these two classes had different impact on user's performance in each task tested (tracing, lasso selection, steering through narrow and wide tunnel). The results show that participants replicating the shapes using touch-input were the least accurate but were the fastest in comparison to the remaining input methods. The stylus was the least error-prone method and the mouse was the slowest device in drawing tasks (tracing and selection). The differences in error distances between the input methods were less pronounced in steering tasks but timing data showed that mouse was still the slowest one. While the time of replication did not differ between the two shapes tested, the differences between the errors participants made were significant for all tasks and input devices, and patterns of these differences were consistent between the shapes. These results confirm predictions from a previous study and show which shapes' properties can make their replication more difficult. The results can be used to design shapes that are easy to replicate, e.g., in surface-based gestural interaction.},
keywords = {steering, tracing, drawing},
}
@inproceedings{agarwal2013widgetlens,
title = {{WidgetLens}: A System for Adaptive Content Magnification of Widgets},
author = {Agarwal*, Bhavna and Stuerzlinger, Wolfgang},
booktitle = {27th International BCS Human Computer Interaction Conference},
series = {BCS-HCI '13},
year = {2013},
month = {Sep},
articleno = {2},
numpages = {10},
doi = {https://doi.org/10.14236/ewic/HCI2013.4},
pdf = {papers/widgetlens.pdf},
video = {videos/WidgetLensOLD.mp4},
teaser = {teasers/widgetlens.png},
abstract = {On displays with high pixel densities or on mobile devices and due to limitations in current graphical user interface toolkits, content can appear (too) small and be hard to interact with. We present WidgetLens, a novel adaptive widget magnification system, which improves access to and interaction with graphical user interfaces. It is designed for usage of unmodified applications on screens with high pixel densities, remote desktop scenarios, and may also address some situations with visual impairments. It includes a comprehensive set of adaptive magnification lenses for standard widgets, each adjusted to the properties of that type of widget. These lenses enable full interaction with content that appears too small. We also present several extensions.},
keywords = {GUI, widget, magnification, layout},
}
@inproceedings{zabramski2013didwemiss,
title = {Did We Miss Something? Correspondence Analysis of Usability Data},
author = {Zabramski*, Stanislaw and Stuerzlinger, Wolfgang},
booktitle = {Human-Computer Interaction},
publisher = {Springer},
series = {INTERACT '13},
year = {2013},
month = {Sep},
volume = {LNCS 8120},
pages = {272-279},
doi = {https://doi.org/10.1007/978-3-642-40498-6_20},
pdf = {papers/correspondenceanalysisshort.pdf},
teaser = {teasers/correspondenceanalysisshort.png},
abstract = {We have applied a multivariate exploratory technique called Correspondence Analysis (CA) to create and analyze a model of the dataset of experiment results. The dataset originates from a comparative usability study of tracing with the use of mouse, pen, and touch input and contains both categorical and continuous data – i.e. results of questionnaires and task measurements. CA allowed to visually and numerically assess the main variables in the dataset and how they interact with each other. In our study, pen input had the best measured performance and was preferred by the users. Touch input was the least accurate of all input methods tested but it was preferred by users over mouse especially in the conditions lacking of visual feedback of drawing. CA helped to detect that secondary effect even though it cannot be explained by the performance results alone. The importance of the influence of user's previous experience is also noted. We conclude that CA helped to identify all major phenomena known from previous studies but also was sensitive to minor and secondary effects, what makes it a well suited method to quickly evaluate usability data.},
keywords = {steering, drawing, steering},
}
@inproceedings{zeidler2013evaluating,
title = {Evaluating Direct Manipulation Operations for Constraint-based Layout},
author = {Zeidler*, Clemens and Lutteroth, Christof and Stuerzlinger, Wolfgang and Weber, Gerald},
booktitle = {Human-Computer Interaction},
publisher = {Springer},
series = {INTERACT '13},
year = {2013},
month = {Sep},
volume = {LNCS 8118},
pages = {513-529},
doi = {https://doi.org/10.1007/978-3-642-40480-1_35},
pdf = {papers/layoutALEstudy.pdf},
teaser = {teasers/layoutALEstudy.png},
abstract = {Layout managers are used to control the placement of widgets in graphical user interfaces (GUIs). Constraint-based layout managers are more powerful than other ones. However, they are also more complex and their layouts are prone to problems that usually require direct editing of constraints. Today, designers commonly use GUI builders to specify GUIs. The complexities of traditional approaches to constraint-based layouts pose challenges for GUI builders.We evaluate a novel GUI builder, the Auckland Layout Editor (ALE), which addresses these challenges by enabling GUI designers to specify constraint-based layouts via direct manipulation using simple, mouse-based operations. These operations hide the complexity of the constraint-based layout model, while giving designers access to its benefits.In a user evaluation we compared ALE with two other mainstream layout builders, a grid-based and a constraint-based one. The time taken to create realistic sample layouts with our builder was significantly shorter, and most participants preferred ALE's approach. The evaluation demonstrates that good usability for authoring constraint-based layouts is possible.},
keywords = {GUI, layout, constraints},
}
@inproceedings{bruder2013touching,
title = {Touching the Void Revisited: Analyses of Touch Behavior On and Above Tabletop Surfaces},
author = {Bruder*, Gerd and Steinicke, Frank and Stuerzlinger, Wolfgang},
booktitle = {Human-Computer Interaction},
publisher = {Springer},
series = {INTERACT '13},
year = {2013},
month = {Sep},
volume = {LNCS 8117},
pages = {278-296},
doi = {https://doi.org/10.1007/978-3-642-40483-2_19},
pdf = {papers/stereotouchobserv.pdf},
teaser = {teasers/stereotouchobserv.png},
abstract = {Recent developments in touch and display technologies made it possible to integrate touch-sensitive surfaces into stereoscopic three-dimensional (3D) displays. Although this combination provides a compelling user experience, interaction with stereoscopically displayed objects poses some fundamental challenges. If a user aims to select a 3D object, each eye sees a different perspective of the same scene. This results in two distinct projections on the display surface, which raises the question where users would touch in 3D or on the two-dimensional (2D) surface to indicate the selection. In this paper we analyze the relation between the 3D positions of stereoscopically displayed objects and the on- as well as off-surface touch areas. The results show that 2D touch interaction works better close to the screen but also that 3D interaction is more suitable beyond 10cm from the screen. Finally, we discuss implications for the development of future touch-sensitive interfaces with stereoscopic display.},
keywords = {3D pointing, mid-air, touch},
}
@inproceedings{scheurich2013onehanded,
title = {A One-Handed Multi-Touch Method for {3D} Rotations},
author = {Scheurich*, Doug and Stuerzlinger, Wolfgang},
booktitle = {Human-Computer Interaction},
publisher = {Springer},
series = {INTERACT '13},
year = {2013},
month = {Sep},
volume = {LNCS 8117},
pages = {56-69},
doi = {https://doi.org/10.1007/978-3-642-40483-2_4},
pdf = {papers/touchrot.pdf},
video = {videos/touchRot.mp4},
teaser = {teasers/touchrot.png},
abstract = {Rotating 3D objects is a difficult task. We present a new rotation technique based on collision-free "mating" to expedite 3D rotations. It is specifically designed for one-handed interaction on tablets or touchscreens. A user study found that our new technique decreased the time to rotate objects in 3D by more than 60% in situations where objects align. We found similar results when users translated and rotated objects in a 3D scene. Also, angle errors were 35% less with mating. In essence, our new rotation technique improves both the speed and accuracy of common 3D rotation tasks.},
keywords = {3D manipulation, touch},
}
@inproceedings{das2013unified,
title = {Unified Modeling of Proactive Interference and Memorization Effort: A New Mathematical Perspective Within {ACT-R} Theory},
author = {Das*, Arindam and Stuerzlinger, Wolfgang},
booktitle = {Annual Meeting of the Cognitive Science Society},
series = {CogSci '13},
isbn = {978-097683189-1},
year = {2013},
month = {Jul},
pages = {358-363},
url = {https://escholarship.org/uc/item/1p05s7db},
pdf = {papers/proactivememorymodel.pdf},
teaser = {teasers/proactivememorymodel.png},
abstract = {We parsimoniously model the effect of proactive interference and memorization effort in learning stable graphical layouts. We model the visual search cost, i.e. the number of distractors visually encoded while looking for a target item, as a reasonable surrogate of onscreen proactive interference. Further, we show that a novel quantity that we term "effort factor" is an acceptable estimate for comparing the memorization effort across different access cost of onscreen information during the early stages of practice.},
keywords = {text entry, learning},
}
@inproceedings{zabramski2013activity,
title = {Activity or Product? - Drawing and {HCI}},
author = {Zabramski*, Stanislaw and Stuerzlinger, Wolfgang},
booktitle = {International Conference on Multimedia, Interaction, Design and Innovation},
series = {MIDI '13},
year = {2013},
month = {Jun},
pages = {29-38},
doi = {https://doi.org/10.1145/2500342.2500346},
pdf = {papers/drawingactivity.pdf},
teaser = {teasers/drawingactivity.png},
abstract = {Drawing tasks are rarely addressed experimentally by the HCI community, and even then pointing, steering, or gesturing is promoted as an approach towards drawing. We critically analyze the status quo, propose an improved framework for task analysis, and give suggestions on how to perceive drawing task at a meta-level.},
keywords = {drawing, steering},
}
@comment{c, c={leave the "_stuerzlinger" in the ID to enable umlaut-free search!}}
@inproceedings{bruder_stuerzlinger2013totouch,
title = {To Touch or not to Touch? Comparing {2D} Touch and {3D} Mid-Air Interaction on Stereoscopic Tabletop Surfaces},
author = {Bruder*, Gerd and Steinicke, Frank and Stürzlinger, Wolfgang},
booktitle = {Symposium on Spatial User Interaction},
publisher = {ACM},
series = {SUI '13},
year = {2013},
month = {Jul},
pages = {9-16},
doi = {https://doi.org/10.1145/2491367.2491369},
pdf = {papers/2D3Dtouch.pdf},
video = {videos/stereoTouch.mp4},
teaser = {teasers/2D3Dtouch.png},
abstract = {Recent developments in touch and display technologies have laid the groundwork to combine touch-sensitive display systems with stereoscopic three-dimensional (3D) display. Although this combination provides a compelling user experience, interaction with objects stereoscopically displayed in front of the screen poses some fundamental challenges: Traditionally, touch-sensitive surfaces capture only direct contacts such that the user has to penetrate the visually perceived object to touch the 2D surface behind the object. Conversely, recent technologies support capturing finger positions in front of the display, enabling users to interact with intangible objects in mid-air 3D space. In this paper we perform a comparison between such 2D touch and 3D mid-air interactions in a Fitts' Law experiment for objects with varying stereoscopical parallax. The results show that the 2D touch technique is more efficient close to the screen, whereas for targets further away from the screen, 3D selection outperforms 2D touch. Based on the results, we present implications for the design and development of future touch-sensitive interfaces for stereoscopic displays.},
keywords = {3D pointing, touch, mid-air},
}
@inproceedings{teather2013pointing,
title = {Pointing at {3D} Target Projections with One-Eyed and Stereo Cursors},
author = {Teather*, Robert J. and Stuerzlinger, Wolfgang},
booktitle = {{SIGCHI} Conference on Human Factors in Computing Systems},
publisher = {ACM},
series = {CHI '13},
year = {2013},
month = {Apr},
pages = {159-168},
doi = {https://doi.org/10.1145/2470654.2470677},
pdf = {papers/stereocursor.pdf},
video = {videos/3DoneEyedCursor.mp4},
teaser = {teasers/stereocursor.png},
abstract = {We present a study of cursors for selecting 2D-projected 3D targets. We compared a stereo- and mono-rendered (one-eyed) cursor using two mouse-based and two remote pointing techniques in a 3D Fitts' law pointing experiment. The first experiment used targets at fixed depths. Results indicate that one-eyed cursors only improve screen-plane pointing techniques, and that constant target depth does not influence pointing throughput. A second experiment included pointing between targets at varying depths and used only "screen-plane" pointing techniques. Our results suggest that in the absence of stereo cue conflicts, screen-space projections of Fitts' law parameters (target size and distance) yield constant throughput despite target depth differences and produce better models of performance.},
keywords = {3D pointing, stereo},
}
@inproceedings{bruder2013effects,
title = {Effects of Visual Conflicts on {3D} Selection Task Performance in Stereoscopic Display Environments},
author = {Bruder*, Gerd and Steinicke, Frank and Stuerzlinger, Wolfgang},
booktitle = {Symposium on {3D} User Interfaces},
publisher = {IEEE},
series = {3DUI '13},
year = {2013},
month = {Mar},
pages = {115-118},
doi = {https://doi.org/10.1109/3DUI.2013.6550207},
pdf = {papers/offsettouch.pdf},
teaser = {teasers/offsettouch.png},
abstract = {Mid-air direct-touch interaction in stereoscopic display environments poses challenges to the design of 3D user interfaces. Not only is passive haptic feedback usually absent when selecting a virtual object displayed with positive or negative parallax relative to a display surface, but such setups also suffer from inherent visual conflicts, such as vergence/accommodation mismatches and double vision. In particular, if the user tries to select a virtual object with a finger or input device, either the virtual object or the user's finger will appear blurred, resulting in an ambiguity for selections that may significantly impact the user's performance. In this paper we evaluate the effect of visual conflicts for mid-air 3D selection performance within arm's reach on a stereoscopic table with a Fitts' Law experiment. We compare three different techniques with different levels of visual conflicts for selecting a virtual object: real hand, virtual offset cursor, and virtual offset hand. Our results show that the error rate is highest for the real hand condition and less for the virtual offset-based techniques. However, our results indicate that selections with the real hand resulted in the highest effective throughput of all conditions. This suggests that virtual offset-based techniques do not improve overall performance.},
keywords = {3D pointing, stereo},
}
@inproceedings{zabramski2012effect,
title = {The Effect of Shape Properties on Ad-hoc Shape Replication with Mouse, Pen, and Touch Input},
author = {Zabramski*, Stanislaw and Stuerzlinger, Wolfgang},
booktitle = {Proceeding of the 16th International Academic {MindTrek} Conference},
series = {MindTrek '12},
year = {2012},
month = {Oct},
pages = {275-278},
doi = {https://doi.org/10.1145/2393132.2393192},
pdf = {papers/shapereplication.pdf},
teaser = {teasers/shapereplication.png},
abstract = {This paper summarizes observations from four empirical studies focusing on shape replication with three input methods. The aim was to identify and assess how the components of several semi-randomly generated shapes influence how accurately untrained users can replicate each of these components. We found that the pen is the least and touch the most error-prone method when used for drawing. Additionally, the distribution of errors was analyzed. The results may be used to predict which shape properties make shape replication more difficult. Additionally, the results may be used to design shapes that are easy to replicate.},
keywords = {steering, drawing},
}
@inproceedings{liang20123dmanipulation,
title = {User-defined Surface+Motion Gestures for {3D} Manipulation of Objects at a Distance Through a Mobile Device},
author = {Liang, Hai-Ning and Williams*, Cary and Semegen, Myron and Stuerzlinger, Wolfgang and Irani, Pourang},
booktitle = {10th Asia Pacific Conference on Computer Human Unteraction},
series = {APCHI '12},
year = {2012},
month = {Aug},
pages = {299-308},
doi = {https://doi.org/10.1145/2350046.2350098},
pdf = {papers/dualsurface.pdf},
teaser = {teasers/dualsurface.png},
abstract = {One form of input for interacting with large shared surfaces is through mobile devices. These personal devices provide interactive displays as well as numerous sensors to effectuate gestures for input. We examine the possibility of using surface and motion gestures on mobile devices for interacting with 3D objects on large surfaces. If effective use of such devices is possible over large displays, then users can collaborate and carry out complex 3D manipulation tasks, which are not trivial to do. In an attempt to generate design guidelines for this type of interaction, we conducted a guessability study with a dual-surface concept device, which provides users access to information through both its front and back. We elicited a set of end-user surface- and motion-based gestures. Based on our results, we demonstrate reasonably good agreement between gestures for choice of sensory (i.e. tilt), multi-touch and dual-surface input. In this paper we report the results of the guessability study and the design of the gesture-based interface for 3D manipulation.},
keywords = {3D manipulation, touch},
}
@inproceedings{arif2011extending,
title = {Extending Mobile User Ambient Awareness for Nomadic Text Entry},
author = {Arif*, Ahmed Sabbir and Iltisberger+, Benedikt and Stuerzlinger, Wolfgang},
booktitle = {Australian Computer-Human Interaction Conference},
series = {OzCHI '11},
year = {2011},
month = {Nov},
pages = {21-30},
doi = {https://doi.org/10.1145/2071536.2071539},
pdf = {papers/nomadictextentry.pdf},
teaser = {teasers/nomadictextentry.png},
abstract = {Nowadays, we input text not only on stationary devices, but also on handheld devices while walking, driving, or commuting. Text entry on the move, which we term as nomadic text entry, is generally slower. This is partially due to the need for users to move their visual focus from the device to their surroundings for navigational purposes and back. To investigate if better feedback about users' surroundings on the device can improve performance, we present a number of new and existing feedback systems: textual, visual, textual & visual, and textual & visual via translucent keyboard. Experimental comparisons between the conventional and these techniques established that increased ambient awareness for mobile users enhances nomadic text entry performance. Results showed that the textual and the textual & visual via translucent keyboard conditions increased text entry speed by 14% and 11%, respectively, and reduced the error rate by 13% compared to the regular technique. The two methods also significantly reduced the number of collisions with obstacles.},
keywords = {text entry, mobile device, awareness},
}
@inproceedings{patel2011simulation,
title = {Simulation of a Virtual Reality Tracking System},
author = {Patel+, Kapil and Stuerzlinger, Wolfgang},
booktitle = {International Conference on Virtual Environments, Human-Computer Interfaces and Measurement Systems Proceedings},
publisher = {IEEE},
series = {VECIMS '11},
year = {2011},
month = {Sep},
pages = {78-83},
doi = {https://doi.org/10.1109/VECIMS.2011.6053849},
pdf = {papers/hedgesim.pdf},
teaser = {teasers/hedgesim.png},
abstract = {Virtual reality tracking systems are used to detect the position and orientation of a user inside spatially immersive systems. In this paper, we simulate a laser-based tracking system that was originally developed for a six-sided spatially immersive system in environments with one and five walls to evaluate its performance for other installations. As expected, the results show that performance degrades with the number of walls, but they also show that tracking with even one wall is still very feasible.},
keywords = {3D tracking, simulation, virtual reality},
}
@inproceedings{zhao2011comparison,
title = {Comparison of Multiple {3D} Rotation Methods},
author = {Zhao*, Yao Jun and Shuralyov*, Dmitri and Stuerzlinger, Wolfgang},
booktitle = {International Conference on Virtual Environments, Human-Computer Interfaces and Measurement Systems Proceedings},
publisher = {IEEE},
series = {VECIMS '11},
year = {2011},
month = {Sep},
pages = {13-17},
doi = {https://doi.org/10.1109/VECIMS.2011.6053855},
pdf = {papers/comparerotation.pdf},
teaser = {teasers/comparerotation.png},
abstract = {In this paper, we present an experimental comparison of 3D rotation techniques. In all techniques, the third degree of freedom is controlled by the mouse-wheel. The investigated techniques are Bell's Trackball, Shoemake's Arcball and the Two-axis Valuator method. The result from a pilot showed no performance or accuracy difference among these three. However, we did observe minor differences in an experiment with more participants and trials, though these differences were not significant. Also, from questionnaires, we found that most of the users considered the use of mouse wheel helpful for completing the tasks.},
keywords = {3D manipulation},
}
@inproceedings{mcclymont2011comparison,
title = {Comparison of {3D} Navigation Interfaces},
author = {{McClymont}*, Joshua and Shuralyov*, Dmitri and Stuerzlinger, Wolfgang},
booktitle = {International Conference on Virtual Environments, Human-Computer Interfaces and Measurement Systems Proceedings},
publisher = {IEEE},
series = {VECIMS '11},
year = {2011},
month = {Sep},
pages = {7-12},
doi = {https://doi.org/10.1109/VECIMS.2011.6053842},
pdf = {papers/comparenavigation.pdf},
teaser = {teasers/comparenavigation.png},
abstract = {This paper evaluates two different interfaces for navigation in a 3D environment. The first is a `Click-to-Move' style interface that involves using a mouse. The second is a gaming style interface that uses both mouse and keyboard (i.e. the `WASD' keys) for view direction and movement respectively. In the user study, participants were asked to navigate a supermarket environment and collect a specific subset of items. Results revealed significant differences only for some of the sub-measures. Yet, some revealing observations were made regarding user behavior and interaction with the user interface.},
keywords = {3D navigation},
}
@inproceedings{dadgari2011merging,
title = {New Techniques for Merging Text Versions},
author = {Dadgari*, Darius and Stuerzlinger, Wolfgang},
booktitle = {Human-Computer Interaction, Interaction Techniques and Environments},
publisher = {Springer},
series = {HCI International '11},
year = {2011},
month = {Jul},
volume = {LNCS 6762},
pages = {331-340},
doi = {https://doi.org/10.1007/978-3-642-21605-3_37},
pdf = {papers/version4text.pdf},
teaser = {teasers/version4text.png},
abstract = {Versioning helps users to keep track of different sets of edits on a document. Version merging methods enable users to determine which parts of which version they wish to include in the next or final version. We explored several existing and two new methods (highlighting and overlay) in single and multiple window settings. We present the results of our quantitative user studies, which show that the new highlighting and overlay techniques are preferred for version merging tasks. The results suggest that the most useful methods are those which clearly and easily present information that is likely important to the user, while simultaneously hiding less important information. Also, multi window version merging is preferred over single window merging.},
keywords = {difference visualization, merging},
}
@inproceedings{zaman2011effect,
title = {The Effect of Animation Dual-View, Difference Layers and Relative Re-Layout in Hierarchical Diagram Differencing},
author = {Zaman*, Loutfouz and Kalra+, Ashish and Stuerzlinger, Wolfgang},
booktitle = {Graphics Interface},
series = {GI '11},
year = {2011},
month = {May},
pages = {183-190},
url = {https://graphicsinterface.org/proceedings/gi2011/gi2011-24},
pdf = {papers/versiondiff4diagrams.pdf},
teaser = {teasers/versiondiff4diagrams.png},
abstract = {We present a new system for visualizing and merging differences in diagrams that uses animation, dual views, a storyboard, relative re-layout, and layering. We ran two user studies investigating the benefits of the system. The first user study compared pairs of hierarchical diagrams with matching node positions. The results underscore that naïve dual-view visualization is undesirable. On the positive side, participants particularly liked the dual-view with difference layer technique. The second user study focused on diagrams with partially varying node positions and difference visualization and animation. We found evidence that both techniques are beneficial, and that the combination was preferred.},
keywords = {difference visualization, diagram},
}
@inproceedings{ashtiani20112d,
title = {{2D} Similarity Transformations on Multi-Touch Surfaces},
author = {Ashtiani*, Behrooz and Stuerzlinger, Wolfgang},
booktitle = {Graphics Interface},
series = {GI '11},
year = {2011},
month = {May},
pages = {57-64},
url = {https://graphicsinterface.org/proceedings/gi2011/gi2011-8},
pdf = {papers/xnt2d.pdf},
video = {videos/XNT.mp4},
teaser = {teasers/xnt2d.png},
abstract = {We present and comparatively evaluate two new object transformation techniques for multi-touch surfaces. Specifying complete two-dimensional similarity transformations requires a minimum of four degrees of freedom: two for position, one for rotation, and another for scaling. Many existing techniques for object transformation are designed to function with traditional input devices such as mice, single-touch surfaces, or stylus pens. The challenge is to map controls appropriately for each of these devices. A few multi-touch techniques have been proposed in the past, but no comprehensive evaluation has been presented.
XNT is a new three-finger object transformation technique, designed for multi-touch surfaces. It provides a natural interface for two-dimensional manipulation. XNT and several existing techniques were evaluated in a user study. The results show that XNT is superior for all tasks that involve scaling and competitive for tasks that involve only rotation and positioning.},
keywords = {touch, manipulation},
}
@inproceedings{pavlovych2011target,
title = {Target Following Performance in the Presence of Latency, Jitter, and Signal Dropouts},
author = {Pavlovych*, Andriy and Stuerzlinger, Wolfgang},
booktitle = {Graphics Interface},
series = {GI '11},
year = {2011},
month = {May},
pages = {33-40},
url = {https://graphicsinterface.org/proceedings/gi2011/gi2011-5},
pdf = {papers/trackingperformance.pdf},
teaser = {teasers/trackingperformance.png},
abstract = {In this paper we describe how human target following performance changes in the presence of latency, latency variations, and signal dropouts. Many modern games and game systems allow for networked, remote participation. In such networks latency, variations and dropouts are commonly encountered factors.
Our user study reveals that all of the investigated factors decrease tracking performance. The errors increase very quickly for latencies of over 110 ms, for latency jitters above 40 ms, and for dropout rates of more than 10 %. The effects of target velocity on errors are close to linear, and transverse errors are smaller than longitudinal ones. The results can be used to better quantify the effects of different factors on moving objects in interactive scenarios. They also aid the designers in selecting target sizes and velocities, as well as in adjusting smoothing, prediction and compensation algorithms.},
keywords = {target following, jitter},
}
@inproceedings{teather2011pointing,
title = {Pointing at {3D} Targets in a Stereo Head-Tracked Virtual Environment},
author = {Teather*, Robert J. and Stuerzlinger, Wolfgang},
booktitle = {Symposium on {3D} User Interfaces},
publisher = {IEEE},
series = {3DUI '11},
year = {2011},
month = {Mar},
pages = {87-94},
doi = {https://doi.org/10.1109/3DUI.2011.5759222},
pdf = {papers/fishtankfitts.pdf},
teaser = {teasers/fishtankfitts.png},
abstract = {We present three experiments that systematically examine pointing tasks in fish tank VR using the ISO 9241-9 standard. All experiments used a tracked stylus for a both direct touch and ray-based technique. Mouse-based techniques were also studied. Our goal was to investigate means of comparing 2D and 3D pointing techniques. The first experiment used a 2D task constrained to the display surface, allowing direct validation against other 2D studies. The second experiment used targets stereoscopically presented above and parallel to the display, i.e., the same task, but without tactile feedback afforded by the screen. The third experiment used targets varying in all three dimensions. Results of these studies suggest that the conventional 2D formulation of Fitts' law works well for planar pointing tasks even without tactile feedback, and with stereo display. Fully 3D motions using the ray and mouse based techniques are less well modeled.},
keywords = {3D pointing},
}
@inproceedings{dehmeshki2010designeval,
title = {Design and Evaluation of a Perceptual-based Object Group Selection Technique},
author = {Dehmeshki*, Hoda and Stuerzlinger, Wolfgang},
booktitle = {24th BCS Interaction Specialist Group Conference},
series = {BCS-HCI '10},
year = {2010},
month = {Sep},
pages = {365-372},
doi = {https://doi.org/10.14236/ewic/HCI2010.43},
pdf = {papers/persel.pdf},
video = {videos/PerSel.mp4},
teaser = {teasers/persel.png},
abstract = {Selecting groups of objects is a frequent task in graphical user interfaces since it precedes all manipulation operations. Current selection techniques such as lasso become time-consuming and error-prone in dense configurations or when the area covered by targets is large or hard to reach. Perceptual-based selection techniques can considerably improve the selection task when the targets have a perceptual structure, driven by Gestalt principles of proximity and good continuity. However, current techniques use ad hoc grouping algorithms that often lack evidence from perception science. Moreover, they do not allow selecting arbitrary groups (i.e. without a perceptual structure) or modifying a selection. This paper presents a domain-independent perceptual-based selection technique that addresses these issues. It is built upon an established group detection model from perception research and provides intuitive interaction techniques for selecting (whole or partial) groups with curvi-linear or random structures. Our user study shows that this technique not only outperforms rectangle selection and lasso techniques when targets have perceptual structure, but also it is competitive when targets have arbitrary arrangements.},
keywords = {group selection},
}
@inproceedings{dadgari2010novel,
title = {Novel User Interfaces for Diagram Versioning and Differencing},
author = {Dadgari*, Darius and Stuerzlinger, Wolfgang},
booktitle = {24th BCS Interaction Specialist Group Conference},
series = {BCS-HCI '10},
year = {2010},
month = {Sep},
pages = {62-71},
doi = {https://doi.org/10.14236/ewic/HCI2010.10},
pdf = {papers/version4diagram.pdf},
teaser = {teasers/version4diagram.png},
abstract = {Easily available software for diagram creation does not support the comparison of different versions and the merging of such versions. We present new methods and techniques for easy versioning of general two-dimensional diagrams. Multiple novel versioning methods for diagram versioning are compared to each other as well as to previous work in a user study. Participants in a user study preferred the Translucency View and Master Diagram Scenario to the other investigated methods and scenarios.},
keywords = {difference visualization, diagram},
}
@inproceedings{das2010proactive,
title = {Proactive Interference in Location Learning: A New Closed-Form Approximation},
author = {Das*, Arindam and Stuerzlinger, Wolfgang},
booktitle = {International Conference on Cognitive Modeling},
publisher = {Drexel University},
series = {ICCM '10},
year = {2010},
month = {Aug},
pages = {37-42},
url = {https://iccm-conference.neocities.org/2010/proceedings},
pdf = {papers/proactiveinter.pdf},
teaser = {teasers/proactiveinter.png},
abstract = {The ACT-R cognitive theory models forgetting in general with a constant "decay due to passage of time" parameter. However, this is not sufficient to predict learning for frequently executed tasks in dense arrangements of items. Prominent examples are two-dimensional location learning in finding keys on a keyboard or clicking on items on a web page or in a graphical user interface. Our work presents a new way to theoretically model the effect of Proactive Interference, i.e. the effect of the history of events on location learning, through an extension to ACT-R's mathematical model of declarative memory strength. It predicts that each time an item is searched for and found, the item gets "stronger", i.e. easier to remember. However, this strength diminishes not only through the passage of time, but also due to interference from other (non-target) items that have been encountered in the past. We tested the predictions of our new model against empirical measurements from two previous studies that involve simple visual search and selection. The predictions fit the experimental data very well.},
keywords = {learning, text entry},
}
@inproceedings{zaman2010cloning,
title = {A New Interface for Cloning Objects in Drawing Systems},
author = {Zaman*, Loutfouz and Stuerzlinger, Wolfgang},
booktitle = {Graphics Interface},
series = {GI '10},
year = {2010},
month = {May},
pages = {27-34},
url = {https://graphicsinterface.org/proceedings/gi2010/gi2010-5},
pdf = {papers/cloning.pdf},
teaser = {teasers/cloning.png},
abstract = {Cloning objects is a common operation in graphical user interfaces. One example is calendar systems, where users commonly create and modify recurring events, i.e. repeated clones of a single event. Inspired by the calendar paradigm, we introduce a new cloning technique for 2D drawing programs. This technique allows users to clone objects by first selecting them and then dragging them to create clones along the dragged path. Moreover, it allows editing the generated sequences of clones similar to the editing of calendar events. Novel approaches for the generation of clones of clones are also presented.
We compared our new clone creation technique with generic duplication via copy-and-paste, smart duplication, and a dialog driven technique on a standard desktop system. The results show that the new cloning method is always faster than dialogs and smart duplication for most conditions. We also compared our clone editing method against rectangular selection. The results show that our method is better in general. In situations where rectangle selection is effective, our method is still competitive. Participants preferred the new techniques overall, too.},
keywords = {drawing, cloning, copy, paste},
}
@inproceedings{arif2010predicting,
title = {Predicting the Cost of Error Correction in Character-Based Text Entry Technologies},
author = {Arif*, Ahmed Sabbir and Stuerzlinger, Wolfgang},
booktitle = {{SIGCHI} Conference on Human Factors in Computing Systems},
publisher = {ACM},
series = {CHI '10},
year = {2010},
month = {Apr},
pages = {5-14},
doi = {https://doi.org/10.1145/1753326.1753329},
pdf = {papers/errorcostmodel.pdf},
teaser = {teasers/errorcostmodel.png},
abstract = {Researchers have developed many models to predict and understand human performance in text entry. Most of the models are specific to a technology or fail to account for human factors and variations in system parameters, and the relationship between them. Moreover, the process of fixing errors and its effects on text entry performance has not been studied. Here, we first analyze real-life text entry error correction behaviors. We then use our findings to develop a new model to predict the cost of error correction for character-based text entry technologies. We validate our model against quantities derived from the literature, as well as with a user study. Our study shows that the predicted and observed cost of error correction correspond well. At the end, we discuss potential applications of our new model.},
keywords = {text entry, errors},
}
@inproceedings{phillips2009friction,
title = {Can Friction Improve Mouse-Based Text Selection?},
author = {Phillips*, Dustin and Stuerzlinger, Wolfgang},
booktitle = {International Conference Science and Technology for Humanity},
publisher = {IEEE},
series = {TIC-STH '09},
year = {2009},
month = {Sep},
pages = {89-94},
doi = {https://doi.org/10.1109/TIC-STH.2009.5444369},
pdf = {papers/frictionselect.pdf},
teaser = {teasers/frictionselect.png},
abstract = {Text selection via caret positioning is a common task in modern word processing interfaces. It is a difficult task as target size - the distance between characters - is very small. We adapt Baudisch's snap-and-go technique for target acquisition to insert additional motor space at such targets when the mouse is decelerating. This increases the size of the target in motor space, thus potentially reducing the difficulty of text selection tasks. We expand this idea by introducing the concept of context-sensitive friction to improve target acquisition for common targets. We performed two pilot studies and a controlled user study to evaluate the new techniques. Our results indicate that selectively introducing friction into the interface can reduce total task time in common text selection tasks.},
keywords = {selection, snapping, mouse},
}
@inproceedings{arif2009analysis,
title = {Analysis of Text Entry Performance Metrics},
author = {Arif*, Ahmed Sabbir and Stuerzlinger, Wolfgang},
booktitle = {International Conference Science and Technology for Humanity},
publisher = {IEEE},
series = {TIC-STH '09},
year = {2009},
month = {Sep},
pages = {100-105},
doi = {https://doi.org/10.1109/TIC-STH.2009.5444533},
pdf = {papers/textperfmetrics.pdf},
teaser = {teasers/textperfmetrics.png},
abstract = {Researchers have proposed many text entry systems to enable users to perform this frequent task as quickly and precise as possible. Unfortunately the reported data varies widely and it is difficult to extract meaningful average entry speeds and error rates from this body of work. In this article we collect data from well-designed and well-reported experiments for the most important text entry methods, including those for handheld devices. Our survey results show that thumb keyboard is the fastest text entry method after the standard QWERTY keyboard, and that Twiddler is fastest amongst non-QWERTY methods. Moreover, we survey how text entry errors were handled in these studies. Finally, we conducted a user study to detect which effect different error-handling methodologies have on text entry performance metrics. Our study results show that the way human errors are handled has indeed a significant effect on all frequently used error metrics.},
keywords = {text entry, errors},
}
@inproceedings{teather2009evaluating,
title = {Evaluating Visual/Motor Co-location in Fish-Tank Virtual Reality},
author = {Teather*, Robert J. and Allison, Robert and Stuerzlinger, Wolfgang},
booktitle = {International Conference Science and Technology for Humanity},
publisher = {IEEE},
series = {TIC-STH '09},
year = {2009},
month = {Sep},
pages = {624-629},
doi = {https://doi.org/10.1109/TIC-STH.2009.5444423},
pdf = {papers/colocateddisjoint.pdf},
teaser = {teasers/colocateddisjoint.png},
abstract = {Virtual reality systems often co-locate the display and input (motor) spaces. Many input devices, such as the mouse, use indirect input mappings, and are disjoint from the display space. A study of visual/motor co-location was conducted to determine if there is any benefit to working directly "in" a virtual environment. Using a fish-tank VR setup, participants performed a 3D object movement task. This required moving an object from the centre of the environment to target regions, using a tracked pen, in both co-located and disjoint display/input conditions. Results were analyzed in the context of Fitts' Law, which models rapid aimed movements. Ultimately, no significant differences were found between co-located and disjoint conditions. However, when analyzing object movement in specific directions, the co-located condition was somewhat better than the disjoint one. In particular, movement into the scene was faster when the display and input device were co-located rather than disjoint.},
keywords = {3D pointing},
}
@inproceedings{dehmeshki2009icelasso,
title = {ICE-Lasso: An Enhanced Form Of Lasso Selection},
author = {Dehmeshki*, Hoda and Stuerzlinger, Wolfgang},
booktitle = {International Conference Science and Technology for Humanity},
publisher = {IEEE},
series = {TIC-STH '09},
year = {2009},
month = {Sep},
pages = {630-635},
doi = {https://doi.org/10.1109/TIC-STH.2009.5444424},
pdf = {papers/icelasso.pdf},
teaser = {teasers/icelasso.png},
abstract = {Lasso selection tends to be inefficient in many circumstances such as selecting spatially large clusters. ICE-Lasso is a novel technique that infers likely target clusters during an ongoing lasso gesture. It provides efficient gesture-based interaction techniques as shortcuts to select partial, complete, and multiple clusters. Additionally, it is overloaded on the traditional lasso via automatic mode switching. A comparative user study show that ICE-Lasso is significantly more efficient than lasso and also well-liked by users.},
keywords = {group selection},
}
@inproceedings{scoditti2009new,
title = {A New Layout Method for Graphical User Interfaces},
author = {Scoditti*, Adriano and Stuerzlinger, Wolfgang},
booktitle = {International Conference Science and Technology for Humanity},
publisher = {IEEE},
series = {TIC-STH '09},
year = {2009},
month = {Sep},
pages = {642-647},
doi = {https://doi.org/10.1109/TIC-STH.2009.5444422},
pdf = {papers/intuilayout.pdf},
teaser = {teasers/intuilayout.png},
abstract = {The layout mechanisms for many GUI toolkits are hard to understand, the associated tools and API's often difficult to use. This work investigates new, easy-to-understand layout mechanisms and evaluates its implementation. We will analyze the requirements for the definition of layouts of a graphical user interface. Part of the issue is that several aspects need to be considered simultaneously while laying-out a component: the alignment with other components as well as its own behaviour while resizing its container. Moreover, the used tools should isolate the designer/drawer from the implementation details of the framework. We present the details of our new GUI layout system, discuss the choices we made for our new layout algorithm and detail implementation issues. Moreover, we present also the user interface for our new GUI builder system that contains several innovations, such as a preview window to show the effects of layout configuration choices in real-time. We present an evaluation of our new system by attacking the complex GUI layout problem mentioned above.},
keywords = {GUI, layout},
}
@inproceedings{pavlovych2009tradeoff,
title = {The Tradeoff Between Spatial Jitter and Latency in Pointing Tasks},
author = {Pavlovych*, Andriy and Stuerzlinger, Wolfgang},
booktitle = {Symposium on Engineering Interactive Computing Systems},
publisher = {ACM},
series = {EICS '09},
year = {2009},
month = {Jul},
pages = {187-196},
doi = {https://doi.org/10.1145/1570433.1570469},
pdf = {papers/latencyjitter.pdf},
teaser = {teasers/latencyjitter.png},
abstract = {Interactive computing systems frequently use pointing as an input modality, while also supporting other forms of input such as alphanumeric, voice, gesture, and force.We focus on pointing and investigate the effects of input device latency and spatial jitter on 2D pointing speed and accuracy. First, we characterize the latency and jitter of several common input devices. Then we present an experiment, based on ISO 9241-9, where we systematically explore combinations of latency and jitter on a desktop mouse to measure how these factors affect human performance. The results indicate that, while latency has a stronger effect on human performance compared to low amounts of spatial jitter, jitter dramatically increases the error rate, roughly inversely proportional to the target size.The findings can be used in the design of pointing devices for interactive systems, by providing a guideline for choosing parameters of spatial filtering to compensate for jitter, since stronger filtering typically also increases lag. We also describe target sizes at which error rates start to increase notably, as this is relevant for user interfaces where hand tremor or similar factors play a major role.},
keywords = {pointing, jitter},
}
@inproceedings{dehmeshki2009gpsel,
title = {GPSel: A Gestural Perceptual-based Path Selection Technique},
author = {Dehmeshki*, Hoda and Stuerzlinger, Wolfgang},
booktitle = {Smart Graphics},
publisher = {Springer},
series = {SG '09},
year = {2009},
month = {May},
volume = {LNCS 5531},
pages = {243-252},
doi = {https://doi.org/10.1007/978-3-642-02115-2_21},
pdf = {papers/gpsel.pdf},
teaser = {teasers/gpsel.png},
abstract = {This paper introduces a gestural perceptual-based approach to select objects, i.e., nodes and/or edges along paths. Based on known results from perception research, we propose a model to detect perceptually salient paths formed by the Gestalt principles of good continuity and closure. Then we introduce gestural interaction techniques that enable users to select single or multiple perceptual paths, as well as resolving ambiguities in selection. The result of a user study shows that our system outperforms current techniques for path selection.},
keywords = {group selection, gestures},
}
@inproceedings{teather2009effectstracking,
title = {Effects of Tracking Technology, Latency, and Spatial Jitter on Object Movement},
author = {Teather*, Robert J. and Pavlovych*, Andriy and Stuerzlinger, Wolfgang and {MacKenzie}, I. Scott},
booktitle = {Symposium on {3D} User Interfaces},
publisher = {IEEE},
series = {3DUI '09},
year = {2009},
month = {Mar},
pages = {43-50},
doi = {https://doi.org/10.1109/3DUI.2009.4811204},
pdf = {papers/deviceeffects3D.pdf},
teaser = {teasers/deviceeffects3D.png},
abstract = {We investigate the effects of input device latency and spatial jitter on 2D pointing tasks and 3D object movement tasks. First, we characterize jitter and latency in a 3D tracking device and an optical mouse used as a baseline comparison. We then present an experiment based on ISO 9241-9, which measures performance characteristics of pointing devices. We artificially introduce latency and jitter to the mouse and compared the results to the 3D tracker. Results indicate that latency has a much stronger effect on human performance than low amounts of spatial jitter. In a second study, we use a subset of conditions from the first to test latency and jitter on 3D object movement. The results indicate that large, uncharacterized jitter ldquospikesrdquo significantly impact 3D performance.},
keywords = {3D pointing, latency, jitter},
}
@inproceedings{das2008modeling,
title = {Modeling Learning Effects in Mobile Texting},
author = {Das*, Arindam and Stuerzlinger, Wolfgang},
booktitle = {International Conference on Mobile and Ubiquitous Multimedia},
publisher = {ACM},
series = {MUM '08},
year = {2008},
month = {Dec},
pages = {154-161},
doi = {https://doi.org/10.1145/1543137.1543169},
pdf = {papers/learneffectsmodel.pdf},
teaser = {teasers/learneffectsmodel.png},
abstract = {No work on mobile text messaging so far has taken into account the effect of learning on the change in visual exploration behavior as users progress from non-expert to expert level. We discuss within the domain of multi-tap texting on mobile phone and address the process of searching versus selecting a letter on the keypad interface. We develop a simulation model that forecasts the probability of letter location recall by non-expert users and thereby models learning, as the user acquires expertise in recalling, with practice, session after session. We then plugin this probability within a model of visual strategy that combines the effect of different ways visual exploration: non-expert users search for a letter while expert users select a letter. The observed non-expert non-motor time preceding a key press (for a letter) correlates extremely well with the simulation results.},
keywords = {text entry, learning},
}
@inproceedings{teather2008exaggerated,
title = {Exaggerated Head Motions for Game Viewpoint Control},
author = {Teather*, Robert J. and Stuerzlinger, Wolfgang},
booktitle = {Conference on Future Play: Research, Play, Share},
publisher = {ACM},
series = {FuturePlay '08},
year = {2008},
month = {Nov},
pages = {240-243},
doi = {https://doi.org/10.1145/1496984.1497034},
pdf = {papers/headmotion.pdf},
teaser = {teasers/headmotion.png},
abstract = {In this paper, we present an evaluation of exaggerated headcoupled camera motions in a game-like 3D object movement. Three exaggeration levels were compared to determine if the exaggeration was more beneficial than a realistic 1:1 mapping.The results suggest that there is some user preference for this type of exaggeration; however, no significant differences by the experimental conditions were found, other than a learning effect.},
keywords = {3D navigation, head motion},
}
@inproceedings{pavlovych2008screenconfiguration,
title = {Effect of Screen Configuration and Interaction Devices in Shared Display Groupware},
author = {Pavlovych*, Andriy and Stuerzlinger, Wolfgang},
booktitle = {3rd Workshop on Human-centered Computing},
publisher = {ACM},
series = {HCC '08},
year = {2008},
month = {Oct},
pages = {49-56},
doi = {https://doi.org/10.1145/1462027.1462035},
pdf = {papers/multi_effects.pdf},
teaser = {teasers/multi_effects.png},
abstract = {Interactive tabletop and wall surfaces support collaboration and interactivity in novel ways. Apart from keyboards and mice, such systems can also incorporate other input devices, namely laser pointers, marker pens with screen location sensors, or touch-sensitive surfaces. Similarly, instead of a vertically positioned desktop monitor, collaborative setups typically use much larger displays, which are oriented either vertically (wall) or horizontally (tabletop), or combine both kinds of surfaces.In this paper we describe an empirical study that investigates how technical system constraints can affect group performance in high pace collaborative tasks. For this, we compare various input and output modalities in a system that consists of several interactive tabletop and wall surface(s). We observed that the performance of a group of people scaled almost linearly with the number of participants on an almost perfectly parallel task. We also found that mice were significantly faster than laser pointers, but only by 21%. Also, interaction on walls was significantly faster than on the tabletop, by 51%.},
keywords = {groupware, large display interaction, large display system},
}
@inproceedings{dehmeshki2008groupselect,
title = {Intelligent Mouse-based Object Group Selection},
author = {Dehmeshki*, Hoda and Stuerzlinger, Wolfgang},
booktitle = {Smart Graphics 2008},
publisher = {Springer},
series = {SG '08},
year = {2008},
month = {Aug},
volume = {LNCS 5166},
pages = {33-44},
doi = {https://doi.org/10.1007/978-3-540-85412-8_4},
pdf = {papers/gestaltclick1.pdf},
video = {videos/Gestalt.mp4},
teaser = {teasers/gestaltclick1.png},
abstract = {Modern graphical user interfaces support direct manipulation of objects and object groups. Current object group selection techniques such as lasso and rectangle selection can be time-consuming and error-prone. This paper presents a new approach to group selection that exploits the way human perception naturally groups objects, also known as Gestalt grouping. Based on known results from perception research, we present a novel method to group objects via models of the Gestalt principles of proximity and (curvi-)linearity. Then, we introduce several new mouse-based selection techniques that exploit these Gestalt groups. The results of a user study show that our new technique outperforms lasso and rectangle selection for object groups with an implicit structure, such as (curvi-)linear arrangements or clusters.},
keywords = {group selection},
}
@inproceedings{kerr2008context,
title = {Context-Sensitive Cut, Copy, and Paste},
author = {Kerr+, Reid and Stuerzlinger, Wolfgang},
booktitle = {Conference on Computer Science and Software Engineering},
publisher = {ACM},
series = {C3S2E '08},
year = {2008},
month = {May},
pages = {159-166},
doi = {https://doi.org/10.1145/1370256.1370283},
pdf = {papers/csccap.pdf},
teaser = {teasers/csccap.png},
abstract = {Creating and editing source code are tedious and error-prone processes. One important source of errors in editing programs is the failure to correctly adapt a block of copied code to a new context. This occurs because several dependencies to the surrounding code usually need to be adapted for the new context and it is easy to forget one of them. Conversely, this also makes such errors hard to find.This paper presents a new method for identifying some common types of errors in cut, copy and paste operations. The method analyzes the context of the original block of code and tries to match it with the context in the new location. It utilizes a simple, pattern-based model of context, which we found to be well suited to the analysis of relocated blocks of text. Furthermore, we discuss the ability of our technique to detect semantic errors. While semantic errors are relatively difficult to recognize in a static document, our new technique can infer important information from the original context to detect some semantic mismatches. Finally, we present a proof-of-concept implementation and discuss our simple user interface for context-sensitive cut, copy and paste.},
keywords = {copy, paste, editing, context-sensitive},
}
@inproceedings{teather2008assessing,
title = {Assessing the Effects of Orientation and Device on (Constrained) {3D} Movement Techniques},
author = {Teather*, Robert J. and Stuerzlinger, Wolfgang},
booktitle = {Symposium on {3D} User Interfaces},
publisher = {IEEE},
series = {3DUI '08},
year = {2008},
month = {Mar},
pages = {43-50},
doi = {https://doi.org/10.1109/3DUI.2008.4476590},
pdf = {papers/move3deval.pdf},
teaser = {teasers/move3deval.png},
abstract = {We present two studies to assess which physical factors influence 3D object movement tasks with various input devices. Since past research has shown that a mouse with suitable mapping techniques can serve as a good input device for some 3D object movement tasks, we also evaluate which characteristics of the mouse sustain its success. Our first study evaluates the effect of a supporting surface across orientation of input device movement and display orientation. A 3D tracking device was used in all conditions for consistency. The results of this study are inconclusive; no significant differences were found between the factors examined. The results of a second study show that the mouse outperforms the tracker for speed in all instances. The presence of support also improved accuracy when tracker movement is limited to 2D operation. A 3DOF movement mode performed worst overall.},
keywords = {3D positioning, 3D pointing, orientation},
}
@inproceedings{teather2007guidelines,
title = {Guidelines for {3D} Positioning Techniques},
author = {Teather*, Robert J. and Stuerzlinger, Wolfgang},
booktitle = {Conference on Future Play},
publisher = {ACM},
series = {Futureplay '07},
year = {2007},
month = {Nov},
pages = {61-68},
doi = {https://doi.org/10.1145/1328202.1328214},
pdf = {papers/move3dguidelines.pdf},
teaser = {teasers/move3dguidelines.png},
abstract = {In this paper, we present a set of guidelines for designing 3D positioning techniques. These guidelines are intended for developers of object interaction schemes in 3D games, modeling packages, computer aided design systems, and virtual environments. The guidelines promote intuitive object movement techniques in these types of environments.We then present a study comparing 3D positioning techniques based on these guidelines with 2D and 3D/6D devices across VR display technologies. Display technologies such as stereoscopic graphics and head-coupled perspective provide additional depth cues and could affect how a user perceives and thus interacts with a 3D scene - regardless of the input device/technique used. Thus they are examined as well. The results suggest that 2D devices using "smart" movement algorithms can outperform 3D devices.},
keywords = {3D positioning, orientation},
}
@inproceedings{das2007cognitive,
title = {A Cognitive Simulation Model for Novice Text Entry on Cell Phone Keypads},
author = {Das*, Arindam and Stuerzlinger, Wolfgang},
booktitle = {14th European Conference on Cognitive Ergonomics: Invent! Explore!},
publisher = {ACM},
series = {ECCE '07},
year = {2007},
month = {Aug},
pages = {141-147},
doi = {https://doi.org/10.1145/1362550.1362579},
pdf = {papers/novicecogmodel.pdf},
teaser = {teasers/novicecogmodel.png},
abstract = {Motivation - To create a cognitive simulation model that predicts text entry performance and learning on cell phone keypads by novice users. Research approach - A programmable cognitive architecture, ACT-R, is used to execute the simulation model. Part of the simulation result is compared with the result of a previous user study. Findings/Design - The proposed model is an a priori model (not tuned to any real user data) that predicts the amount of time spent in finding a key on the keypad and pressing it repeatedly. The predicted amount of time in finding a key differs by 6% and the time between two repeated key-presses of the same key by 27% compared to the results of a previous user study. The model also captures the learning of keypad layout by novice users. Memorization of keypad layout is simulated using task repetition. Research limitations/Implications - This research has several limitations described towards the end of this paper. An important one among them is that the work does not model the impact of visual distracters in the field of view (frontal surface of the handset) on user performance. Originality/Value - This is the first cognitive simulation model of novice user's text entry performance and learning on cell phone keypads. Take away message - This work introduces an a priori congnitive model of text entry by novice users. This forms a basis for systematic exploration of keypad designs for cell phones in shorter time and lower cost.},
keywords = {text entry, learning},
}
@inproceedings{tumanov2007variabilityaware,
title = {Variability-Aware Latency Amelioration in Distributed Environments},
author = {Tumanov*, Alexey and Allison, Robert and Stuerzlinger, Wolfgang},
booktitle = {Virtual Reality Conference},
publisher = {IEEE},
series = {VR '07},
year = {2007},
month = {Mar},
pages = {123-130},
doi = {https://doi.org/10.1109/VR.2007.352472},
pdf = {papers/latencypredict.pdf},
teaser = {teasers/latencypredict.png},
abstract = {Application designers of collaborative distributed virtual environments must account for the influence of the network connection and its detrimental effects on user performance. Based upon analysis and classification of existing latency compensation techniques, this paper introduces a novel approach to latency amelioration in the form of a two-tier predictor-estimator framework. The technique is variability-aware due to its proactive sender-side prediction of a pose a variable time into the future. The prediction interval required is estimated based on current and past network delay characteristics. This latency estimate is subsequently used by a Kalman filter-based predictor to replace the measurement event with a predicted pose that matches the event's arrival time at the receiving workstation. The compensation technique was evaluated in a simulation through an offline playback of real head motion data and network delay traces collected under a variety of real network conditions. The experimental results indicate that the variability-aware approach significantly outperforms a state-of-the-art one, which assumes a constant system delay},
keywords = {latency, jitter, virtual reality},
}
@inproceedings{stuerzlinger2006uifacades,
title = {User Interface Façades: Towards Fully Adaptable User Interfaces},
author = {Stuerzlinger, Wolfgang and Chapuis, Olivier and Phillips*, Dustin and Roussel, Nicolas},
booktitle = {19th Symposium on User Interface Software and Technology},
publisher = {ACM},
series = {UIST '06},
year = {2006},
month = {Oct},
pages = {309-318},
doi = {https://doi.org/10.1145/1166253.1166301},
url = {https://ws.iat.sfu.ca/facades},
pdf = {papers/uifacades.pdf},
video = {videos/uifacades.mp4},
teaser = {teasers/uifacades.png},
abstract = {User interfaces are becoming more and more complex. Adaptable and adaptive interfaces have been proposed to address this issue and previous studies have shown that users prefer interfaces that they can adapt to self-adjusting ones. However, most existing systems provide users with little support for adapting their interfaces. Interface customization techniques are still very primitive and usually constricted to particular applications. In this paper, we present User Interface Façades, a system that provides users with simple ways to adapt, reconfigure, and re-combine existing graphical interfaces, through the use of direct manipulation techniques. The paper describes the user's view of the system, provides some technical details, and presents several examples to illustrate its potential.},
keywords = {facades, GUI, layout, copy, paste},
}
@inproceedings{oh2006sesame,
title = {{SESAME}: Towards Better {3D} Conceptual Design Systems},
author = {Oh*, Ji-Young and Stuerzlinger, Wolfgang and Danahy, John},
booktitle = {6th Conference on Designing Interactive Systems},
publisher = {ACM},
series = {DIS '06},
year = {2006},
month = {Jun},
pages = {80-89},
doi = {https://doi.org/10.1145/1142405.1142419},
pdf = {papers/sesameui.pdf},
video = {videos/sesame.m4v},
teaser = {teasers/sesameui.png},
abstract = {Conceptual design dominates the early stages of most creative design processes. During these stages, the designer makes important decisions about the parameters of a model that are aimed at satisfying a set of design criteria. To do this, the designer produces many sketches of various possible solutions. Meanwhile, computer-aided design (CAD) systems are becoming the dominant visual medium used in design practice. However, these tools evolved as documentation production tools and do not support conceptual thinking. This paper presents a list of guidelines for computer support for conceptual design activities on 3D scenes and presents SESAME (Sketch, Extrude, Sculpt, and Manipulate Easily), a system based on these guidelines. Finally, we present a user study comparing SESAME with a conventional CAD package to demonstrate the effectiveness of SESAME.},
keywords = {design, snapping, 3D positioning, 3D manipulation, 3D modeling},
}
@inproceedings{baradaran2006comparison,
title = {A Comparison of Real and Virtual {3D} Construction Tools with Novice Users},
author = {Baradaran+, Hooman and Stuerzlinger, Wolfgang},
booktitle = {International Conference on Computer Graphics & Virtual Reality},
series = {CGVR '06},
isbn = {978-1-93241585-8},
year = {2006},
month = {Jun},
pages = {10-14},
url = {https://dblp.org/db/conf/cgvr/cgvr2006},
pdf = {papers/hapticslego.pdf},
teaser = {teasers/hapticslego.png},
abstract = {In this paper, we present the results of a comparative evaluation of a "virtual Lego" system against real Lego bricks with novice users. The virtual Lego system was designed to emulate the behavior of real Lego bricks as close as possible, while still allowing for efficient operation. We implemented two different user interfaces for the virtual Lego system, namely controlling it with a 2D mouse, based on an efficient mapping from 2D to 3D, as well as with a 3D haptics device, which provides haptic feedback to the user. The results of our study show that real Lego is still significantly faster for first-time users (i.e. users with minimal training). A more surprising result is that the 2D mouse condition and the 3D haptics condition did not differ significantly - even though the 3D haptics condition provides much richer feedback. We discuss the results and speculate about the underlying reasons.},
keywords = {haptics, 3D positioning, 3D manipulation, design, lego},
}
@inproceedings{parilov2006multiview,
title = {Multi-view Visibility Orderings for Real-Time Point-Sampled Rendering},
author = {Parilov*, Sergey and Stuerzlinger, Wolfgang},
booktitle = {International Conference on Computer Graphics & Virtual Reality},
series = {CGVR '06},
isbn = {978-1-93241585-8},
year = {2006},
month = {Jun},
pages = {125-131},
url = {https://dblp.org/db/conf/cgvr/cgvr2006},
pdf = {papers/fastibr.pdf},
video = {videos/ibr_pointsampled.mp4},
teaser = {teasers/fastibr.png},
abstract = {Occlusion-compatible traversals and z-buffering are often regarded as the only choices for resolving visibility in the image- and point-based rendering community. These algorithms do either per-frame or per-pixel computations. This paper first discusses visibility orderings for point samples in general and then discusses orderings that are valid for multiple views. Then we present a novel, highly efficient, visibility algorithm for point-sampled models that has much smaller per-frame cost than previous approaches. We also discuss a high-performance, cache friendly implementation of this visibility method and present results. Finally, we speculate on possible hardware implementations.},
keywords = {rendering, real-time, visibility},
}
@inproceedings{boehl2006areashadow,
title = {Real-time Computation Of Area Shadows - A Geometrical Algorithm},
author = {Boehl*, Michael and Stuerzlinger, Wolfgang},
booktitle = {International Conference on Computer Graphics & Virtual Reality},
series = {CGVR '06},
isbn = {978-1-93241585-8},
year = {2006},
month = {Jun},
pages = {118-124},
url = {https://dblp.org/db/conf/cgvr/cgvr2006},
pdf = {papers/penumbras.pdf},
teaser = {teasers/penumbras.png},
abstract = {The computation of soft shadows created by area light sources is a well-known problem in computer graphics. Due to the complexity of the problem, soft shadows commonly are generated only for images that are rendered in an off-line process. In interactive virtual environments, where images have to be computed in real time, soft shadows are mostly replaced by hard shadows as this takes much less time to compute.
This paper presents an algorithm that uses a geometrical method to generate a triangulated approximation of the soft shadow cast by a polygonal object very quickly. The algorithm can simulate effects such as the varying width of penumbras depending on distance to the light and can be extended to support non-convex light sources as well. We mention the artifacts arising from triangulation and give discuss how to alleviate such problems.},
keywords = {rendering, real-time},
}
@inproceedings{oh2006groupselect,
title = {Group Selection Techniques for Efficient {3D} Modeling},
author = {Oh*, Ji-Young and Stuerzlinger, Wolfgang and Dadgari*, Darius},
booktitle = {Symposium on {3D} User Interfaces},
publisher = {IEEE},
series = {3DUI '06},
year = {2006},
month = {Mar},
pages = {95-102},
doi = {https://doi.org/10.1109/VR.2006.66},
pdf = {papers/sesamegrouping.pdf},
video = {videos/sesame_multiclick.m4v},
teaser = {teasers/sesamegrouping.png},
abstract = {Object selection and manipulation (e.g. moving, rotating) are the most basic tasks in 3D scene construction. While most research on selection and manipulation techniques targets single objects, we examine the concept of group selection in this paper. Group selection is often given lesser importance than single object selection, yet is vital in providing users with a way to modify larger scenes with objects which are repetitive, sequential, or otherwise inherently understood as 'belonging together' by a user. We observed users manipulating objects in 3D scenes, and while doing so, they clearly expected that objects would be grouped based on their gravitational relationship. That is, all objects that are supported by some selected object will follow the motion of the selected object when manipulated. In this paper, we present a system that efficiently supports the manipulation of groups of objects via a gravitational hierarchy. As this hierarchy is derived with a collision detector, the new grouping techniques do not require semantic or user specified information to work. The results of the evaluation show that using the gravitational hierarchy improves scene rearrangement significantly compared to conventional non-hierarchical methods. Finally, we discuss lessons learned from this study and make some suggestions on how the results can be incorporated into other systems.},
keywords = {group selection, 3D positioning, 3D modeling, 3D manipulation},
}
@inproceedings{pavlovych2005hdrproject,
title = {A High-Dynamic Range Projection System},
author = {Pavlovych*, Andriy and Stuerzlinger, Wolfgang},
booktitle = {Photonic Applications in Biosensing and Imaging},
publisher = {SPIE},
series = {Photonics North '05},
year = {2005},
month = {Sep},
volume = {SPIE 5969},
numpages = {8},
doi = {https://doi.org/10.1117/12.629117},
url = {https://ws.iat.sfu.ca/hdrproj.html},
pdf = {papers/hdrproject.pdf},
teaser = {teasers/hdrproject.png},
abstract = {The dynamic range in many real-world environments surpasses the capabilities of traditional display technologies by several orders of magnitude. Recently, a novel display capable of displaying images with a dynamic range much closer to real world situations has been demonstrated. This was achieved through a spatially modulated backlight behind an LCD panel. Combined with the modulating power of the LCD panel itself, this enabled the display of much higher contrast compared to an LCD panel with a spatially uniform backlight.
In this paper, we describe a further development of the technology, namely a high dynamic range projection system. This makes such display systems more widely applicable as any surface can be used for the display of high dynamic range images.
Our new system is designed as an external attachment to a regular DLP-based projector, which allows the use of unmodified projectors. It works by adapting the projected image via a set of lenses to form a small image. This small image is then modulated via an LCD panel and the result is projected via another lens system onto a larger screen, as in traditional projection scenarios. The double modulation, by the projector and the LCD panel together, creates a high dynamic range image and an ANSI contrast of over 700:1.
Finally, we discuss the advantages and disadvantages of our design relative to other high and low dynamic range display technologies and its potential applications.},
keywords = {high dynamic range, projector},
}
@inproceedings{oh2005comparing,
title = {Comparing {SESAME} and Sketching on Paper for Conceptual {3D} Design},
author = {Oh*, Ji-Young and Stuerzlinger, Wolfgang and Danahy, John},
booktitle = {Sketch-Based Interfaces and Modeling},
publisher = {Eurographics},
series = {SBM '05},
year = {2005},
month = {Aug},
pages = {81-88},
doi = {https://doi.org/10.2312/SBM/SBM05/081-087},
pdf = {papers/sesamecompare.pdf},
teaser = {teasers/sesamecompare.png},
abstract = {In the early stages of design, several concepts are usually generated to explore the possibilities. This paper investigates how well a computer-based system can support design thinking. SESAME is a novel 3D design system that aims to support creativity during the explorative phase of the design process. We report an evaluation comparing SESAME to paper sketching for early design exploration in an urban design scenario. Through the user evaluation, we illustrate how important it is to support essential properties of traditional sketching, such as rapid creation/modification, emergent shapes, and tolerance to ambiguity. Additionally, we show that a 3D system can indeed facilitate form exploration at the early stages of design thinking.},
keywords = {3D modeling, 3D manipulation, 3D sketching, drawing},
footnote = {SESAME was a co-evolution with SketchUp, https://www.sketchup.com},
}
@inproceedings{pavlovych2005analysis,
title = {An Analysis of Novice Text Entry Performance on Large Interactive Wall Surfaces},
author = {Pavlovych*, Andriy and Stuerzlinger, Wolfgang},
booktitle = {Human Computer International, CD},
publisher = {Lawrence Erlbaum},
series = {HCI International '05},
isbn = {978-080585807-5},
year = {2005},
month = {Jul},
numpages = {10},
url = {http://www.hci.international/index.php?module=conference&CF_op=view&CF_id=4},
pdf = {papers/whiteboardtext.pdf},
teaser = {teasers/whiteboardtext.png},
abstract = {This paper presents a comparative study of several soft keyboard layouts for text entry on interactive whiteboards. We compare the traditional QWERTY with several other layouts, including theoretically optimal ones, such as FITALY. In contrast to previous work, we concentrate on novice performance, as few people ever gain expert status on whiteboards.
The results show that for a population of regular keyboard users, QWERTY is the best alternative and even the slightest deviations from that arrangement degrade the performance significantly. Based on the experiments, we present an in-depth analysis of the behaviour of users for several layouts from a cognitive viewpoint.},
keywords = {text entry, large display interaction, novice},
}
@inproceedings{stachniak2005terrain,
title = {An Algorithm for Automated Fractal Terrain Deformation},
author = {Stachniak*, Szymon and Stuerzlinger, Wolfgang},
booktitle = {Computer Graphics and Artificial Intelligence},
series = {3IA '05},
commented-isbn = {978-291425607-0},
year = {2005},
month = {May},
pages = {64-76},
url = {http://www.msi.unilim.fr/3IA},
pdf = {papers/fractaldeform.pdf},
video = {videos/fractal_deform.mp4},
teaser = {teasers/fractaldeform.png},
abstract = {Fractal terrains provide an easy way to generate realistic landscapes. There are several methods to generate fractal terrains, but none of those algorithms allow the user much flexibility in controlling the shape or properties of the final outcome. A few methods to modify fractal terrains have been previously proposed, both algorithm-based as well as by hand editing, but none of these provide a general solution.
In this work, we present a new algorithm for fractal terrain deformation. We present a general solution that can be applied to a wide variety of deformations. Our approach employs stochastic local search to identify a sequence of local modifications, which deform the fractal terrain to conform to a set of specified constraints. The presented results show that the new method can incorporate multiple constraints simultaneously, while still preserving the natural look of the fractal terrain.},
keywords = {fractal, terrain, rendering, ray tracing},
}
@inproceedings{oh2005moving,
title = {Moving Objects with {2D} Input Devices in CAD Systems and Desktop Virtual Environments},
author = {Oh*, Ji-Young and Stuerzlinger, Wolfgang},
booktitle = {Graphics Interface},
series = {GI '05},
year = {2005},
month = {May},
pages = {195-202},
url = {https://graphicsinterface.org/proceedings/gi2005/gi2005-24},
pdf = {papers/move3d.pdf},
video = {videos/sesameMove3D2005.mp4},
teaser = {teasers/move3d.png},
abstract = {Part assembly and scene layout are basic tasks in 3D design in Desktop Virtual Environment (DVE) systems as well as Computer Aided Design (CAD) systems. 2D input devices such as a mouse or a stylus are still the most common input devices for such systems. With such devices, a notably difficult problem is to provide an efficient and predictable object motion in 3D based on their 2D motion. This paper presents a new technique to move objects in CAD/DVE using 2D input devices.
The technique presented in this paper utilizes the fact that people easily recognize the depth-order of shapes based on occlusions. In the presented technique, the object position follows the mouse cursor position, while the object slides on various surfaces in the scene. In contrast to existing techniques, the movement surface and the relative object position is determined using the whole area of overlap of the moving object with the static scene. The resulting object movement is visually smooth and predictable, while avoiding undesirable collisions. The proposed technique makes use of the framebuffer for efficiency and runs in real-time. Finally, the evaluation of the new technique with a user study shows that it compares very favorably to conventional techniques.},
keywords = {3D positioning, 3D modeling, 3D manipulation, sliding},
}
@inproceedings{vorozcovs2005hedgehog,
title = {The Hedgehog: A Novel Optical Tracking Method for Spatially Immersive Displays},
author = {Vorozcovs*, Andrew and Hogue*, Andrew and Stuerzlinger, Wolfgang},
booktitle = {Virtual Reality},
publisher = {IEEE},
series = {VR '05},
year = {2005},
month = {Mar},
pages = {83-89},
doi = {https://doi.org/10.1109/VR.2005.1492757},
pdf = {papers/hedgehog.pdf},
teaser = {teasers/hedgehog.png},
abstract = {Existing commercial technologies do not adequately meet the requirements for tracking in fully-enclosed VR displays. We present the Hedgehog, which overcomes several limitations imposed by existing sensors and tracking technology. The tracking system robustly and reliably estimates the 6DOF pose of the device with high accuracy and a reasonable update rate. The system is composed of several cameras viewing the display walls and an arrangement of laser diodes secured to the user. The light emitted from the lasers projects onto the display walls and the 2D centroids of the projections are tracked to estimate the 6DOF pose of the device. The system is able to handle ambiguous laser projection configurations, static and dynamic occlusions of the lasers, and incorporates an intelligent laser activation control mechanism that determines which lasers are most likely to improve the pose estimate. The Hedgehog is also capable of performing auto-calibration of the necessary camera parameters through the use of the SCAAT algorithm. A preliminary evaluation reveals that the system has an angular resolution of 0.01 degrees RMS and a position resolution of 0.2 mm RMS.},
keywords = {3D tracking},
}
@inproceedings{pavlovych2004laser,
title = {Laser Pointers as Interaction Devices for Collaborative Pervasive Computing},
author = {Pavlovych*, Andriy and Stuerzlinger, Wolfgang},
booktitle = {Advances in Pervasive Computing},
publisher = {OCG},
series = {Pervasive '04},
isbn = {978-385403176-5},
year = {2004},
month = {Apr},
pages = {315-320},
url = {http://www.pervasive2004.org},
pdf = {papers/lasers_improved.pdf},
teaser = {teasers/lasers_improved.png},
abstract = {We present a system that supports collaborative interactions for arbitrary environments. The system uses laser pointers as interaction devices and employs a video camera to detect where each laser pointer is pointing. Time-division multiplexing together with a wireless link affords discrimination between laser pointer dots belonging to different pointers. Safety issues with laser pointers are addressed with a new technique. We also discuss how new users can be dynamically added and removed from the system.},
keywords = {pointing, collaboration, laser},
}
@inproceedings{pavlovych2004model,
title = {Model for non-Expert Text Entry Speed on 12-Button Phone Keypads},
author = {Pavlovych*, Andriy and Stuerzlinger, Wolfgang},
booktitle = {{SIGCHI} Conference on Human Factors in Computing Systems},
publisher = {ACM},
series = {CHI '04},
year = {2004},
month = {Apr},
pages = {351-358},
doi = {https://doi.org/10.1145/985692.985737},
pdf = {papers/novicemodel.pdf},
teaser = {teasers/novicemodel.png},
abstract = {In this paper we present a new model for predicting text entry speed on a 12-button mobile phone keypad. The proposed model can predict the performance of novice users. Like other models for text entry, the proposed model includes a movement component based on Fitts' law and a linguistic component based on letter digraph probabilities. It also adds cognitive delay times before key presses and takes into account the fact that Fitts' law cannot model multiple presses of the same key accurately. Finally, we compare the prediction of our model to previously published experimental results, demonstrate that it fits observed results for novices very well, and list some observations about learning.},
keywords = {text entry, mode, novice},
}
@inproceedings{oh2003intelligent,
title = {Intelligent Manipulation Techniques for Conceptual {3D} Design},
author = {Oh*, Ji-Young and Stuerzlinger, Wolfgang},
booktitle = {Human-Computer Interaction},
publisher = {IFIP},
series = {INTERACT '03},
isbn = {978-158603363-7},
year = {2003},
month = {Sep},
pages = {319-326},
url = {https://www.interaction-design.org/literature/conference/proceedings-of-ifip-interact03-human-computer-interaction},
pdf = {papers/legomanip.pdf},
video = {videos/lego.m4v},
teaser = {teasers/legomanip.png},
abstract = {One of the main operations in conceptual 3D design is the rearrangement of single and composite objects. This paper presents a new conceptual 3D design system that affords easy manipulation of composite objects. We discuss several alternative manipulation techniques to separate complex parts off an existing model. Then, we present a new way to move such parts in a 3D scene, as well as an algorithm to place parts at arbitrary locations. Finally, we present and discuss the results of a user study of these manipulation techniques.},
keywords = {3D modeling, 3D positioning, 3D manipulation, lego},
}
@inproceedings{pavlovych2003lesstap,
title = {Less-Tap: A Fast and Easy-to-learn Text Input Technique for Phones},
author = {Pavlovych*, Andriy and Stuerzlinger, Wolfgang},
booktitle = {Graphics Interface},
series = {GI '03},
year = {2003},
month = {Jun},
pages = {97-104},
doi = {https://doi.org/10.20380/GI2003.12},
pdf = {papers/lesstap.pdf},
teaser = {teasers/lesstap.png},
abstract = {A new technique to enter text using a mobile phone keypad, Less-Tap, is described. The traditional touch-tone phone keypad is ambiguous for text input because each button encodes 3 or 4 letters. As in Multitap, our method requires the user to press buttons repeatedly to get a required letter. However, in Less-Tap, letters are rearranged within each button according to their frequency. This way, the most common letters require only one key press.
Unlike dictionary based methods, Less-Tap facilitates the entry of arbitrary words. Unlike LetterWise and T9, Less-Tap allows entering text without having to visually verify the result, after some initial training. For English, Less-Tap requires an average of 1.5266 keystrokes per character (vs. 2.0342 in Multitap).
We conducted a user study to compare Less-Tap against Multitap. Each participant had three 20-minute sessions with each technique. The mean entry speed was 9.5% higher with the new technique.},
keywords = {text entry, mobile device},
}
@inproceedings{oh2002laser,
title = {Laser Pointers as Collaborative Pointing Devices},
author = {Oh*, Ji-Young and Stuerzlinger, Wolfgang},
booktitle = {Graphics Interface},
series = {GI '02},
year = {2002},
month = {May},
pages = {141-149},
doi = {https://doi.org/10.20380/GI2002.17},
pdf = {papers/multi_laser.pdf},
video = {videos/laser_multi.mp4},
teaser = {teasers/multi_laser.png},
abstract = {Single Display Groupware (SDG) is a research area that focuses on providing collaborative computing environments. Traditionally, most hardware platforms for SDG support only one person interacting at any given time, which limits collaboration. In this paper, we present laser pointers as input devices that can provide concurrent input streams ideally required to the SDG environment.
First, we discuss several issues related to utilization of laser pointers and present the new concept of computer controlled laser pointers. Then we briefly present a performance evaluation of laser pointers as input devices and a baseline comparison with the mouse according to the ISO 9241-9 standard.
Finally, we describe a new system that uses multiple computer controlled laser pointers as interaction devices for one or more displays. Several alternatives for distinguishing between different laser pointers are presented, and an implementation of one of them is demonstrated with SDG applications.},
keywords = {laser, pointing, collaboration},
}
@inproceedings{stuerzlinger2002efficient,
title = {Efficient Manipulation of Object Groups in Virtual Environments},
author = {Stuerzlinger, Wolfgang and Smith*, Graham},
booktitle = {Virtual Reality},
publisher = {IEEE},
series = {VR '02},
year = {2002},
month = {Mar},
pages = {251-258},
doi = {https://doi.org/10.1109/VR.2002.996529},
pdf = {papers/mive_vr2002.pdf},
video = {videos/mive_duals.mp4},
teaser = {teasers/mive_vr2002.png},
abstract = {We describe simple techniques for object group manipulation, an important operation in user interaction with a virtual environment. All presented manipulation techniques exploit constraints to simplify user interaction. The techniques are based on how humans perceive groups and afford direct manipulation of such groups. Furthermore, we introduce two new intuitive ways to create a whole group of objects: drag-add and random drag-add. Finally, we present an evaluation of the presented techniques.},
keywords = {group selection, 3D positioning, 3D manipulation},
}
@inproceedings{robinson2002ivy,
title = {IVY: The Immersive Visual Environment at York},
author = {Robinson, Matt and Laurence, Jeff R. and Zacher, James and Hogue*, Andrew and Allison, Robert and Harris, Laurence and Jenkin, Michael and Stuerzlinger, Wolfgang},
booktitle = {International Immersive Projection Technology Symposium},
series = {IPT '02},
year = {2002},
month = {Mar},
numpages = {6},
url = {http://vr.iao.fhg.de/ipt-egve},
pdf = {papers/ivy_ipt2002.pdf},
teaser = {teasers/ivy_ipt2002.png},
abstract = {Given the limitations of head mounted display systems, there has been significant interest in the development of large-scale virtual environments such as video walls, immersive project displays, and similar devices. Although these devices do provide a wide-field visual display, very few of these devices are completely immersive as the user may view the visual world or they may be tethered to the real world via tracking systems. In this paper we present the motivation and design of IVY: The Immersive Visual environment currently under construction at Y ork University (IVY).},
keywords = {cave, immersive display system, 3D tracking},
}
@inproceedings{robinson2001growing,
title = {Growing IVY: Building the Immersive Visual Environment at York},
author = {Robinson, Matt and Laurence, Jeff R. and Zacher, James and Hogue*, Andrew and Allison, Robert and Harris, Laurence and Jenkin, Michael and Stuerzlinger, Wolfgang},
booktitle = {11th International Conference on Artificial Reality and Tele-existence},
series = {ICAT '01},
year = {2001},
month = {Dec},
pages = {85-89},
url = {http://icat.vrsj.org/ICAT2001},
pdf = {papers/ivy_icat2001.pdf},
teaser = {teasers/ivy_icat2001.png},
abstract = {When we move about within our environment, we are presented with a range of cues to our motion. Virtual reality systems attempt to simulate these various sensory cues. IVY – the Immersive Visual environment at York – is a virtual environment being constructed at York University to investigate aspects of human perception and to examine the relative importance of various visual and non-visual cues to the generation of an effective virtual environment. This paper describes the movation behind the design of IVY, and describes the design of the essential hardware and software components.},
keywords = {cave, immersive display system, 3D tracking},
}
@inproceedings{smith2001integration,
title = {Integration of Constraints into a VR Environment},
author = {Smith*, Graham and Stuerzlinger, Wolfgang},
booktitle = {Virtual Reality International Conference, Laval Virtual},
series = {VRIC '01},
isbn = {978-295157300-0},
year = {2001},
month = {Jun},
pages = {103-110},
pdf = {papers/mive_vric2001.pdf},
video = {videos/mive_creation.mp4},
teaser = {teasers/mive_vric2001.png},
abstract = {Interactive Virtual Reality applications are in general complex and non-intuitive. One fundamental problem is that manipulation of 3D objects is very difficult for non-experienced users. We describe a constraint based 3D scene construction system that exploits human intuitions to restrict object placement and interactions. In particular, we focus on the constraints themselves by describing how they are defined, and how they are used within a scene. Several different types of constraints are discussed, including virtual constraints, which decouple the constraint areas from the geometry of an object, and negative constraints, which restrict object placements within certain volumes of space. Furthermore, we discuss techniques that can be used to automatically generate constraints for most geometric objects, which makes incorporating new objects into the system much easier. Finally, we argue that the presented constraint techniques can be incorporated into existing Virtual Reality systems to make interactions easier.},
keywords = {3D manipulation, 3D positioning, constraints},
}
@inproceedings{smith2001scenedevices,
title = {{3D} Scene Manipulation with {2D} Devices and Constraints},
author = {Smith*, Graham and Salzman*, Tim and Stuerzlinger, Wolfgang},
booktitle = {Graphics Interface},
series = {GI '01},
year = {2001},
month = {Jun},
pages = {135-142},
doi = {https://doi.org/10.20380/GI2001.16},
pdf = {papers/mive_gi2001.pdf},
video = {videos/mive_resize.mp4},
teaser = {teasers/mive_gi2001.png},
abstract = {Content creation for computer graphics applications is a laborious process that requires skilled personnel. One fundamental problem is that manipulation of 3D objects with 2D user interfaces is very difficult for non-experienced users.
In this paper, we introduce a new system that uses constraints to restrict object motion in a 3D scene, making interaction much simpler and more intuitive. We compare three different 3D scene manipulation techniques based on a 2D user interface. We show that the presented techniques are significantly more efficient than commonly used solutions. To our knowledge, this is the first evaluation of 3D manipulation techniques with 2D devices and constraints.},
keywords = {3D manipulation, 3D positioning, constraints},
}
@inproceedings{smith2001sceneconstraints,
title = {{3D} Scene Manipulation with Constraints},
author = {Smith*, Graham and Salzman*, Tim and Stuerzlinger, Wolfgang},
booktitle = {Virtual and Augmented Architecture},
series = {VAA '01},
year = {2001},
month = {Jun},
pages = {35-46},
doi = {https://doi.org/10.1007/978-1-4471-0337-0_4},
pdf = {papers/mive_vaa2001.pdf},
teaser = {teasers/mive_vaa2001.png},
abstract = {Content creation for computer graphics applications is a laborious process that requires skilled personnel. One fundamental problem is that manipulation of 3D objects with 2D user interfaces is very difficult for non-experienced users.
In this paper, we introduce a new system that uses constraints to restrict object motion in a 3D scene, making interaction much simpler and more intuitive. We compare three different 3D scene manipulation techniques based on a 2D user interface. We show that the presented techniques are significantly more efficient than commonly used solutions. To our knowledge, this is the first evaluation of 3D manipulation techniques with 2D devices and constraints.},
keywords = {3D manipulation, 3D positioning, constraints},
}
@inproceedings{smith2001utility,
title = {On the Utility of Semantic Constraints},
author = {Smith*, Graham and Stuerzlinger, Wolfgang},
booktitle = {Virtual Environments},
publisher = {Eurorgraphics},
series = {EGVE '01},
year = {2001},
month = {May},
pages = {41-50},
doi = {https://doi.org/10.2312/EGVE/EGVE01/041-050},
pdf = {papers/mive_egve2001.pdf},
video = {videos/mive_pipes.mp4},
teaser = {teasers/mive_egve2001.png},
abstract = {Content creation for computer graphics applications is a laborious process that requires skilled personnel. One fundamental problem is that manipulation of 3D objects with 2D user interfaces is very difficult for non-experienced users. In this paper, we describe a system that uses semantic constraints to restrict object motion in a 3D scene, making interaction much simpler and more intuitive. We compare three different levels of semantic constraints in a 3D scene manipulation program with a 2D user interface. We show that the pr esented techniques are significantly more efficient than alternate techniques, which do not use semantics in their constraints. To our knowledge, this is the first evaluation of 3D manipulation techniques with 2D devices and constraints.},
keywords = {3D manipulation, 3D positioning, constraints},
}
@inproceedings{salzman2001unconstrained,
title = {Unconstrained vs. Constrained {3D} Scene Manipulation},
author = {Salzman*, Tim and Stachniak*, Szymon and Stuerzlinger, Wolfgang},
booktitle = {Engineering for Human-Computer Interaction},
publisher = {Springer},
series = {EHCI '01},
year = {2001},
month = {May},
volume = {LNCS 2254},
pages = {207-219},
doi = {https://doi.org/10.1007/3-540-45348-2_19},
pdf = {papers/mive_ehci2001.pdf},
video = {videos/mive_playing.mp4},
teaser = {teasers/mive_ehci2001.png},
abstract = {Content creation for computer graphics applications is a very time-consuming process that requires skilled personnel. Many people find the manipulation of 3D object with 2D input devices non-intuitive and difficult. We present a system, which restricts the motion of objects in a 3D scene with constraints. In this publication we discuss an experiment that compares two different 3D manipulation interfaces via 2D input devices. The results show clearly that the new constraint-based interface performs significantly better than previous work.},
keywords = {3D manipulation, 3D positioning, constraints},
}
@inproceedings{stuerzlinger1999imaging,
title = {Imaging all Visible Surfaces},
author = {Stuerzlinger, Wolfgang},
booktitle = {Graphics Interface},
series = {GI '99},
year = {1999},
month = {Jun},
pages = {115-122},
doi = {https://doi.org/10.20380/GI1999.16},
pdf = {papers/imgvissurf.pdf},
teaser = {teasers/imgvissurf.png},
abstract = {Today many systems exist to generate geometric models of existing scenes and objects. However, very few systems store accurate data about surface appearance such as colors and textures. One way to capture surface texture data is to record a series of images that, collectively, captures all visible surfaces of the object. Finding good viewpoints for this task is not easy.
This paper presents a new heuristic method to find a good set of viewpoints for a given geometric model. Taking images from the computed viewpoints will show every visible part of every surface at least once. The approach uses a hierarchical visibility algorithm to preprocess the scene. A good set of viewing regions is identified with simulated annealing and then good viewpoints are derived. Results and visualizations of the computed solutions are presented.},
keywords = {3D scanning, next-best view, visibility},
}
@inproceedings{goesele1999semantic,
title = {Semantic Constraints for Scene Manipulation},
author = {Goesele*, Michael and Stuerzlinger, Wolfgang},
booktitle = {SCCG: Spring Conference in Computer Graphics},
series = {SCCG '99},
commented-isbn = {978-802231357-5},
year = {1999},
month = {Apr},
pages = {140-146},
url = {http://sccg.sk/1999_min},
pdf = {papers/semconstr.pdf},
teaser = {teasers/semconstr.png},
abstract = {The creation of object models for computer graphics applications, such as interior design or the generation of animations is a labour-intensive process. Today's computer aided design (CAD) programs address the problem of creating geometric object models quite well. But almost all users find common tasks, such as quickly furnishing a room, hard to accomplish. One of the basic reasons is that manipulation of objects often does not yield the expected results.
This paper presents a new system that exploits knowledge about natural behavior of objects to provide simple and intuitive interaction techniques for object manipulation. Semantic constraints are introduced, which encapsulate such `common knowledge' about objects. Furthermore, we present a new way to automatically infer a scene hierarchy by dynamically grouping objects according to their constraint relationships.},
keywords = {3D manipulation, 3D positioning, constraints},
}
@inproceedings{aliaga1999mmr,
title = {MMR: An Interactive Massive Model Rendering System Using Geometric and Image-Based Acceleration},
author = {Aliaga*, Daniel and Cohen*, Jon and Wilson*, Andrew and Baker*, Eric and Zhang*, Hansong and Erikson*, Carl and Hoff*, Kenny and Hudson*, Tom and Stuerzlinger, Wolfgang and Bastos*, Rui and Whitton, Mary and Brooks, Fred and Manocha, Dinesh},
booktitle = {Symposium on Interactive {3D} Graphics},
publisher = {ACM},
series = {I3D '99},
year = {1999},
month = {Apr},
pages = {199-206},
doi = {https://doi.org/10.1145/300523.300554},
pdf = {papers/mmr.pdf},
teaser = {teasers/mmr.png},
abstract = {We present a system for rendering very complex 3D models at interactive rates. We select a subset of the model as preferred viewpoints and partition the space into virtual cells. Each cell contains near geometry, rendered using levels of detailand visibility culling, and far geometry, rendered as a textured depth mesh. Our system automatically balances the screen-space errors resulting from geometric simplification with those from textured-depth-mesh distortion. We describe our prefetching and data management schemes, both crucial for models significantly larger than available system memory. We have successfully used our system to accelerate walkthroughs of a 13 million triangle model of a large coal-fired power plant and of a 1.7 million triangle architectural model. We demonstrate the walkthrough of a 1.3 GB power plant model with a 140 MB cache footprint.},
keywords = {rendering, real-time},
}
@comment{c, c={leave the "_stuerzlinger" in the ID to enable umlaut-free search!}}
@inproceedings{raskar_stuerzlinger1998efficient,
title = {Efficient Image Generation for Multiprojector and Multisurface Displays},
author = {Raskar*, Ramesh and Cutts*, Matt and Welch, Greg and Stürzlinger, Wolfgang},
booktitle = {Rendering Techniques},
publisher = {Springer},
series = {EGSR '98},
year = {1998},
month = {Jun},
pages = {139-144},
doi = {https://doi.org/10.1007/978-3-7091-6453-2_13},
pdf = {papers/multisurf.pdf},
teaser = {teasers/multisurf.png},
abstract = {We describe an efficient approach to rendering a perspectively correct image on a potentially irregular display surface that may be illuminated with one or more distinct devices. The first pass of the technique generates an image of the desired graphics model using conventional rendering. The second pass projects that image as a texture onto a model of the display surface, then re-renders the textured display surface model from the viewpoint of each display device. The algorithm scales with the complexity of the display surface, and is constant with respect to the complexity of the graphics model.},
keywords = {rendering, real-time, projector},
}
@inproceedings{stuerzlinger1997interactive,
title = {Interactive Rendering of Globally Illuminated Glossy Scenes},
author = {Stürzlinger, Wolfgang and Bastos*, Rui},
booktitle = {Rendering Techniques},
publisher = {Springer},
series = {EGSR '97},
year = {1997},
month = {Jun},
pages = {93-102},
doi = {https://doi.org/10.1007/978-3-7091-6858-5_9},
pdf = {papers/fastglos.pdf},
teaser = {teasers/fastglos.png},
abstract = {Global illumination simulates all transfers of light in a scene. The results of the simulation are then used to generate photo-realistic images. Scenes with diffuse surfaces only can be displayed in real-time using the results of radiosity methods. Images of scenes with more general surfaces are created with methods based on ray tracing but do not achieve interactive frame rates.This paper presents a new algorithm for the display of globally illuminated scenes at interactive speeds. A photon tracing phase computes an approximation to the global illumination. The rendering phase splats the contribution of each photon hit onto the corresponding surface taking reflectance properties and viewing direction into account. Results demonstrate that this method allows to render images of globally illuminated scenes with glossy surfaces at interactive frame rates.},
keywords = {rendering, real-time, global illumination},
}
@inproceedings{stuerzlinger1996generic,
title = {A Generic Interface to Colors, Materials, and Textures},
author = {Stürzlinger, Wolfgang},
booktitle = {Compugraphics},
publisher = {GRASP},
series = {Compugraphics '96},
isbn = {978-972834201-2},
year = {1996},
month = {Dec},
pages = {192-200},
pdf = {papers/genmat.pdf},
teaser = {teasers/genmat.png},
abstract = {Material models predict the reflection of light by surfaces in a scene. Many models have been proposed, all with different scope of effects and different parameters. The same holds for color models and texture definitions. Most computer graphics systems implement only one model with a minimal interface. If a different model is to be integrated this interface needs to be restructured which results in many code changes in the whole system.
This work presents a new approach to a generic interface to colors and materials. By enumerating all possible operations on these graphics objects an interface for reusable and portable code is defined. A seamless integration of textured surfaces into a computer graphics system is made possible by generic texture trees which implement the generic material interface. This portable definition of textures is realized via a tree of texture nodes and texture generators.},
keywords = {rendering, ray tracing},
}
@inproceedings{stuerzlinger1996bounding,
title = {Bounding Volume Construction Using Point Clouds},
author = {Stürzlinger, Wolfgang},
booktitle = {Spring Conference on Computer Graphics},
series = {SCCG '96},
isbn = {978-802231032-1},
year = {1996},
month = {Jun},
pages = {239-246},
url = {http://sccg.sk/1996_min},
pdf = {papers/pcloud.pdf},
teaser = {teasers/pcloud.png},
abstract = {Bounding volumes are used to optimize many graphic algorithms. They permit to decide quickly if a more exact test is likely to succeed or not. The exact test is only applied if the bounding volume test succeeds, which saves time in most cases. Two of the most prominent applications are ray tracing and collision detection.
This paper presents a new method to calculate tight bounding volumes for primitives under arbitrary transformations and hierarchical scene descriptions. An optimized form of storing a convex hull is presented which allows efficient calculation of the bounding volume type used for later processing. Results are shown for the ray tracing of cyclic CSG-graphs used to render plants and other natural phenomena.},
keywords = {rendering, ray tracing, bounding volumes},
}
@comment{c, c={leave the "_stuerzlinger" in the ID to enable umlaut-free search!}}
@inproceedings{burger_stuerzlinger1995immersive,
title = {Immersive Simulation for Computer Vision},
author = {Burger, Wilhelm and Barth, Matthew J. and Stürzlinger, Wolfgang},
booktitle = {Visual Modules},
publisher = {Oldenbourg Press},
isbn = {978-348623476-3},
year = {1995},
month = {May},
pages = {160-168},
pdf = {papers/vision.pdf},
teaser = {teasers/vision.png},
abstract = {Synthetic imagery has often been considered unsuitable for demonstrating the performance of vision algorithms and systems. We argue that (despite many remaining difficulties) simulation and computer graphics are at a point today that make them extremely useful for evaluation and training, even for complex outdoor applications. This is particularly valuable for autonomous and robotics applications, where the lack of suitable training data and ground truth information is a severe bottleneck. Extensive testing in a synthetic environment should become an integral part of the systems development and evaluation process to reduce the possibility of failure in the real word. We describe ongoing efforts towards the development of an "Immersive Perception Simulator" and discuss some of the specific problems involved.},
keywords = {rendering, computer vision, ray tracing, real-time},
}
@comment{c, c={leave the "_stuerzlinger" in the ID to enable umlaut-free search!}}
@inproceedings{schaufler_stuerzlinger1995exact,
title = {Exact and Error Bounded Approximations of Local Illumination},
author = {Schaufler*, Gernot and Stürzlinger, Wolfgang},
booktitle = {Compugraphics},
publisher = {GRASP},
series = {Compugraphics '95},
isbn = {978-972834200-5},
year = {1995},
month = {Dec},
pages = {327-333},
commented-url = {http://www.gup.uni-linz.ac.at:8001/staff/schaufler/papers/local},
pdf = {papers/localillum.pdf},
teaser = {teasers/localillum.png},
abstract = {Recent approaches to realistic image synthesis split the rendering process into two passes. The first pass calculates an approximate global illumination solution, the second produces an image of high quality (from a user selected view point) using the solution obtained in the first pass by applying the local illumination model to each surface point visible through each pixel. This paper presents a new method how to compute the visible surfaces as seen from a surface point - the hemisphere projection. This method allows the exact evaluation of the local illumination model and facilitates the fast and accurate computation of form factors taking occlusion into account. Using the hemisphere projection an exact local pass solution can be obtained. In addition the hemisphere projection can be used to compute an approximation of a point's local illumination to within given error bounds in significantly less time.},
keywords = {rendering, global illumination},
}
@comment{c, c={unfortunate-dup, quasi-parallel, but independent submission by different authors}}
@inproceedings{stuerzlinger1995load,
title = {Load Balancing for a Parallel Radiosity Algorithm},
author = {Stürzlinger, Wolfgang and Schaufler*, Gernot and Volkert, Jens},
booktitle = {Symposium on Parallel Rendering},
publisher = {ACM & IEEE},
series = {PRS '95},
year = {1995},
month = {Oct},
pages = {39-45},
doi = {https://doi.org/10.1145/218327.218335},
pdf = {papers/loadbalancing.pdf},
teaser = {teasers/loadbalancing.png},
abstract = {The radiosity method models the interaction of light between diffuse surfaces, thereby accurately predicting global illumination effects. Due to the high computational effort to calculate the transfer of light between surfaces and the memory requirements for the scene description, a distributed, parallelized version of the algorithm is needed for scenes consisting of thousands of surfaces.
We present several load distribution schemes for such a parallel algorithm which includes progressive refinement and adaptive subdivision for fast solutions of high quality. The load is distributed before the calculations in a static way. During the computation the load is redistributed dynamically to make up for individual differences in processor loads. The dynamic load balancing scheme never generates more data packets than the original algorithm and avoids overloading processors through actions taken by the scheme.},
keywords = {rendering, parallel, global illumination},
}
@comment{c, c={unfortunate-dup, quasi-parallel, but independent submission by different authors}}
@inproceedings{stuerzlinger1995strategies,
title = {Load Balancing Strategies for a Radiosity Algorithm},
author = {Stürzlinger, Wolfgang and Schaufler*, Gernot and Volkert, Jens},
booktitle = {High Performance Computing Symposium},
series = {HPCS '95},
isbn = {978-292131612-5},
year = {1995},
month = {Jul},
pages = {217-228},
url = {http://hpcs.ca},
pdf = {papers/loadbalancing1.pdf},
teaser = {teasers/loadbalancing1.png},
abstract = {The radiosity method models the interaction of light between diffuse surfaces, thereby accurately predicting global illumination effects. Due to the high computational effort to calculate the transfer of light between surfaces and the memory requirements for the scene description, a distributed, parallelized version of the algorithm is needed for scenes consisting of thousands of surfaces.
We present several load distribution schemes for such a parallel algorithm which includes progressive refinement and adaptive subdivision for fast solutions of high quality. The load is distributed before the calculations in a static way. During the computation the load is redistributed dynamically to make up for individual differences in processor loads. The dynamic load balancing scheme never generates more data packets than the original algorithm and avoids overloading processors through actions taken by the scheme.},
keywords = {rendering, parallel, global illumination},
}
@inproceedings{stuerzlinger1995exact,
title = {Exact Projections onto the Hemisphere},
author = {Stürzlinger, Wolfgang},
booktitle = {Spring Conference on Computer Graphics},
series = {SCCG '95},
isbn = {978-802330344-5},
year = {1995},
month = {May},
pages = {31-38},
pdf = {papers/hemisphere.pdf},
teaser = {teasers/hemisphere.png},
abstract = {Recent approaches to realistic image synthesis have split the rendering process into two passes. The first pass calculates an approximate global illumination solution, the second generates an image of high quality from a given view point using the illumination solution obtained in the first pass.
This paper discusses a new method for projecting polygons onto the hemisphere which is the central operation performed for each pixel during the local pass. The method calculates an exact hemispherical projection of all polygons considering occlusion. The chosen representation of the projected polygons facilitates the fast and accurate computation of formfactors with regard to the projection center.
The new hemispherical projection method is used to obtain an exact local pass solution.},
keywords = {rendering, global illumination},
footnote = {Newer work such as "Visibility Silhouettes for Semi-Analytic Spherical Integration", http://dx.doi.org/10.1111/cgf.12257 and "Vectorization for Fast, Analytic, and Differentiable Visibility", https://doi.org/10.1145/3452097 uses the same idea of decomposing projections into convex polygons.},
}
@comment{c, c={leave the "_stuerzlinger" in the ID to enable umlaut-free search!}}
@inproceedings{schaufler_stuerzlinger1995generating,
title = {Generating Multiple Levels of Detail for Polygonal Geometry Models},
author = {Schaufler*, Gernot and Stürzlinger, Wolfgang},
booktitle = {Virtual Environments},
publisher = {Springer},
series = {EGVE '95},
year = {1995},
month = {Jan},
pages = {33-41},
doi = {https://doi.org/10.1007/978-3-7091-9433-1_4},
commented-url = {http://www.gup.uni-linz.ac.at:8001/staff/schaufler/papers/lods},
pdf = {papers/lod.pdf},
teaser = {teasers/lod.png},
abstract = {This paper presents a new method for solving the following problem: Given a polygonal model of some geometric object generate several more and more approximative representations of this object containing less and less polygons. The idea behind the method is that small detail in the model is represented by many spatially close points. A hierarchical clustering algorithm is used to generate a hierarchy of clusters from the vertices of the object's polygons. The coarser the approximation the more points are found to lie within one cluster of points. Each cluster is replaced by one representative point and polygons are reconstructed from these points. A static detail elision algorithm was implemented to prove the practicability of the method. This paper shows examples of approximations generated from different geometry models, pictures of scenes rendered by a detail elision algorithm and timings of the method at work.},
keywords = {rendering, real-time},
}
@inproceedings{stuerzlinger1994parallel2,
title = {Parallel Visibility Calculations for Parallel Radiosity},
author = {Stürzlinger, Wolfgang and Wild*, Christoph},
booktitle = {Parallel Processing: CONPAR — VAPP VI},
publisher = {Springer},
series = {CONPAR '94},
year = {1994},
month = {Sep},
volume = {LNCS 854},
pages = {405-413},
doi = {https://doi.org/10.1007/3-540-58430-7_36},
pdf = {papers/parvis.pdf},
teaser = {teasers/parvis.png},
abstract = {The radiosity method models the interaction of light between diffuse reflecting surfaces, thereby accurately predicting global illumination effects. Due to the high computational effort to calculate the transfer of light between surfaces and the memory requirements for the scene description, a distributed, parallelized verison of the algorithm is needed for scenes consisting of thousands of surfaces. We present a distributed, parallel progressive radiosity algorithm. Then we parallelize the visibility calculations and analyze the results.},
keywords = {rendering, parallel, visibility, global illumination},
}
@inproceedings{stuerzlinger1994adaptive,
title = {Adaptive Mesh Refinement with Discontinuities for the Radiosity Method},
author = {Stürzlinger, Wolfgang},
booktitle = {Photorealistic Rendering Techniques},
publisher = {Springer},
series = {EGSR '94},
year = {1995},
commented-year = {1994},
month = {Aug},
commented-month = {Jun},
pages = {244-253},
doi = {https://doi.org/10.1007/978-3-642-87825-1_18},
pdf = {papers/disco.pdf},
teaser = {teasers/disco.png},
abstract = {The radiosity method simulates the interaction of light between diffuse reflecting surfaces, thereby accurately predicting global illumination effects. One of the main problems of the original algorithm is the inability to represent correctly the shadows cast onto surfaces. Adaptive subdivision techniques were tried but the results are not good enough for general purposes. The conceptually different discontinuity meshing algorithm produces exact pictures of shadow boundaries but is computationally expensive. The newly presented adaptive discontinuity meshing method combines the speed of adaptive subdivision with the quality of the discontinuity meshing method.},
keywords = {rendering, global illumination},
}
@inproceedings{stuerzlinger1994optimization,
title = {Two Optimization Methods for Ray Tracing},
author = {Stürzlinger, Wolfgang and Tobler*, Robert},
booktitle = {Spring School on Computer Graphics},
series = {SCCG '94},
isbn = {978-802230801-4},
year = {1994},
month = {Jun},
pages = {104-107},
pdf = {papers/rtopt.pdf},
teaser = {teasers/rtopt.png},
abstract = {Raytracing is a method to produce photo-realistic pictures. For each pixel of an image one ray is shot to find the object, which determines the color of the pixel. Rays are also used to simulate shadows and reflections. Previously bounding volume hierarchies have been used to speed raytracing. A new method to speed the traversal of a bounding volume hierarchy is presented. Optimisation methods to find the intersection point between the ray and the scene have been introduced previously. A new algorithm based on cylinders is presented also.},
keywords = {rendering, ray tracing},
}
@inproceedings{stuerzlinger1992radiosity,
title = {Radiosity with Voronoi Diagrams},
author = {Stürzlinger, Wolfgang},
booktitle = {Third Eurographics Workshop on Rendering},
publisher = {Consolidation Express},
series = {EGSR '92},
isbn = {978-189785100-5},
year = {1992},
month = {May},
pages = {169-177},
pdf = {papers/radvor.pdf},
teaser = {teasers/radvor.png},
abstract = {Current radiosity methods rely on the calculation of geometric factors, known as form-factors which describe energy exchange between the surfaces of an environment. The most widely used method for storing the illumination across a surface is a mesh of quadrilaterals and/or triangles. For more exact computations these meshes need to be subdivided adaptively. The subdivision methods create artifacts which have visible results. A new technique for storing the surface is presented, based on Voronoi diagrams, which are well suited for the task, and can be subdivided without introducing artifacts.},
keywords = {rendering, global illumination},
}
@comment{************************other_publications************************}
@misc{bashar2026vacgazecontroller,
title = {Effects of Visual Depth on Vergence–Accommodation Conflict in Gaze- and Controller-Based Selection in Virtual Reality},
author = {Bashar*, Mohammad Raihanul and Amini*, Mohammadreza and Mutasim, Aunnoy K. and Barrera Machuca, Mayra D. and Stuerzlinger, Wolfgang and Batmaz, Anil Ufuk},
booktitle = {Extended Abstracts of the CHI Conference on Human Factors in Computing Systems},
publisher = {ACM},
series = {CHI EA '26},
howpublished = {Extended Abstract},
year = {2026},
month = {Apr},
articleno = {250},
numpages = {6},
doi = {https://doi.org/10.1145/3772363.3798344},
pdf = {papers/vacgazecontroller.pdf},
abstract = {The vergence–accommodation conflict (VAC) in stereoscopic head-mounted displays is known to affect depth perception and interaction performance. Prior studies have examined its impact on a controller, but it remains unclear how the VAC affects gaze pointing in Virtual Reality. Here, we investigate gaze- and controller-based 3D target selection under varying depth conditions. Results show that gaze is more sensitive to depth variation, exhibiting longer movement times, higher variability along the task axis, and lower throughput compared to controller-based interaction. "Variation in Diopter" Fitts' law modeling further indicates greater depth-dependent variability for gaze input. Despite these differences, perceived usability and workload were comparable. These findings suggest that the VAC affects pointing modalities differently, which should be considered when designing gaze-enabled 3D interfaces.},
keywords = {eye gaze, 3D pointing},
}
@misc{motoe2026steeringpreview,
title = {Deriving Steering Time Models for Paths with Corners of Varying Curvature Based on Preview-Based Velocity Control},
author = {Motoe*, Koyo and Kasahara*, Nobuhito and Yamanaka, Shota and Stuerzlinger, Wolfgang and Miyashita, Homei},
booktitle = {Extended Abstracts of the CHI Conference on Human Factors in Computing Systems},
publisher = {ACM},
series = {CHI EA '26},
howpublished = {Extended Abstract},
year = {2026},
month = {Apr},
articleno = {204},
numpages = {6},
doi = {https://doi.org/10.1145/3772363.3798500},
pdf = {papers/steeringpreview.pdf},
abstract = {Steering operations, such as menu navigation and drawing, constitute a fundamental GUI interaction. The conventional Steering Law estimates movement times by accumulating the local width of the path, but it suffers from limited predictive accuracy for paths with varying curvature. In contrast, humans tend to adjust their speed by anticipating the path ahead (e.g., when driving). This study proposes a new Preview-based Model, which integrates geometric properties with visual constraints further along the path. Our experimental results show that our model achieved a higher adjusted R^2 (0.983) on curve-included paths than existing models. Furthermore, a simplified formulation without parameter tuning also exhibited comparable accuracy (adjusted R^2 = 0.972), confirming its effectiveness as a practical difficulty metric.},
keywords = {steering, lasso},
}
@misc{hu2025exploringgazesteering,
title = {Exploring and Modeling Gaze-Based Steering Behavior in Virtual Reality},
author = {Hu*, Xuning and Zhang*, Yichuan and Wei*, Yushi and Li, Yue and Stuerzlinger, Wolfgang and Liang, Hai-Ning},
booktitle = {Extended Abstracts of the CHI Conference on Human Factors in Computing Systems},
publisher = {ACM},
series = {CHI EA '25},
howpublished = {Extended Abstract},
year = {2025},
month = {Apr},
articleno = {260},
pages = {1-8},
doi = {https://doi.org/10.1145/3706599.3720273},
pdf = {papers/exploringgazesteering.pdf},
abstract = {Gaze-based interaction is a common input method in virtual reality (VR). Eye movements, such as fixations and saccades, result in different behaviors compared to other input methods. Previous studies on selection tasks showed that, unlike the mouse, the human gaze is insensitive to target distance and does not fully utilize target width due to the characteristics of saccades and micro-saccades of the eyes. However, its application in steering tasks remains unexplored. Since steering tasks are widely used in VR for menu adjustments and object manipulation, this study examines whether the findings from selection tasks apply to steering tasks. We also model and compare the Steering Law based on eye movement characteristics. To do this, we use data on movement time, average speed, and re-entry count. Our analysis investigates the impact of path width and length on performance. This work proposes three candidate models that incorporate gaze characteristics, which achieve a superior fit (R² > 0.964) compared to the original Steering Law, improving the accuracy of time prediction, AIC, and BIC by 7%, 26%, and 10%, respectively. These models offer valuable insights for game and interface designers who implement gaze-based controls in VR environments.},
keywords = {eye gaze, steering},
}
@misc{bashar2025depth3dsketch,
title = {Depth3DSketch: Freehand Sketching Out of Arm's Reach in Virtual Reality},
author = {Bashar*, Mohammad Raihanul and Amini*, Mohammadreza and Stuerzlinger, Wolfgang and Sarac, Mine and Pfeuffer, Ken and Barrera Machuca, Mayra D. and Batmaz, Anil Ufuk},
booktitle = {Extended Abstracts of the CHI Conference on Human Factors in Computing Systems},
publisher = {ACM},
series = {CHI EA '25},
howpublished = {Extended Abstract},
year = {2025},
month = {Apr},
articleno = {175},
pages = {1-8},
doi = {https://doi.org/10.1145/3706599.3719717},
pdf = {papers/depth3dsketch.pdf},
abstract = {Due to the increasing availability and popularity of virtual reality (VR) systems, 3D sketching applications have also boomed. Most of these applications focus on peripersonal sketching, e.g., within arm's reach. Yet, sketching in larger scenes requires users to walk around the virtual environment while sketching or to change the sketch scale repeatedly. This paper presents Depth3DSketch, a 3D sketching technique that allows users to sketch objects up to 2.5 m away with a freehand sketching technique. Users can select the sketching depth with three interaction methods: using the joystick on a single controller, the intersection from two controllers, or the intersection from the controller ray and the user's gaze. We compared these interaction methods in a user study. Results show that users preferred the joystick to select visual depth, but there was no difference in user accuracy or sketching time between the three methods.},
keywords = {eye gaze, 3D modeling, depth selection},
}
@misc{lu2025designinguiwithaiworkshop,
title = {Designing and Developing User Interfaces with AI: Advancing Tools, Workflows, and Practices},
author = {Lu*, Yuwen and Jiang*, Yue and Knearem, Tiffany and Kliman-Silver, Clara and Lutteroth, Christof and Nichols, Jeffery and Stuerzlinger, Wolfgang},
booktitle = {Extended Abstracts of the CHI Conference on Human Factors in Computing Systems},
publisher = {ACM},
series = {CHI EA '25},
howpublished = {Extended Abstract},
year = {2025},
month = {Apr},
articleno = {774},
pages = {1-7},
doi = {https://doi.org/10.1145/3706599.3706736},
pdf = {papers/designinguiwithaiworkshop25.pdf},
abstract = {Designing and developing user-friendly interfaces has long been a cornerstone of HCI research. However, we are now at a turning point for how user interfaces can be designed and evaluated with new AI-based models and tools. The latest AI models have shown capabilities to model user behaviors, automate end-user tasks, and even generate user interfaces. We are at a pivotal moment to reflect on current UI design and development practices and discuss the opportunities, challenges, and risks brought by AI. Both incremental improvements and transformative opportunities exist for designers, developers, and the hand-off process in between. In this proposed workshop, we encourage participants to envision AI-enabled UI prototyping tools, workflows, and practices. By bringing together academic researchers and industry practitioners, we aim to identify opportunities to enhance prototyping tools and reshape UI creation workflows for the future as well as discuss potential negative consequences of these tools.},
keywords = {GUI, layout, constraints},
}
@misc{lee2025personalizednav,
title = {Towards Personalized Navigation in XR: A User-Centered Approach to Accessibility},
author = {Lee, Jong-In and Stuerzlinger, Wolfgang},
booktitle = {Workshop on Locomotion and Wayfinding in XR, VR Adjunct Proceedings},
publisher = {IEEE},
series = {LocXR '25},
year = {2025},
month = {Mar},
pages = {241-245},
doi = {https://doi.org/10.1109/VRW66409.2025.00059},
pdf = {papers/personalizednav.pdf},
abstract = {Navigation interfaces in Extended Reality (XR) have traditionally targeted universal solutions that perform well for all users. However, research has shown that users exhibit distinct preferences and performance patterns when using different navigation techniques. This position paper argues for the necessity of and strategies for designing personalized navigation interfaces that accommodate individual differences in spatial abilities, navigation strategies, and accessibility needs. Drawing from empirical findings across multiple user studies investigating locomotion and wayfinding techniques and research in spatial cognition and navigation, we demonstrate how different user groups respond uniquely to navigation interface components. Based on these insights, we propose a framework for developing adaptive navigation interfaces that cater to individual user characteristics while maintaining usability. Furthermore, we discuss opportunities for standardization in user assessment, interface adaptation, and accessibility support. This approach could lead to more inclusive and effective navigation solutions for XR environments.},
keywords = {3D navigation, accessibility, virtual reality, augmented reality},
}
@misc{zhao2024barehandposter,
title = {A Novel Bare-Handed and Widget-based Manipulation Technique for Distant Objects in Virtual Reality},
author = {Zhao*, Di Bill and Stuerzlinger, Wolfgang},
booktitle = {ISMAR Adjunct Proceedings},
series = {ISMAR '24},
howpublished = {Poster},
year = {2024},
month = {Oct},
pages = {525-528},
doi = {https://doi.org/10.1109/ISMAR-Adjunct64951.2024.00152},
commented-pdf = {papers/barehandposter.pdf},
commented-teaser = {teasers/barehandposter.png},
abstract = {Recent advancements in bare-hand tracking technology in VR headsets enable intuitive hand interaction for proximate 3D object manipulation. This paper explores two-handed bare-hand interaction for distant 3D objects, by using the non-dominant hand as an interaction surface to enable adept manipulation of a distant 3D object's position and rotation. A user study demonstrated markedly higher precision in complex manipulation tasks compared to traditional methods while maintaining comparable efficiency and accuracy for simpler tasks. Our method also received a good usability rating, illustrating its user-centric and intuitive nature. We discuss insights on error prevention, constraint integration, and consistent interaction for future VR interaction methods.},
keywords = {3D interaction, 3D manipulation, hand tracking},
}
@misc{jiang2024computationaluiworkshop24,
title = {Computational Methodologies for Understanding, Automating, and Evaluating User Interfaces},
author = {Jiang*, Yue and Lu*, Yuwen and Knearem, Tiffany and Kliman-Silver, Clara and Lutteroth, Christof and Li, Toby Jia-Jun and Nichols, Jeffery and Stuerzlinger, Wolfgang},
booktitle = {Extended Abstracts of the CHI Conference on Human Factors in Computing Systems},
publisher = {ACM},
series = {CHI EA '24},
howpublished = {Extended Abstract},
year = {2024},
month = {May},
articleno = {462},
pages = {1-7},
doi = {https://doi.org/10.1145/3613905.3636316},
pdf = {papers/computationaluiworkshop24.pdf},
abstract = {Building on the success of the first two workshops on user interfaces (UIs) at CHI 2022 and CHI 2023, this workshop aims to advance the research field by further exploring current research trends, such as applying large language models and visual language models.
Previous work has explored computational approaches to understand and adapt UIs using constraint-based optimization models and machine learning-based data-driven approaches. In addition to further delving into these established UI research areas, we aim to trigger the exploration into the application of the latest advancements in general-purpose large language and vision-language models within the UI domain.
We will encourage participants to explore novel methods for understanding, automating, and evaluating UIs.
The proposed workshop seeks to bring together academic researchers and industry practitioners interested in computational approaches for UIs to discuss the needs and opportunities for future user interface algorithms, models, and applications.},
keywords = {GUI, layout, constraints},
}
@misc{kasahara2023crossingthroughput,
title = {Throughput and Effective Parameters in Crossing},
author = {Kasahara*, Nobuhito and Oba*, Yosuke and Yamanaka, Shota and Stuerzlinger, Wolfgang and Miyashita, Homei},
booktitle = {Extended Abstracts of the CHI Conference on Human Factors in Computing Systems},
publisher = {ACM},
series = {CHI EA '23},
howpublished = {Extended Abstract},
year = {2023},
month = {Apr},
articleno = {282},
numpages = {9},
doi = {https://doi.org/10.1145/3544549.3585817},
pdf = {papers/crossingthroughput.pdf},
abstract = {In pointing, throughput TP is used as a performance metric for the input device and operator. Based on the calculation of effective parameters (width We and amplitude Ae), TP should be independent of the speed-accuracy tradeoff. To examine the validity of TP and effective parameters for crossing actions, we conducted two experiments using two established crossing tasks. Our results demonstrate that applying effective parameters to Fitts’ law model improves the fit to the data for mixed biases in both tasks. Besides, we observed that effective parameters smoothed TPs across biases. However, unlike pointing, TP was observed to be unstable across IDs in one task, while was stable across IDs in the other task. Analyzing speed profiles showed that this was likely due to the fact that one of the tasks could be completed with a ballistic movement at low IDs, whereas this was impossible for the other task.},
keywords = {throughput, crossing},
}
@misc{mutasim2023repeatedtyping,
title = {Does Repeatedly Typing the Same Phrase Provide a Good Estimate of Expert Text Entry Performance?},
author = {Mutasim*, Aunnoy K and Hudhud Mughrabi+, Moaaz and Batmaz, Anil Ufuk and Stuerzlinger, Wolfgang},
booktitle = {Extended Abstracts of the CHI Conference on Human Factors in Computing Systems},
publisher = {ACM},
series = {CHI EA '23},
howpublished = {Extended Abstract},
year = {2023},
month = {Apr},
articleno = {90},
numpages = {8},
doi = {https://doi.org/10.1145/3544549.3585647},
pdf = {papers/repeatedtyping.pdf},
abstract = {To identify if novel/unfamiliar keyboard layouts like OPTI can outperform QWERTY, lengthy training through longitudinal studies is typically required. To reduce this logistical bottleneck, a popular approach in the literature requires participants to type the same phrase repeatedly. However, it is still unknown whether this approach provides a good estimate of expert performance. To validate this method, we set up a study where participants were tasked with typing the same phrase 96 times for both OPTI and QWERTY. Results showed that this approach has the potential to estimate expert performance for novel/unfamiliar keyboards faster than the traditional approach with different phrases. Yet, we also found that accurate estimates still require training over several days and, therefore, do not eliminate the need for a longitudinal study. Our findings thus show the need for research on faster, easier, and more reliable empirical approaches to evaluate text entry systems.},
keywords = {text entry, touch typing},
}
@misc{hayatpur2023personalspaces,
title = {Designing Collaborative Parsons Problems with Personal-Spaces},
author = {Hayatpur*, Devamardeep and Helfenbaum*, Tehilla and Xia, Haijun and Stuerzlinger, Wolfgang and Gries, Paul},
booktitle = {Extended Abstracts of the CHI Conference on Human Factors in Computing Systems},
publisher = {ACM},
series = {CHI EA '23},
howpublished = {Extended Abstract},
year = {2023},
month = {Apr},
articleno = {263},
numpages = {7},
doi = {https://doi.org/10.1145/3544549.3585630},
pdf = {papers/personalspaces.pdf},
video = {videos/personalspaces.mp4},
teaser = {teasers/personalspaces.png},
abstract = {Pair programming has proven to be a successful pedagogical technique. However, its effectiveness depends on the frequency and quality of communication of the driver. In this work, we explore an alternative collaboration paradigm that tackles the imbalance in pair programming through Parsons problems: students are given fragments of code out of order and tasked with re-organizing them into the correct order. We then create an interdependence between students by assigning each learner to a different sub-problem in their space, termed Personal-spaces. Students must engage in dialog to negotiate, exchange, and use fragments from the same pool. In an exploratory study with nine pairs of undergraduate students, we find evidence pointing to affordances of different coordination conditions: Personal-spaces promoted ownership and engagement, while Turn taking (akin to pair programming) helped maintain a consistent train of thought. We provide guidelines for design of appropriate problem sets and collaboration tools to structure conversations.},
keywords = {pair programming, parsons problems, programming education},
}
@misc{jiang2023futureuiworkshop,
title = {The Future of Computational Approaches for Understanding and Adapting User Interfaces},
author = {Jiang*, Yue and Lu*, Yuwen and Lutteroth, Christof and Li, Toby Jia-Jun and Nichols, Jeffery and Stuerzlinger, Wolfgang},
booktitle = {Extended Abstracts of the CHI Conference on Human Factors in Computing Systems},
publisher = {ACM},
series = {CHI EA '23},
howpublished = {Extended Abstract},
year = {2023},
month = {Apr},
articleno = {367},
numpages = {5},
doi = {https://doi.org/10.1145/3544549.3573805},
pdf = {papers/futureuiworkshop.pdf},
abstract = {Building on the success of the first workshop on understanding, generating, and adapting user interfaces at CHI2022, this workshop will advance this research area further by looking at existing results and exploring new research directions. Computational approaches for user interfaces have been used in adapting interfaces for different devices, modalities, and user preferences. Recent work has made significant progress in understanding and adapting user interfaces with traditional constraint/rule-based optimization and machine learning-based data-driven approaches; however, these two approaches remain separate. Combining the two approaches has great potential to advance the area but remains under-explored and challenging. Other contributions, such as datasets for potential applications, novel representations of user interfaces, the analysis of human traces, and models with multi-modalities, will also open up future research options. The proposed workshop seeks to bring together researchers interested in computational approaches for user interfaces to discuss the needs and opportunities for future user interface algorithms, models, and applications.},
keywords = {GUI, layout, constraints},
}
@misc{hudhud23effectiveehct,
title = {On the Effectiveness of Virtual Eye-Hand Coordination Training with Head Mounted Displays},
author = {Hudhud Mughrabi+, Moaaz and Kaya+, Furkan and Batmaz, Anil Ufuk and Aliza*, Aliza and Stuerzlinger, Wolfgang and Borazan+, Baris and Tonyali+, Emir and Sarac, Mine},
booktitle = {Workshop on 3D Content Creation for Simulated Training in eXtended Reality, VR Adjunct Proceedings},
publisher = {IEEE},
series = {TrainingXR '23},
year = {2023},
month = {Mar},
numpages = {8},
doi = {https://doi.org/10.1109/VRW58643.2023.00014},
pdf = {papers/effectiveehct.pdf},
abstract = {Eye-hand coordination training systems are used to train participants' motor skills and visual perception. Such systems have already been tested in Virtual Reality, and the results revealed that Head Mounted Displays have the potential to improve the motor training. However, this was only investigated in an hour-long study. In the longitudinal study reported here, we analyzed the motor performance of three participants in ten sessions with three different assessment criteria, where participants were instructed to focus on speed, error rate, or complete the training freely (with no instructions). We also assessed the effective throughput performance of the participants. Our results indicate that participants focusing on speed might need less number of learning sessions. We hope that our results will help practitioners and developers design efficient Virtual Reality training systems.},
keywords = {3D pointing, gaze tracking, eye-hand coordination},
}
@misc{taylor2022litports,
title = {LitPorts: On-demand Illuminated Ports to Facilitate Inter-device Connections in Low-light Conditions},
author = {Taylor*, Tiffany E. and Stuerzlinger, Wolfgang},
booktitle = {Australian Conference on Human-Computer Interaction},
series = {OzCHI '22},
howpublished = {Late-Breaking Work},
year = {2022},
month = {Nov},
pages = {51-57},
doi = {https://doi.org/10.1145/3572921.3572932},
commented-url = {http://www.ozchi.org/2022/poster_lbw1027.html},
pdf = {papers/litports.pdf},
video = {videos/litports.mp4},
teaser = {teasers/litports.png},
abstract = {Plugging a cable or peripheral into a device is an integral aspect of daily use of computing devices for most users. Yet, in low-light or constrained-visibility conditions the simple act of finding the receptacle to connect the cable to can be challenging and lead to user frustration. To alleviate this frustration we present LitPorts, a technology that illuminates receptacles in low-light conditions when a compatible plug is in proximity, making plugging a cable in substantially easier leading to a better all-around user experience. We also present user feedback from our prototype testing demonstrating the broad appeal and applicability of LitPorts.},
keywords = {device connectivity, ports, receptacles, illumination},
}
@misc{rajabiseraji2022xvcollab,
title = {XVCollab: An Immersive Analytics Tool for Asymmetric Collaboration across the Virtuality Spectrum},
author = {Rajabi Seraji*, Mohammad and Stuerzlinger, Wolfgang},
booktitle = {Workshop on Visual Analytics in Immersive Environments, ISMAR Adjunct Proceedings},
series = {VAinIE '22},
year = {2022},
month = {Oct},
pages = {146-154},
doi = {https://doi.org/10.1109/ISMAR-Adjunct57072.2022.00035},
pdf = {papers/xvcollab.pdf},
teaser = {teasers/xvcollab.png},
abstract = {Research has shown that when a group of people collaborate in decision-making scenarios, they can be more effective than when they work alone. Studies also show that in a data analytics context, using immersive technologies could make users perform better in data understanding, pattern recognition, and finding connections. In this work, we are leveraging previous knowledge in Collaborative Immersive Analytics (CIA) and Cross-virtuality Analytics (XVA) to develop an asymmetric system that enables two groups from different places on the Virtuality-Reality spectrum to simultaneously work on analyzing data. We divide users into two groups: the non-immersive desktop group and the immersive AR group. These two groups can both author and modify visualizations in their virtuality and share it with the other group when they see fit. For this, we designed a non-interruptive interface for both groups to transform a visualization from non-immersive 2D to immersive AR and vice-versa. We also provide multiple awareness cues in the system that keep either group aware of the other and their actions. We designed these features to boost user performance and ease of use in a collaborative setting and incentivize them to rely on the other group for visualization tasks that are difficult to perform on their end of the virtuality spectrum. Our limited pilot study shows that users find the system engaging, easy to use, and helpful in their data-understanding journey within the collaborative context. Going forward, we plan to conduct more rigorous studies to verify our claims and explore other research questions on this topic.},
keywords = {immersive analytics, cross-reality, augmented reality, collaboration},
}
@misc{rajabiseraji2022hybridaxes,
title = {HybridAxes: An Immersive Analytics Tool With Interoperability Between 2D and Immersive Reality Modes},
author = {Rajabi Seraji*, Mohammad and Stuerzlinger, Wolfgang},
booktitle = {Workshop on Prototyping Cross-Reality Systems, ISMAR Adjunct Proceedings},
series = {PCRS '22},
year = {2022},
month = {Oct},
pages = {155-160},
doi = {https://doi.org/10.1109/ISMAR-Adjunct57072.2022.00036},
pdf = {papers/hybridaxes.pdf},
teaser = {teasers/hybridaxes.png},
abstract = {Throughout the visual analytics process, users create visualizations with different dimensionalities. Research shows that in this process users benefit from being able to simultaneously see 2D and 3D modes of their data visualizations. Towards supporting this potential need, we introduce HybridAxes, an immersive visual analytics tool that allows the users to conduct their analysis at either end of the reality spectrum - either in 2D on desktop monitors or 3D in an immersive AR/VR environment - while enabling them to seamlessly switch between the two modes. We believe that by using our system, users will find it easier and faster to understand and analyze multi-dimensional data. An initial pilot test indicates positive trends in terms of users' performance time and usability metrics compared to the standalone desktop or XR counterparts. Our preliminary results also suggest that users experience a lower cognitive load while task-switching between these reality modes. This reduction in mental effort causes them to perceive the system to be unobtrusive and pleasant to work with. Going forward, we plan to conduct more rigorous studies to verify our claims and to explore other research questions on this topic.},
keywords = {immersive analytics, cross-reality, augmented reality},
}
@misc{bao2022errorsspeechtranscription,
title = {The Effects of Errors in Speech Transcription: A User Study},
author = {Bao*, Tianyi Vera and Ahmed+, Afshan and Stuerzlinger, Wolfgang},
booktitle = {TEXT2030: Shaping Text Entry Research in 2030, Workshop at MobileHCI '22},
commented-publisher = {ACM},
series = {TEXT '22},
year = {2022},
month = {Oct},
numpages = {6},
pdf = {papers/respeak.pdf},
url = {http://text2030.textentry.org.uk/papers/6.pdf},
abstract = {This paper investigates how errors that occur during speech recognition affect users’ text entry performance. To study this, we implemented a speech recognition system that injects believable errors in a controlled manner. In our user study, participants were asked to transcribe a set of phrases using our speech recognition system, either with or without the insertion of errors. The results show that inducing 33% errors in a speech-based transcription task does not seem to affect users’ performance and experience in a significant manner. Yet, according to participants’ interview responses, our result might have been caused by the phrase set we used in the study. Our work thus motivates future research to develop a phrase set more suitable for speech-based transcription tasks.},
keywords = {text entry, speech recognition, errors},
}
@misc{kneifel2022autocorrectpersonality,
title = {Effects of Personality Type on Trust in Autocorrect and Preferences},
author = {Kneifel*, Johanna and Spaeth, Dominic and Stuerzlinger, Wolfgang},
booktitle = {TEXT2030: Shaping Text Entry Research in 2030, Workshop at MobileHCI '22},
commented-publisher = {ACM},
series = {TEXT '22},
year = {2022},
month = {Oct},
numpages = {6},
pdf = {papers/autocorrectpersonality.pdf},
url = {http://text2030.textentry.org.uk/papers/3.pdf},
abstract = {User acceptance of a given feature depends upon its perceived trustworthiness. Despite imperfections, trust seems to be evenly split for autocorrect. In this study, we use the Big Five personality test and text entry tasks to investigate the effect of users’ personality type on their trust in autocorrect when encountering autocorrect errors. Results indicate that individuals ranking higher in neuroticism distrust autocorrect more. Our qualitative observations showed frustrated behaviors for autocorrect errors during the text entry tasks. Half of our participants reporting distrust in autocorrect still had the feature on. The results lend insights into connections between personality type and preferred text-based communication methods, which needs to be investigated further in future work.},
keywords = {text entry, autocorrect, trust, personality, errors},
}
@misc{kneifel2022speechvstyping,
title = {Speech Recognition Versus Typing: A Mixed-Methods Evaluation},
author = {Kneifel*, Johanna and Alharbi, Ohoud and Stuerzlinger, Wolfgang},
booktitle = {TEXT2030: Shaping Text Entry Research in 2030, Workshop at MobileHCI '22},
commented-publisher = {ACM},
series = {TEXT '22},
year = {2022},
month = {Oct},
numpages = {7},
pdf = {papers/speechvstyping.pdf},
url = {http://text2030.textentry.org.uk/papers/4.pdf},
abstract = {Mobile text entry has become a main mode of communication. To make text entry as efficient as possible, helpful features, such as autocorrect and speech recognition have been developed. In our study, we confirmed previous work in that speech recognition was faster, while the error rate for typing was lower. To analyze this in more depth, we performed semi-structured interviews about participants’ text-entry preferences, specific pain points that occur, and potential suggestions for improving the editing experience.},
keywords = {text entry, speech recognition, errors},
}
@misc{lee2022multiscalenavposter,
title = {A Comparison of Zoom-In Transition Methods for Multiscale VR},
author = {Lee*, Jong-In and Asente, Paul and Stuerzlinger, Wolfgang},
booktitle = {SIGGRAPH 2022 Posters},
publisher = {ACM},
series = {SIGGRAPH '22},
howpublished = {Poster},
year = {2022},
month = {Aug},
articleno = {22},
numpages = {2},
doi = {https://doi.org/10.1145/3532719.3543237},
pdf = {papers/zoomintransition.pdf},
abstract = {When navigating within an unfamiliar virtual environment in virtual reality, transitions between pre-defined viewpoints are known to facilitate spatial awareness of a user. In the past, different viewpoint transition techniques had been investigated in VR 3D UI research, but mainly for single-scale environments. We present a comparative study of zoom-in transition techniques, where the viewpoint of a user is being smoothly transitioned from a large level of scale (LoS) to a smaller LoS in a multiscale virtual environment (MVE) with a nested structure. We identify that orbiting first before zooming in is preferred over other alternatives when transitioning to a viewpoint at a small LoS.},
keywords = {3D navigation, multiscale virtual environment, viewpoint transition},
}
@misc{kaya2022depthrole,
title = {The Role of the Depth Dimension in 3D Visualizations for Dense Data Understanding},
author = {Kaya+, Furkan and Batmaz, Anil Ufuk and Mutasim*, Aunnoy K and Stuerzlinger, Wolfgang},
booktitle = {European Conference on Visual Perception},
commented-publisher = {Sage},
series = {ECVP '22},
howpublished = {Abstract},
year = {2022},
month = {Aug},
pages = {183-184},
doi = {https://doi.org/10.1177/03010066221141167},
abstract = {Visual attributes, such as size, shape, or colour, play a crucial role in the interpretation of data visualizations and can be used to represent the data at different scales. On 2D displays, human viewers then perceive the differences between scales based on such visual attributes. While it can be challenging for human to interpret data in dense visualizations in 2D, the additional depth dimension offered by 3D could make some aspects of data more visible.
To analyze the potential impact of depth perception on dense data visualization, we developed a novel visualization method and visualized dense COVID-19 time-series data of four European countries (France, Germany, United Kingdom, and Turkey). In our novel visualization, we aimed to increase the visibility of individual data points to ease visual perception and visualized daily total cases in the depth dimension.
We conducted a user study with 20 participants where we compared a conventional 2D visualization with the proposed novel 3D visualization method for COVID-19 data.
The results show that the novel 3D visualization method facilitated understanding of the complexity of COVID-19 case data and decreased misinterpretations by 40%. Overall, 13 out of 20 participants preferred to see the COVID-19 data with the proposed method. Participants’ comments on the novel visualization method revealed that the increased visibility of individual data points decreases the cognitive load of the participants, which might explain the outcome.
The results of our work identify that the depth dimension offered by 3D visualizations can assist users in understanding dense data.},
keywords = {3D visualization, perception},
}
@misc{dunlop2022textworkshop,
title = {TEXT2030 - Shaping Text Entry Research in 2030},
author = {Dunlop, Mark and Stuerzlinger, Wolfgang and Arif, Ahmed Sabbir and Alharbi, Ohoud and Komninos, Andreas},
booktitle = {International Conference on Human-Computer Interaction with Mobile Devices and Services},
publisher = {ACM},
series = {MobileHCI '22},
howpublished = {Workshop Abstract},
year = {2022},
month = {Sep},
articleno = {3},
numpages = {4},
doi = {https://doi.org/10.1145/3528575.3551429},
pdf = {papers/text2030ws.pdf},
url = {http://text2030.textentry.org.uk},
abstract = {We propose a workshop on the theme of ubiquitous text entry research. Our aim is to address the methodological challenges arising from several decades of experience in this research community. We hope to solicit views, experiences and ideas from researchers across a range of backgrounds, with a view to formulate concrete action plans to move community practices into a strengthened position by 2030.},
keywords = {text entry, methodological challenges},
}
@misc{jiang2022computationaluiworkshop,
title = {Computational Approaches for Understanding, Generating, and Adapting User Interfaces},
author = {Jiang*, Yue and Lu*, Yuwen and Nichols, Jeffery and Stuerzlinger, Wolfgang and Yu, Chun and Lutteroth, Christof and Li, Yang and Kumar, Ranjitha and Li, Toby Jia-Jun},
booktitle = {Extended Abstracts of the CHI Conference on Human Factors in Computing Systems},
publisher = {ACM},
series = {CHI EA '22},
howpublished = {Extended Abstract},
year = {2022},
month = {May},
articleno = {74},
numpages = {6},
doi = {https://doi.org/10.1145/3491101.3504030},
pdf = {papers/computationaluiworkshop.pdf},
abstract = {Computational approaches for user interfaces have been used in adapting interfaces for different modalities, usage scenarios and device form factors, understanding screen semantics for accessibility, task-automation, information extraction, and in assisting interface design. Recent advances in machine learning (ML) have drawn considerable attention across HCI and related fields such as computer vision and natural language processing, leading to new ML-based user interface approaches. Similarly, significant progress has been made with more traditional optimization- and planning-based approaches to accommodate the need for adapting UIs for screens with different sizes, orientations and aspect ratios, and in emerging domains such as VR/AR and 3D interfaces. The proposed workshop seeks to bring together researchers interested in all kinds of computational approaches for user interfaces across different sectors as a community, including those who develop algorithms and models and those who build applications, to discuss common issues including the need for resources, opportunities for new applications, design implications for human-AI interaction in this domain, and practical challenges such as user privacy.},
keywords = {GUI, layout, constraints},
}
@misc{batmaz2021year1covid,
title = {Researchers’ and Participants’ Experiences on Distributed User Studies Conducted in the First Year of COVID-19 Pandemic},
author = {Batmaz, Anil Ufuk and Mifsud*, Domenick and Steed, Anthony and Stuerzlinger, Wolfgang and Ortega, Francisco},
booktitle = {First XR Remote Research Workshop at CHI '21},
year = {2021},
month = {May},
numpages = {3},
pdf = {papers/covidyear1ws.pdf},
url = {http://www.mat.qmul.ac.uk/xr-chi-2021},
abstract = {COVID-19 has raised significant challenges to the conduct of Virtual Reality (VR) and Augmented Reality (AR) studies. Previously, most VR and AR academic research happened in research labs at universities, where the experiments were conducted in controlled environments with specific installations and instrumentation. With the ongoing pandemic, many VR/AR researchers switched by necessity to distributed studies, where the participants participate in the studies from their own living or working spaces. This change created novel challenges for participants and experimenters. In this paper, we report some experiences with VR/AR studies conducted in the first year of COVID-19 and present recommendations for future, distributed VR/AR studies.},
keywords = {3D user interfaces, COVID-19, extended reality, virtual reality, augmented reality},
}
@misc{malekmakan2020analyzing,
title = {Analyzing the Trade-off between Selection and Navigation in VR},
author = {Malekmakan*, Morteza and Stuerzlinger, Wolfgang and Riecke, Bernhard},
booktitle = {26th Symposium on Virtual Reality Software and Technology},
publisher = {ACM},
series = {VRST '20},
howpublished = {Poster},
year = {2020},
month = {Nov},
articleno = {42},
numpages = {3},
doi = {https://doi.org/10.1145/3385956.3422123},
pdf = {papers/navseltradeoffposter.pdf},
video = {https://www.youtube.com/watch?v=8w53gKhPjWs},
abstract = {Navigation and selection are critical in very large virtual environments, such as a model of a whole city. In practice, many VR applications require both of these modalities to work together. We compare different combinations of two navigation and two selection methods in VR on selection tasks involving distant targets in a user study. The aim of our work is to discover the trade-off between navigation and selection techniques and to identify which combination leads to better interaction performance in large virtual environments. The results showed that users could complete the task faster with the fly/drive method and traveled less, compared to the teleportation method. Additionally, raycasting exhibited a better performance in terms of time and (less) distance traveled, however, it significantly increased the error rate for the selection of targets.},
keywords = {3D pointing, 3D navigation},
}
@misc{wagner2020designing,
title = {Designing Efficient Immersive Analytics Environments for Spatio-Temporal Data},
author = {Wagner Filho*, Jorge and Stuerzlinger, Wolfgang and Nedel, Luciana},
booktitle = {SIBGRAPI Workshop on Visual Analytics, Information Visualization and Scientific Visualization},
series = {WVIS '20},
howpublished = {Abstract},
year = {2020},
month = {Oct},
numpages = {1},
abstract = {The ever-growing amount of human movement data challenges us to develop new visualization techniques and to revisit existing ones with different perspectives. Traditional 2D movement visualizations focus either on the spatial or temporal aspects of the data, potentially hindering the observation of relevant features. Emerging Immersive Analytics approaches offer the opportunity to revisit a three-dimensional visualization that allows the integrated analysis of both. With the aid of stereoscopic virtual reality and 3D user interfaces, an immersive Space-Time Cube might overcome challenges that limited its adoption in the past. In this talk, we will present an overview of our ongoing research on this immersive representation, preliminary insights obtained with different navigation and interaction approaches, and our next planned steps.},
keywords = {visual analytics, immersive analytics, space-time cube, 3D visualization},
}
@misc{wagner2020visualizing,
title = {Visualizing Movement Trajectories in an Immersive Space Time-Cube},
author = {Wagner Filho*, Jorge and Stuerzlinger, Wolfgang and Nedel, Luciana},
booktitle = {VIS 2020 Workshop on Information Visualization of Geospatial Networks, Flows and Movement},
publisher = {IEEE},
series = {MoVis '20},
howpublished = {Extended Abstract},
year = {2020},
month = {Oct},
numpages = {3},
abstract = {The ever-growing amount of human movement data challenges us to develop new visualization techniques and to revisit existing ones with different perspectives. Traditional 2D movement visualizations focus either on the spatial or temporal aspects of the data, potentially hindering the observation of relevant features. Emerging Immersive Analytics approaches offer the opportunity to revisit a three-dimensional visualization that allows the integrated analysis of both. With the aid of stereoscopic virtual reality and 3D user interfaces, an immersive Space-Time Cube might overcome challenges that limited its adoption in the past. In this paper, we provide an overview of the results obtained in our ongoing research on this immersive representation. We also discuss insights obtained with different navigation and interaction approaches, and our next planned steps.},
keywords = {visual analytics, immersive analytics, space-time cube, 3D visualization},
}
@comment{c, c={currently commented out. If the corresponding journal article goes converts to misc, I might put this back in}}
@comment{steed2020covidblog,
author = {Steed, Anthony and Ortega, Francisco and Williams, Adam and Kruijff, Ernst and Stuerzlinger, Wolfgang and Batmaz, Anil Ufuk and Won, Andrea and Suma Rosenberg, Evan and Simeone, Adalberto and Hayes, Aleshia},
title = {Evaluating Immersive Experiences During COVID-19 and Beyond},
booktitle = {Interactions Blog},
month = {May},
year = {2020},
url = {http://interactions.acm.org/blog/view/enlightenment-by-lesson-},
howpublished = {Blog entry},
keywords = {3D user interfaces},
}
@misc{batmaz2020effect,
title = {Effect of Fixed and Infinite Ray Length on Distal {3D} Pointing in Virtual Reality},
author = {Batmaz, Anil Ufuk and Stuerzlinger, Wolfgang},
booktitle = {Extended Abstracts of the CHI Conference on Human Factors in Computing Systems},
publisher = {ACM},
series = {CHI EA '20},
howpublished = {Extended Abstract},
year = {2020},
month = {Apr},
numpages = {10},
doi = {https://doi.org/10.1145/3334480.3382796},
pdf = {papers/raylength.pdf},
abstract = {Ray casting is frequently used to point and select distant targets in Virtual Reality (VR) systems. In this work, we evaluate user performance in 3D pointing with two different ray casting versions: infinite ray casting, where the cursor is positioned on the surface of the first object along the ray that said ray points at, and finite ray-casting, where the cursor is attached to the ray at a fixed distance from the controller. Twelve subjects performed a Fitts' law experiment where the targets were placed 1, 2, or 3 meters away from the user. According to the results, subjects were faster and made fewer errors with the infinite ray length. Interestingly, their (effective) pointing throughput was higher when the ray length was constrained. We illustrate the advantages of both methods in immersive VR applications and provide information for practitioners and developers to choose the most appropriate ray-casting-based selection method for VR.},
keywords = {3D pointing, mid-air},
}
@misc{mutazim2020gaze,
title = {Gaze Tracking for Eye-Hand Coordination Training Systems in Virtual Reality},
author = {Mutasim*, Aunnoy K. and Stuerzlinger, Wolfgang and Batmaz, Anil Ufuk},
booktitle = {Extended Abstracts of the CHI Conference on Human Factors in Computing Systems},
publisher = {ACM},
series = {CHI EA '20},
howpublished = {Extended Abstract},
year = {2020},
month = {Apr},
numpages = {9},
doi = {https://doi.org/10.1145/3334480.3382924},
pdf = {papers/gazesportstrain.pdf},
abstract = {Eye-hand coordination training systems are used to improve user performance during fast movements in sports training. In this work, we explored gaze tracking in a Virtual Reality (VR) sports training system with a VR headset. Twelve subjects performed a pointing study with or without passive haptic feedback. Results showed that subjects spent an average of 0.55 s to visually find and another 0.25 s before their finger selected a target. We also identified that, passive haptic feedback did not increase the performance of the user. Moreover, gaze tracker accuracy significantly deteriorated when subjects looked below their eye level. Our results also point out that practitioners/trainers should focus on reducing the time spent on searching for the next target to improve their performance through VR eye-hand coordination training systems. We believe that current VR eye-hand coordination training systems are ready to be evaluated with athletes.},
keywords = {3D pointing, gaze tracking, eye-hand coordination},
}
@misc{murad2019,
title = {Effects of WER on ASR Correction Interfaces for Mobile Text Entry},
author = {Murad*, Christine and Munteanu, Cosmin and Stuerzlinger, Wolfgang},
booktitle = {International Conference on Human-Computer Interaction with Mobile Devices and Services},
publisher = {ACM},
series = {MobileHCI '19},
howpublished = {Poster},
year = {2019},
month = {Oct},
articleno = {56},
numpages = {6},
doi = {https://doi.org/10.1145/3338286.3344404},
pdf = {papers/speecheffect.pdf},
abstract = {Speech is increasingly being used as a method for text entry, especially on commercial mobile devices such as smartphones. While automatic speech recognition has seen great advances, factors like acoustic noise, differences in language or accents can affect the accuracy of speech dictation for mobile text entry. There has been some research on interfaces that enable users to intervene in the process, by correcting speech recognition errors. However, there is currently little research that investigates the effect of Automatic Speech Recognition (ASR) metrics, such as word error rate, on human performance and usability of speech recognition correction interfaces for mobile devices. This research explores how word error rates affect the usability and usefulness of touch-based speech recognition correction interfaces in the context of mobile device text entry.},
keywords = {speech recognition, text entry, errors},
}
@misc{batmaz2019effect,
title = {The Effect of Rotational Jitter on {3D} Pointing Tasks},
author = {Batmaz, Anil Ufuk and Stuerzlinger, Wolfgang},
booktitle = {Extended Abstracts of the CHI Conference on Human Factors in Computing Systems},
publisher = {ACM},
series = {CHI EA '19},
howpublished = {Extended Abstract},
year = {2019},
month = {May},
articleno = {LBW2112},
numpages = {6},
doi = {https://doi.org/10.1145/3290607.3312752},
pdf = {papers/rotjitterpointing.pdf},
abstract = {Even when in a static position, data acquired from 6 Degrees of Freedom (DoF) trackers is affected by noise, which is typically called jitter. In this study, we analyzed the effects of 3D rotational jitter on Virtual Reality (VR) controllers in a 3D Fitts' law experiment, which explored how such jitter affects user performance. Eight subjects performed a Fitts' law experiment with or without additional jitter on the cursor. Results show that while error rate significantly increased above ±0.5° jitter and subjects' effective throughput started to decrease significantly above ±1° jitter, there was no significant effect on users' movement time. Further, the Fitts's law movement time model was affected when ±2° jitter was applied to the tracker. According to these results, ±0.5° jitter on the controller does not significantly affect user performance for the tasks explored here. The results of our study can guide the design of 3D controller and tracking systems for 3D user interfaces.},
keywords = {3D pointing, jitter},
}
@misc{mutasim2019detection,
title = {Detection of Error Potentials using the Muse Headband},
author = {Mutasim*, Aunnoy K. and Stuerzlinger, Wolfgang},
booktitle = {EMBS Conference On Neural Engineering},
publisher = {IEEE},
series = {NER '19},
howpublished = {Poster},
year = {2019},
month = {Mar},
articleno = {FrPO.120},
numpages = {1},
abstract = {The detection of Error Potentials (ErrPs) has found promising applications in both neurophysiological and brain-computer interface (BCI) domains. However, the EEG acquisition devices used in such studies are mostly medical-grade and therefore expensive. Here, we propose to detect ErrPs using the cost-effective Muse headband.},
keywords = {EEG, errors},
}
@misc{nguyenvo2018actual,
title = {Do We Need Actual Walking in VR? Leaning with Actual Rotation Might Suffice for Efficient Locomotion},
author = {Nguyen-Vo*, Thinh and Pham*, Duc-Minh and Riecke, Bernhard E. and Stuerzlinger, Wolfgang and Kruijff, Ernst},
booktitle = {Spatial Cognition},
series = {SC '18},
howpublished = {Poster},
year = {2018},
month = {Sep},
abstract = {Walking has always been the most common locomotion mode for humans in the real world. For this reason, walking has also been considered as the ideal condition in a large body of VR research involving navigation. Physical walking provides body-based sensory information about both the translational and rotational components of locomotion. Though the rotational body-based information has been shown to be important for several spatial tasks, the benefit of the translational component is still unclear with mixed results from previous studies. In this study, we aim to investigate how much translational body-based sensory information is required for people to efficiently navigate the virtual world, given full rotational information. Depending on the locomotion interface used, more or less translational body-based information might be provided at different levels of accuracy. The current mixed method study investigated how different levels of translational body-based information might influence the performance of participants in a navigational search task in a HMD-based virtual environment. Participants were asked to find eight balls hidden in 16 target boxes randomly positioned in a two-meter radius circular area. To check whether there is a ball inside a target box, participants must stand right in front of the box within 0.80 meter and look at it. If there is a ball, they can collect it by touching the ball with a wand controller. The environment has been designed not to provide any additional orientation cue other than the optic flow from the fireflies. Participants could not see targets farther than two meter from them. In other words, they were not able to see all targets at a time, hence, they had to build up their spatial awareness gradually along with their locomotion. In this within-subject experiment, there were four levels of translational body-based information: none (participants used the trackpad of an HTC Vive wand controller to visually translate), upper-body leaning (participants sitting on a Swopper chair, used their upper-body leaning to control their visual translation), whole-body leaning (participants standing on a platform called NaviBoard, used their whole body leaning or stepping to navigate the virtual environment), and actual walking (participants physically walk with a wireless HMD on). Every participant performed a navigational search task once in every condition in a counter-balance order. All 24 participants finished all four trials (even with more or less fatigue). Results showed that locomotion mode had significant effects on various measures including task performance, task load, and simulator sickness. While participants performed significantly worse when they used joystick-based interface with no body-based information, compared to the other conditions, there was no significant difference between leaning-based interfaces and actual walking. More data in other measures are still in need for a more concrete conclusion. However, current results also suggested that body-based information from a leaning-based interface might suffice for a cost-effective alternative to actual walking in spatial cognition research and applications in VR.},
keywords = {3D navigation},
}
@misc{zaman2018gemniplus,
title = {{GEM-NI}+: Leveraging Difference Visualization and Multiple Displays for Supporting Multiple Complex Generative Design Alternatives},
author = {Zaman, Loutfouz and Neugebauer+, Christian and Stuerzlinger, Wolfgang and Woodbury, Robert},
booktitle = {Extended Abstracts of the CHI Conference on Human Factors in Computing Systems},
publisher = {ACM},
series = {CHI EA '18},
howpublished = {Extended Abstract},
year = {2018},
month = {Apr},
articleno = {LBW106},
numpages = {6},
doi = {https://doi.org/10.1145/3170427.3188593},
pdf = {papers/gem-ni+.pdf},
abstract = {In the conceptual design phase, designers routinely generate dozens of alternatives based on a single idea. This is especially relevant in generative design where an algorithm can generate a large number of viable design options. While solutions for creating and managing a small number of simple alternatives have been proposed, practical applications of these solutions are liMassachusetts Institute of Technologyed. As a result, we present GEM-NI+, an extension to the original GEM-NI system for creating and managing alternatives in generative design. GEM-NI+ is designed to enable editing, managing and comparing up to 24 alternatives simultaneously using a multi-monitor setup. GEM-NI+ also features a new "jamming spaces" technique for assigning individual monitors into different visualization states, which makes organization of a large workspace easier. Finally, GEM-NI+ enables comparison of complex alternatives using recursive group node difference visualization.},
keywords = {alternatives, design},
}
@misc{machuca2018stereo,
title = {Do Stereo Display Deficiencies Affect {3D} Pointing?},
author = {Barrera Machuca*, Mayra D. and Stuerzlinger, Wolfgang},
booktitle = {Extended Abstracts of the CHI Conference on Human Factors in Computing Systems},
publisher = {ACM},
series = {CHI EA '18},
howpublished = {Extended Abstract},
year = {2018},
month = {Apr},
articleno = {LBW126},
numpages = {6},
doi = {https://doi.org/10.1145/3170427.3188540},
abstract = {Previous work has documented that limitations of current stereo display systems affect depth perception. We performed an experiment to understand if such stereo display deficiencies affect 3D pointing for targets in front of a screen and close to the user, i.e., in peri-personal space. Our experiment compares isolated movements with and without a change in visual depth for virtual targets. Results indicate that selecting targets along the depth axis is slower and has less throughput than laterally positioned targets.},
keywords = {3D pointing, mid-air, stereo},
}
@misc{hashemian2018investigating,
title = {Investigating a Sparse Peripheral Display in a Head-Mounted Display for VR Locomotion},
author = {Hashemian*, Abraham and Kitson*, Alexandra and Nguyen-Vo*, Thinh and Benko, Hrvoje and Stuerzlinger, Wolfgang and Riecke, Bernhard E.},
booktitle = {Conference on Virtual Reality and {3D} User Interfaces},
publisher = {IEEE},
series = {VR '18},
howpublished = {Poster},
year = {2018},
month = {Mar},
pages = {571-572},
doi = {https://doi.org/10.1109/VR.2018.8446345},
abstract = {Head-Mounted Displays (HMDs) provide immersive experiences for virtual reality. However, their field of view (FOV) is still relatively small compared to the human eye, which adding sparse peripheral displays (SPDs) could address. We designed a new SPD, SparseLightVR2, which increases the HMD's FOV to 180° horizontally. We evaluated SparseLightVR2 with a study (N=29) by comparing three conditions: 1) no SPD, where the peripheral display (PD) was inactive; 2) extended SPD, where the PD provided visual cues consistent with and extending the HMD's main screen; and 3) counter-vection SPD, where the PD's visuals were flipped horizontally during VR travel to provide optic flow in the opposite direction of the travel. The participants experienced passive motion on a linear path and reported introspective measures such as sensation of self-motion. Results showed, compared to no SPD, both extended and counter-vection SPDs provided a more natural experience of motion, while extended SPD also enhanced vection intensity and believability of movement. Yet, visually induced motion sickness (VIMS) was not affected by display condition. To investigate the reason behind these non-significant results, we conducted a follow-up study and had users increase peripheral counter-vection visuals on the central HMD screen until they nulled out vection. Our results suggest extending HMDs through SPDs enhanced vection, naturalness, and believability of movement without enhancing VIMS, but reversed SPD motion cues might not be strong enough to reduce vection and VIMS.},
keywords = {3D navigation},
}
@misc{sun2018selecting,
title = {Selecting Invisible Objects},
author = {Sun*, Junwei and Stuerzlinger, Wolfgang},
booktitle = {Conference on Virtual Reality and {3D} User Interfaces},
publisher = {IEEE},
series = {VR '18},
howpublished = {Poster},
year = {2018},
month = {Mar},
pages = {697-698},
doi = {https://doi.org/10.1109/VR.2018.8446199},
abstract = {We augment 3D user interfaces with a new technique that enables users to select objects that are invisible from the current viewpoint. We present a layer-based method for selecting invisible objects, which works for arbitrary objects and scenes. The user study shows that with our new techniques users can easily select hidden objects.},
keywords = {3D positioning, transparency},
}
@misc{machuca2017multiplanes,
title = {Multiplanes: Assisted Freehand VR Drawing},
author = {Barrera Machuca*, Mayra D. and Asente, Paul and Lu*, Jingwan and Kim, Byungmoon and Stuerzlinger, Wolfgang},
booktitle = {Adjunct Publication of the 30th Annual ACM Symposium on User Interface Software and Technology},
publisher = {ACM},
series = {UIST '17},
howpublished = {Demonstration},
year = {2017},
month = {Oct},
pages = {1-3},
doi = {https://doi.org/10.1145/3131785.3131794},
abstract = {Multiplanes is a virtual reality (VR) drawing system that provides users with the flexibility of freehand drawing and the ability to draw perfect shapes. Through the combination of both beautified and 2D drawing, Multiplanes addresses challenges in creating 3D VR drawings. To achieve this, the system beautifies user's strokes based on the most probable, intended shapes while the user is drawing them. It also automatically generates snapping planes and beautification trigger points based on previous and current strokes and the current controller pose. Based on geometrical relationships to previous strokes, beautification trigger points act as guides inside the virtual environment. Users can hit these points to (explicitly) trigger a stroke beautification. In contrast to other systems, when using Multiplanes, users do not need to manually set or do any kind of special gesture to activate, such guides allowing the user to focus on the creative process.},
keywords = {3D sketching, 3D drawing, 3D modeling, 3D user interfaces},
}
@misc{machuca2018fluidvr,
title = {Fluid VR: Extended Object Associations for Automatic Mode Switching in Virtual Reality},
author = {Barrera Machuca*, Mayra D. and Sun*, Junwei and Pham*, Duc-Minh and Stuerzlinger, Wolfgang},
booktitle = {Conference on Virtual Reality and {3D} User Interfaces},
publisher = {IEEE},
series = {3DUI '18},
howpublished = {3DUI contest entry},
year = {2018},
month = {Mar},
pages = {846-847},
doi = {https://doi.org/10.1109/VR.2018.8446437},
abstract = {Constrained interaction and navigation methods for virtual reality reduce the complexity of the interaction. Yet, with previously presented solutions, users need to learn new interaction tools or remember different actions for changing between different interaction methods. In this paper, we propose Fluid VR, a new 3D user interface for interactive virtual environments that lets users seamlessly transition between navigation and selection. Based on the selected object's properties, Fluid VR applies specific constraints to the interaction or navigation associated with the object. This way users have a better control of their actions, without having to change tools or activate different modes of interaction.},
keywords = {3D manipulation},
}
@misc{nguyenvo2017investigating,
title = {Investigating the Effect of Simulated Reference Frames on Spatial Orientation in Virtual Reality},
author = {Nguyen-Vo*, Thinh and Riecke, Bernhard E. and Stuerzlinger, Wolfgang},
booktitle = {Second Workshop on Models and Representations in Spatial Cognition},
series = {SC '17},
howpublished = {Poster},
year = {2017},
month = {Apr},
url = {https://osf.io/bs5ug},
abstract = {Despite recent advances in virtual reality, locomotion in a virtual environment is still restricted because of spatial disorientation. Previous research has shown the benefits of reference frames in maintaining spatial orientation. Here, we propose using a visually simulated reference frame in virtual reality to provide users with a better sense of direction in landmark-free virtual environments. Visually overlaid rectangular frames simulate different variations of frames of reference. We investigated how two different types of visually simulated reference frames might benefit in a navigational search task through a mixed-method study. Results showed that the presence of a reference frame significantly affects participants' performance in a navigational search task. Though the egocentric frame of reference (simulated CAVE) that translates with the observer did not significantly help, an allocentric frame of reference (a simulated stationary room) significantly improved user performance both in navigational search time and overall travel distance. Our study suggests that adding a variation of the reference frame to virtual reality applications might be a cost-effective solution to enable more effective locomotion in virtual reality.},
keywords = {cave, 3D navigation},
}
@misc{nguyenvo2017moving,
title = {Moving in a Box: Improving Spatial Orientation in Virtual Reality using Simulated Reference Frames},
author = {Nguyen-Vo*, Thinh and Riecke, Bernhard E. and Stuerzlinger, Wolfgang},
booktitle = {Symposium on {3D} User Interfaces},
publisher = {IEEE},
series = {3DUI '17},
howpublished = {Poster},
year = {2017},
month = {Mar},
pages = {846-847},
doi = {https://doi.org/10.1109/3DUI.2017.7893344},
abstract = {Despite recent advances in virtual reality, locomotion in a virtual environment is still restricted because of spatial disorientation. Previous research has shown the benefits of reference frames in maintaining spatial orientation. Here, we propose using a visually simulated reference frame in virtual reality to provide users with a better sense of direction in landmark-free virtual environments. Visually overlaid rectangular frames simulate different variations of frames of reference. We investigated how two different types of visually simulated reference frames might benefit in a navigational search task through a mixed-method study. Results showed that the presence of a reference frame significantly affects participants' performance in a navigational search task. Though the egocentric frame of reference (simulated CAVE) that translates with the observer did not significantly help, an allocentric frame of reference (a simulated stationary room) significantly improved user performance both in navigational search time and overall travel distance. Our study suggests that adding a variation of the reference frame to virtual reality applications might be a cost-effective solution to enable more effective locomotion in virtual reality.},
keywords = {cave, 3D navigation},
}
@misc{teather2016tutorial,
title = {SIVARG: Spatial Interaction in Virtual/Augmented Reality and Games},
author = {Teather, Robert and Stuerzlinger, Wolfgang},
booktitle = {International Conference on Interactive Surfaces and Spaces},
publisher = {ACM},
series = {ISS '16},
howpublished = {Tutorial},
year = {2016},
month = {Nov},
pages = {525–528},
doi = {https://doi.org/10.1145/2992154.2996364},
abstract = {We propose a workshop soliciting submissions on the topics of spatial and 3D interaction in highly fidelity graphical interactive systems, especially video games and virtual reality systems. Topics will cover all aspects of interaction in these systems, including input-related issues such as efficient control mappings, spatial input device features (e.g., low latency, input noise, etc.), as well as output-related issues such as display hardware features (e.g., stereoscopic rendering, head-tracking), and information visualization (e.g., game HUDs for status information). We propose to include both position papers, as well as papers including at least preliminary studies on issues in these areas.},
keywords = {3D user interface},
}
@misc{sun2016shiftsliding,
title = {{Shift-Sliding} and {Depth-Pop} for {3D} Positioning},
author = {Sun*, Junwei and Stuerzlinger, Wolfgang and Shuralyov*, Dmitri},
booktitle = {Symposium on Spatial User Interaction},
publisher = {ACM},
series = {SUI '16},
howpublished = {Demonstration},
year = {2016},
month = {Oct},
pages = {165-165},
doi = {https://doi.org/10.1145/2983310.2991067},
abstract = {We introduce two new 3D positioning methods. The techniques enable rapid, yet easy-to-use positioning of objects in 3D scenes. With SHIFT-Sliding, the user can override the default assumption of contact and non-collision for sliding, and lift objects into the air or make them collide with other objects. DEPTH-POP maps mouse wheel actions to all object positions along the mouse ray, where the object meets the default assumptions for sliding. We will demonstrate the two methods in a desktop environment with the mouse and keyboard as interaction devices. Both methods use frame buffer techniques for efficiency.},
keywords = {3D manipulation, 3D positioning},
}
@misc{machuca2016history,
title = {{3D} Camera Pose History Visualization},
author = {Barrera Machuca*, Mayra D. and Stuerzlinger, Wolfgang},
booktitle = {Symposium on Spatial User Interaction},
publisher = {ACM},
series = {SUI '16},
howpublished = {Poster},
year = {2016},
month = {Oct},
pages = {183-183},
doi = {https://doi.org/10.1145/2983310.2989185},
abstract = {We present a 3D camera pose history visualization that can assist users of CAD software's, virtual worlds and scientific visualizations to revisit their navigation history. The contribution of this system is to enable users to move more efficiently through the virtual environment so they can focus on their main activity.},
keywords = {3D navigation},
}
@misc{sun2016floatsliding,
title = {{FLOAT}-Sliding for {3D} Positioning},
author = {Sun*, Junwei and Stuerzlinger, Wolfgang},
booktitle = {Graphics Interface},
series = {GI '16},
howpublished = {Poster},
year = {2016},
month = {Jun},
numpages = {2},
abstract = {We describe a new technique for 3D positioning, based on the typical sliding technique. We assume that by default object stay in contact with the scene's front surfaces and do not interpenetrate other objects. To ensure precision, we permit manipulation only for at least partially visible objects. With our new FLOAT-Sliding method the user can override the default contact assumption and lift objects into the air or make them collide with other objects. For efficiency, FLOAT-Sliding uses frame buffer techniques.},
keywords = {3D manipulation, 3D positioning},
}
@misc{seim2016passive,
title = {Can Passive Haptic Learning Help Users Become More Skilled Keyboard Typists?},
author = {Seim*, Caitlyn and Doering+, Nick and Stuerzlinger, Wolfgang and Starner, Thad},
booktitle = {CHI 2016 Workshop on Inviscid Text Entry and Beyond},
series = {Textentry '16},
howpublished = {Extended Abstract},
year = {2016},
month = {May},
numpages = {4},
url = {http://www.textentry.org/chi2016},
abstract = {Passive Haptic Learning (PHL) can be used to teach text entry systems such as Braille and Morse code where each finger controls at most one key. However, most keyboards have a spatial layout where each finger controls multiple keys, and each key is labeled. Can PHL help users improve their skill at these text entry systems? We are investigating these questions by using passive stimuli to help users learn a randomized layout of the number pad. This research is aimed at laying the groundwork for creating a system to help individuals improve their QWERTY keyboard typing.},
keywords = {haptics, learning},
}
@misc{bjerre2015transition,
title = {Transition Times for Manipulation Tasks in Hybrid Interfaces},
author = {Bjerre+, Per and Christensen+, Allan and Pedersen+, Simon André and Pedersen+, Andreas Køllund and Stuerzlinger, Wolfgang},
booktitle = {3rd Symposium on Spatial User Interaction},
publisher = {ACM},
series = {SUI '15},
howpublished = {Poster},
year = {2015},
month = {Aug},
pages = {137-137},
doi = {https://doi.org/10.1145/2788940.2794358},
pdf = {papers/transitionsposter.pdf},
abstract = {Previous work has shown that uninstrumented in-air interaction is slower and not as precise for pointing tasks compared to the mouse. Yet, there are interaction scenarios where it is preferable or advantageous to use in-air input. Therefore, we examine a three-device hybrid setup involving the mouse, keyboard, and a Leap Motion. We performed a user study to quantify the costs associated with transitioning between these interaction devices and also for performing simple 2D manipulation tasks using the mouse and Leap Motion. We discovered that transitioning to and from the Leap Motion takes on average 0.87 seconds longer than transitions between the mouse and keyboard.},
keywords = {3D manipulation, 3D positioning},
}
@misc{arif2015smart,
title = {A Smart-Restorable Backspace to Facilitate Text Entry Error Correction},
author = {Arif, Ahmed Sabbir and Stuerzlinger, Wolfgang and Mazalek, Ali and Kim, Sunjun and Lee, Geehyuk},
booktitle = {CHI 2015 Workshop on Text Entry on the Edge},
series = {Textentry '15},
howpublished = {Extended Abstract},
year = {2015},
month = {Apr},
numpages = {4},
url = {http://www.textentry.org/chi2015},
abstract = {Selection is one of the most basic interaction methods in 3D user interfaces. Previous work has shown that visual feedback improves such actions. However, haptic feedback can increase the realism or also help for occluded targets. Here we investigate if 3D virtual hand selection benefits from electrical muscle stimulation (EMS) and vibration. In our experiment we used a 3D version of a Fitts' task to compare visual, EMS, vibration, and no feedback. The results demonstrate that both EMS and vibration are reasonable alternatives to visual feedback. We also found good user acceptance for both technologies.},
keywords = {text entry, errors, backspace},
}
@misc{pfeiffer2015ems,
title = {{3D} Virtual Hand Selection with {EMS} and Vibration Feedback},
author = {Pfeiffer*, Max and Stuerzlinger, Wolfgang},
booktitle = {33rd Annual Conference Extended Abstracts on Human Factors in Computing Systems},
publisher = {ACM},
series = {CHI EA '15},
howpublished = {Extended Abstract},
year = {2015},
month = {Apr},
pages = {1361-1366},
doi = {https://doi.org/10.1145/2702613.2732763},
abstract = {Selection is one of the most basic interaction methods in 3D user interfaces. Previous work has shown that visual feedback improves such actions. However, haptic feedback can increase the realism or also help for occluded targets. Here we investigate if 3D virtual hand selection benefits from electrical muscle stimulation (EMS) and vibration. In our experiment we used a 3D version of a Fitts' task to compare visual, EMS, vibration, and no feedback. The results demonstrate that both EMS and vibration are reasonable alternatives to visual feedback. We also found good user acceptance for both technologies.},
keywords = {3D positioning, haptics},
}
@misc{stuerzlinger2015tivs,
title = {TIVS: Temporary Immersive Virtual Environment at Simon Fraser University: A Non-permanent CAVE},
author = {Stuerzlinger, Wolfgang and Pavlovych*, Andriy and Nywton+, Dayson},
booktitle = {1st Workshop on Everyday Virtual Reality},
publisher = {IEEE},
series = {WEVR '15},
year = {2015},
month = {Mar},
pages = {23-28},
doi = {https://doi.org/10.1109/WEVR.2015.7151691},
pdf = {papers/tivs.pdf},
video = {videos/TIVS.mp4},
abstract = {CAVE systems are an immersive environment that surrounds one or more viewers with multiple large screens, which portray a virtual 3D environment. CAVEs use generally between three and six sides and are thus effectively permanent installations, due to the required floor and room space. We describe TIVS, the Temporary Immersive Virtual environment at Simon Fraser University, a system whose defining feature is that it does not consume any permanent floor space. Yet, TIVS can be in operation in less than a minute. Viewers sit on swivel chairs in the center of an 8' × 6' space, where TIVS's frame is mounted onto the ceiling. The bottom of said frame is 7' above the ground, making it easy for people to walk below it. The screens mounted on the frame are rolled down whenever the system is being used and are otherwise stowed away. That frees the floor space for other uses when the system is not in use. The projection geometry ensures that people sitting in the center area of the space do not cast shadows onto the screens. A tracking system attached to the frame provides for head tracking. Overall, the non-permanent nature of the system makes it surprisingly easy to integrate Virtual Reality into everyday environments.},
keywords = {immersive display system, large display system, cave},
}
@misc{codddowney2014leaplook,
title = {{LeapLook}: A Free-hand Gestural Travel Technique using the Leap Motion Finger Tracker},
author = {Codd-Downey*, Robert and Stuerzlinger, Wolfgang},
booktitle = {2nd Symposium on Spatial User Interaction},
publisher = {ACM},
series = {SUI '14},
howpublished = {Poster},
year = {2014},
month = {Oct},
pages = {153-153},
doi = {https://doi.org/10.1145/2659766.2661218},
abstract = {Contactless motion sensing devices enable a new form of input that does not encumber the user with wearable tracking equipment. We present a novel travel technique using the Leap Motion finger tracker which adopts a 2DOF steering metaphor used in traditional mouse and keyboard navigation in many 3D computer games.},
keywords = {3D navigation},
}
@misc{teather2014depthcues,
title = {Depth Cues and Mouse-Based {3D} Target Selection},
author = {Teather*, Robert J. and Stuerzlinger, Wolfgang},
booktitle = {2nd Symposium on Spatial User Interaction},
publisher = {ACM},
series = {SUI '14},
howpublished = {Poster},
year = {2014},
month = {Oct},
pages = {156-156},
doi = {https://doi.org/10.1145/2659766.2661221},
abstract = {We investigated mouse-based 3D selection using one-eyed cursors, evaluating stereo and head-tracking. Stereo cursors significantly reduced performance for targets at different depths, but the one-eyed cursor yielded some discomfort.},
keywords = {3D pointing},
}
@misc{pavlovych2014tivx,
title = {TIVX: Temporary Immersive Virtual Environment: A Non-Permanent CAVE},
author = {Pavlovych*, Andriy and Nywton+, Dayson and Stuerzlinger, Wolfgang},
booktitle = {GRAND NCE Conference},
series = {GRAND '14},
howpublished = {Demonstration},
year = {2014},
month = {May},
url = {http://grand-nce.ca/archives/annual-conference/grand-2014/program/poster-demo-experiences.html},
keywords = {immersive display system, cave},
}
@misc{arif2014howdo,
title = {How Do Users Interact with an Error Prone In-air Gesture Recognizer?},
author = {Arif*, Ahmed Sabbir and Stuerzlinger, Wolfgang and de Mendonça Filho+, Euclides José and Gordynski, Alec},
booktitle = {CHI Workshop on Gesture-based Interaction Design: Communication and Cognition},
howpublished = {Extended Abstract},
year = {2014},
month = {May},
numpages = {4},
pdf = {papers/errorpronegestures.pdf},
abstract = {We present results of two pilot studies that investigated human error behaviours with an error prone in-air gesture recognizer. During the studies, users performed a small set of simple in-air gestures. In the first study, these gestures were abstract. The second study associated concrete tasks with each gesture. Interestingly, the error patterns observed in the two studies were substantially different.},
keywords = {gestures, errors, mid-air},
}
@misc{arif2014error,
title = {Error Behaviours in an Unreliable In-Air Gesture Recognizer},
author = {Arif*, Ahmed Sabbir and Stuerzlinger, Wolfgang and de Mendonça Filho+, Euclides José and Gordynski, Alec},
booktitle = {Extended Abstracts on Human Factors in Computing Systems},
publisher = {ACM},
series = {CHI EA '14},
howpublished = {Extended Abstract},
year = {2014},
month = {May},
pages = {1603–1608},
doi = {https://doi.org/10.1145/2559206.2581188},
pdf = {papers/unreliableairgestures.pdf},
abstract = {This article presents results of two pilot studies that investigated error behaviours with an unreliable in-air gesture recognizer. During the studies, users performed a small set of simple in-air gestures. In the first study, these gestures were abstract. The second study associated concrete tasks with each gesture. The error patterns in the two studies were substantially different.},
keywords = {mid-air, gestures, errors},
}
@misc{teather2014fishtank,
title = {Fishtank Fitts: A Desktop VR Testbed for Evaluating {3D} Pointing Techniques},
author = {Teather*, Robert J. and Stuerzlinger, Wolfgang and Pavlovych*, Andriy},
booktitle = {Extended Abstracts on Human Factors in Computing Systems},
publisher = {ACM},
series = {CHI EA '14},
howpublished = {Extended Abstract},
year = {2014},
month = {May},
pages = {519–522},
doi = {https://doi.org/10.1145/2559206.2574810},
pdf = {papers/fishtankfittsdemo.pdf},
video = {videos/3DfishTankFitts.mp4},
abstract = {We present a desktop or "fish tank" virtual reality system for evaluating 3D selection techniques. Motivated by the successful application of Fitts' law to 2D pointing evaluation, the system provides a testbed for consistent evaluation of 3D point-selection techniques. The primary design consideration of the system was to enable direct and fair comparison between 2D and 3D pointing techniques. To this end, the system presents a 3D version of the ISO 9241-9 pointing task. Targets can be displayed stereoscopically, with head-coupled viewing, and at varying depths. The system also supports various input devices, including the mouse as well as 3D trackers in direct touch and remote pointing modes.},
keywords = {3D pointing},
}
@misc{stuerzlinger2013considerations,
title = {Considerations for Targets in {3D} Pointing Experiments},
author = {Stuerzlinger, Wolfgang},
booktitle = {Interactive Surfaces for Interaction with Stereoscopic {3D}},
series = {ISIS3D '13},
howpublished = {Extended Abstract},
year = {2013},
month = {Oct},
numpages = {4},
pdf = {papers/3Dtargets.pdf},
abstract = {We identify various tradeoffs around 3D pointing experiments based on Fitts' law and the ISO9241-9 methodology. The advantages and disadvantages of each approach are analyzed and compared against each other. We present some recommendations for 3D pointing experiments and avenues of future work.},
keywords = {3D pointing},
}
@misc{laldin2013up,
title = {Up- and Downwards Motions in {3D} Pointing},
author = {Laldin*, Sidrah and Teather*, Robert J. and Stuerzlinger, Wolfgang},
booktitle = {Symposium on Spatial User Interaction},
series = {SUI '13},
howpublished = {Poster},
year = {2013},
month = {Jul},
pages = {89-89},
doi = {https://doi.org/10.1145/2491367.2491393},
pdf = {papers/updownpointing.pdf},
abstract = {We present an experiment that examines 3D pointing in fish tank VR using the ISO 9241-9 standard. The experiment used three pointing techniques: mouse, ray, and touch using a stylus. It evaluated user pointing performance with stereoscopically displayed varying height targets above an upward-facing display. Results show differences in upwards and downwards motions for the 3D touch technique.},
keywords = {3D pointing},
}
@misc{bajer2013effects,
title = {Effects of Stereo and Head Tracking in {3D} Selection Tasks},
author = {Bajer*, Bartosz and Teather*, Robert J. and Stuerzlinger, Wolfgang},
booktitle = {Symposium on Spatial User Interaction},
series = {SUI '13},
howpublished = {Poster},
year = {2013},
month = {Jul},
pages = {77-77},
doi = {https://doi.org/10.1145/2491367.2491392},
pdf = {papers/headstereopointing.pdf},
abstract = {We report a 3D selection study comparing stereo and head-tracking with both mouse and pen pointing. Results indicate stereo was primarily beneficial to the pen mode, but slightly hindered mouse speed. Head tracking had fewer noticeable effects.},
keywords = {3D pointing},
}
@misc{stuerzlinger2013keynote,
title = {Modern Spatial and {3D} User Interfaces},
author = {Stuerzlinger, Wolfgang},
booktitle = {International Conference on Information Society},
publisher = {IEEE},
series = {iSociety '13},
howpublished = {Keynote abstract},
year = {2013},
month = {Jun},
pages = {9-9},
url = {https://ieeexplore.ieee.org/abstract/document/6636326},
abstract = {Three-dimensional (3D) user interfaces are popular in movies. Many current technologies enable people to interact with 3D content, also in computer games. I review the main ideas behind 3D user interfaces and present innovative solutions based on the capabilities and limitations of both humans and technologies.},
keywords = {3D user interfaces},
}
@comment{c, c={this has to be before the GRAND poster entry, as it attracted more citations than the poster}}
@misc{scheurich2013onehandedmating,
title = {A One-Handed Multi-Touch Mating Method for {3D} Rotations},
author = {Scheurich*, Doug and Stuerzlinger, Wolfgang},
booktitle = {Extended Abstracts on Human Factors in Computing Systems},
publisher = {ACM},
series = {CHI EA '13},
howpublished = {Extended Abstract},
year = {2013},
month = {Apr},
pages = {1623-1628},
doi = {https://doi.org/10.1145/2468356.2468646},
pdf = {papers/touchrotwip.pdf},
abstract = {Rotating 3D objects is a difficult task. We present a new rotation technique based on collision-free "mating" to expedite 3D rotations. It is specifically designed for one-handed interaction on tablets or touchscreens. A user study found that our new technique decreased the time to rotate objects in 3D by more than 60% in situations where objects align. We found similar results when users translated and rotated objects in a 3D scene. Also, angle errors were 35% less with mating. In essence, our new rotation technique improves both the speed and accuracy of common 3D rotation tasks.},
keywords = {3D manipulation},
}
@misc{scheurich2013mating,
title = {A One-Handed Multi-Touch Mating Method for {3D} Rotations},
author = {Scheurich*, Doug and Stuerzlinger, Wolfgang},
booktitle = {GRAND NCE Conference},
series = {GRAND '13},
howpublished = {Poster},
year = {2013},
month = {May},
abstract = {Rotating 3D objects is a difficult task. We present a new rotation technique based on collision-free "mating" to expedite 3D rotations. It is specifically designed for one-handed interaction on tablets or touchscreens. A user study found that our new technique decreased the time to rotate objects in 3D by more than 60% in situations where objects align. We found similar results when users translated and rotated objects in a 3D scene. Also, angle errors were 35% less with mating. In essence, our new rotation technique improves both the speed and accuracy of common 3D rotation tasks.},
keywords = {3D manipulation},
}
@misc{teather2013pointingtargets,
title = {Pointing at {3D} Target Projections with One-Eyed and Stereo Cursors},
author = {Teather*, Robert J. and Stuerzlinger, Wolfgang},
booktitle = {GRAND NCE Conference},
series = {GRAND '13},
howpublished = {Poster},
year = {2013},
month = {May},
abstract = {We present a study of cursors for selecting 2D-projected 3D targets. We compared a stereo- and mono-rendered (one-eyed) cursor using two mouse-based and two remote pointing techniques in a 3D Fitts' law pointing experiment. The first experiment used targets at fixed depths. Results indicate that one-eyed cursors only improve screen-plane pointing techniques, and that constant target depth does not influence pointing throughput. A second experiment included pointing between targets at varying depths and used only "screen-plane" pointing techniques. Our results suggest that in the absence of stereo cue conflicts, screen-space projections of Fitts' law parameters (target size and distance) yield constant throughput despite target depth differences and produce better models of performance.},
keywords = {3D pointing},
}
@misc{zaman2013alternatives,
title = {Alternatives in Generative Design},
author = {Zaman*, Loutfouz and Stuerzlinger, Wolfgang},
booktitle = {GRAND NCE Conference},
series = {GRAND '13},
howpublished = {Poster},
year = {2013},
month = {May},
keywords = {alternatives, design},
}
@misc{teather2012system,
title = {A System for Evaluating {3D} Pointing Techniques},
author = {Teather*, Robert J. and Stuerzlinger, Wolfgang},
booktitle = {18th Symposium on Virtual Reality Software and Technology},
publisher = {ACM},
series = {VRST '12},
howpublished = {Demonstration},
year = {2012},
month = {Dec},
pages = {209-210},
doi = {https://doi.org/10.1145/2407336.2407383},
pdf = {papers/3dpointingsystem.pdf},
abstract = {This demo presents a desktop VR system for evaluating human performance in 3D pointing tasks. The system supports different input devices (e.g., mouse and 6DOF remote pointer), pointing techniques (e.g., screen-plane and depth cursors), and cursor visualization styles (e.g., one-eyed and stereo 3D cursors). The objective is to comprehensively compare all combinations of these conditions. We especially focus in on fair and direct comparisons between 2D and 3D pointing tasks. Finally, our system includes a new pointing technique that outperforms standard ray pointing.},
keywords = {3D pointing},
}
@comment{c, c={leave the "_stuerzlinger" in the ID to enable umlaut-free search!}}
@misc{zeidler_stuerzlinger2012chinz,
title = {The Auckland Layout Editor: An Improved GUI Layout Specification Process},
author = {Zeidler*, Clemens and Lutteroth, Christof and Weber, Gerald and Stürzlinger, Wolfgang},
booktitle = {13th International Conference of the NZ Chapter of the ACM's Special Interest Group on Human-Computer Interaction},
series = {CHINZ '12},
howpublished = {Demonstration},
year = {2012},
month = {Jul},
pages = {103-103},
doi = {https://doi.org/10.1145/2379256.2379287},
abstract = {Constraint-based layout managers are more powerful than the common grid, grid-bag, and group layout managers. However, they are also more complex and come with potential problems such as over-constrained specifications and overlap in a GUI. Current GUI builders have little support for layout constraints, and it is not clear how such constraints can be made easily accessible to GUI designers. We will demonstrate a GUI builder - the Auckland Layout Editor (ALE) - that addresses these challenges, by allowing GUI designers to specify constraint-based layouts using only simple mouse operations. ALE guarantees that all operations lead to sound specifications, making sure that the layout is solvable and non-overlapping. To achieve the latter, we propose an algorithm that automatically generates the missing constraints that are necessary to keep a layout non-overlapping. Today's applications need to run on multiple devices with different screen sizes. For this a layout must have a good appearance at different sizes. To aid the designer in creating a layout with good resizing behavior, we propose a novel automatic layout preview, which displays the layout at its minimal and at an enlarged size chosen to visualize layout problems directly.},
keywords = {GUI, layout},
}
@misc{das2012comparing,
title = {Comparing Cognitive Effort in Spatial Learning of Text Entry Keyboards and {ShapeWriters}},
author = {Das*, Arindam and Stuerzlinger, Wolfgang},
booktitle = {Working Conference on Advanced Visual Interfaces},
series = {AVI '12},
howpublished = {Extended Abstract},
year = {2012},
month = {May},
pages = {649-652},
doi = {https://doi.org/10.1145/2254556.2254676},
pdf = {papers/effort2learn.pdf},
abstract = {Stable structured layouts of buttons are a primary means of control for input in current graphical user interfaces. Such layouts are ubiquitous - from tiny iPhone screens to large kiosk screens in the malls - they are found everywhere. Yet, there has been relatively little theoretical account that compares the impact of cognitive effort on learning such stable layouts. In this paper, we demonstrate that prior empirical results on cognitive effort in learning stable layouts are theoretically predictable through the memory activation model of a cognitive architecture, ACT-R. We go beyond previous work by quantitatively comparing the level of cognitive effort in terms of a newly introduced parameter in the declarative memory model of ACT-R. We theoretically compare the cognitive effort of two different layouts of graphical buttons with respect to their label representativeness in the domains of traditional keyboard and ShapeWriter.},
keywords = {text entry, learning},
}
@misc{teather2012cursors,
title = {Cursors for {3D} Pointing},
author = {Teather*, Robert J. and Stuerzlinger, Wolfgang},
booktitle = {The 3rd Dimension of CHI ({3DCHI}): Touching and Designing {3D} User Interfaces},
series = {3DCHI '12},
howpublished = {Extended Abstract},
year = {2012},
month = {May},
numpages = {8},
pdf = {papers/cursor3Dpointingshort.pdf},
abstract = {We present a study of cursors for 3D pointing/selection interfaces. We compared a stereo- and mono-rendered (one-eyed) cursor used with two mouse-based and two remote pointing techniques. This comparison was performed in a 3D Fitts' law pointing experiment with varying target depths. Results indicate that the one-eyed cursor is beneficial only for some pointing techniques. While the mouse-based techniques performed best, our new ray-screen technique outperforms traditional ray pointing. This is likely because it is less affected by target depth.},
keywords = {3D pointing},
}
@misc{arif2012how,
title = {How Do Users Adapt to a Faulty System?},
author = {Arif*, Ahmed Sabbir and Stuerzlinger, Wolfgang},
booktitle = {CHI Workshop on Designing and Evaluating Text Entry Methods},
series = {Textentry '12},
howpublished = {Extended Abstract},
year = {2012},
month = {May},
numpages = {4},
url = {http://www.textentry.org/chi2012},
pdf = {papers/faultysystemshort.pdf},
abstract = {We investigate how users gradually adapt to a faulty system and how the system error rate influences this adaptation process. We present results of a study that verifies that a user's learning rate to compensate for system errors depends on how erroneous that system is – they learn to avoid erroneous actions faster if errors occur more frequently.},
keywords = {gestures, errors},
}
@misc{stuerzlinger2012stereo,
title = {Stereo vs. One-Eyed Cursors for {3D} Pointing and Implications for Touch Interfaces},
author = {Stuerzlinger, Wolfgang and Teather*, Robert J.},
booktitle = {Touching the 3rd Dimension},
series = {Dagstuhl Seminar 12151},
howpublished = {Abstract},
year = {2012},
month = {Apr},
doi = {https://doi.org/10.4230/DagRep.2.4.1},
abstract = {We compare remote pointing and mouse pointing techniques using both a stereo- and mono-rendered cursor in a Fitts' law pointing experiment with varying target depths in a 3D scene. Results indicate that mouse-based techniques perform best and that the one-eyed cursor is beneficial only for some pointing techniques. We discuss the implications for 3D touch interfaces.},
keywords = {3D pointing},
}
@misc{zaman2012evaluation,
title = {Evaluation of a {3D} {UI} with Different Input Technologies},
author = {Zaman*, Loutfouz and Shuralyov*, Dmitri and Teather*, Robert J. and Stuerzlinger, Wolfgang},
booktitle = {Symposium on {3D} User Interfaces},
publisher = {IEEE},
series = {3DUI '12},
howpublished = {Extended Abstract},
year = {2012},
month = {Mar},
pages = {173-174},
doi = {https://doi.org/10.1109/3DUI.2012.6184217},
pdf = {papers/evalwiimouse.pdf},
abstract = {We present two studies of navigation and object manipulation in a virtual supermarket. The first study compared a mouse and keyboard setup to a game hardware setup using a Wii Remote, Wii Balance Board and a dancemat. The second study used more game-like software interfaces for both conditions and used only the Wii Remote and Nunchuk in the game-hardware setup. The mouse setup was around 36% faster in both studies. In the first study the mouse setup was 98% more accurate; no difference in accuracy was found in the second study.},
keywords = {3D pointing},
}
@misc{teather2012investigating,
title = {Investigating One-Eyed and Stereo Cursors for {3D} Pointing Tasks},
author = {Teather*, Robert J. and Stuerzlinger, Wolfgang},
booktitle = {Symposium on {3D} User Interfaces},
publisher = {IEEE},
series = {3DUI '12},
howpublished = {Extended Abstract},
year = {2012},
month = {Mar},
pages = {167-168},
doi = {https://doi.org/10.1109/3DUI.2012.6184214},
pdf = {papers/cursor3Dpointingposter.pdf},
abstract = {We compared two remote pointing techniques to two mouse pointing techniques using both with a stereo- and mono-rendered cursor. These were compared using a Fitts' law pointing experiment with varying target depths in a 3D scene. Results indicate that mouse-based techniques performed best and that the one-eyed cursor is beneficial only for some pointing techniques.},
keywords = {3D pointing},
}
@misc{stuerzlinger2011onoffline,
title = {On- and Off-Line User Interfaces for Collaborative Cloud Services},
author = {Stuerzlinger, Wolfgang},
booktitle = {CHI Workshop Designing Interaction for the Cloud},
howpublished = {Extended Abstract},
year = {2011},
month = {May},
numpages = {6},
pdf = {papers/cloudui.pdf},
abstract = {We describe a vision for user interfaces of cloud-based systems that permit seamless collaboration and provide also on- and off-line access to data. All individual components of this vision are currently available in various systems, but the sum of the components will satisfy user needs much more comprehensively.},
keywords = {GUI, cloud computing, off-line, collaboration},
}
@misc{pavlovych2011pursuit,
title = {Pursuit Tracking in Presence of Latency, Jitter, and Dropouts},
author = {Pavlovych*, Andriy and Stuerzlinger, Wolfgang},
booktitle = {GRAND NCE Conference},
series = {GRAND '11},
howpublished = {Poster},
year = {2011},
month = {May},
keywords = {latency, jitter, tracking},
}
@misc{zaman2011darls,
title = {DARLS: Differencing and Merging Diagrams Using Dual View Animation, Re-Layout, Layers and a Storyboard},
author = {Zaman*, Loutfouz and Kalra+, Ashish and Stuerzlinger, Wolfgang},
booktitle = {Extended Abstracts on Human Factors in Computing Systems},
publisher = {ACM},
series = {CHI EA '11},
howpublished = {Extended Abstract},
year = {2011},
month = {May},
pages = {1657-1662},
doi = {https://doi.org/10.1145/1979742.1979824},
pdf = {papers/darls.pdf},
abstract = {We present a new system for visualizing and merging differences in diagrams. It uses animation, dual views, a storyboard, relative re-layout, and layering to visualize differences. The system is also capable of differencing UML class diagrams. An evaluation produced positive results for animation and dual views with difference layer.},
keywords = {difference visualization},
}
@misc{shuralyov2011puzzle,
title = {A {3D} Desktop Puzzle Assembly System},
author = {Shuralyov*, Dmitri and Stuerzlinger, Wolfgang},
booktitle = {Symposium on {3D} User Interfaces},
publisher = {IEEE},
series = {3DUI '11},
howpublished = {3DUI contest entry},
year = {2011},
month = {Mar},
pages = {139-140},
doi = {https://doi.org/10.1109/3DUI.2011.5759244},
pdf = {papers/3dpuzzle.pdf},
video = {videos/Puzzle2x.mp4},
teaser = {teasers/3dpuzzle.png},
abstract = {We describe a desktop virtual reality system targeted at 3D puzzle assembly. The results of the evaluation show that all novices could successfully complete the puzzle within an average of about six minutes, while experts took about two minutes.},
keywords = {3D manipulation},
}
@misc{pavlovych2010effects,
title = {Effects of Latency Jitter and Dropouts in Pointing Tasks},
author = {Pavlovych*, Andriy and Stuerzlinger, Wolfgang},
booktitle = {GRAND NCE Conference},
series = {GRAND '10},
howpublished = {Poster},
year = {2010},
month = {Jul},
abstract = {Interactive computing systems frequently use pointing as an input modality, while also supporting other forms of input. We focus on pointing and investigate the effects of variations, i.e. jitter, in the input device latency, as well as dropouts, on 2D pointing speed and accuracy. First, we characterize the latency, latency jitter, and dropouts in several common input technologies. Then we present an experiment, where we systematically explore combinations of dropouts, latency, and latency jitter on a desktop mouse. The results indicate that latency and dropouts have a strong effect on human performance; moderate amounts of jitter in latency do not change performance in a significant way in most cases.},
keywords = {latency, jitter, pointing},
}
@misc{zaman2010interface,
title = {A New Interface for Cloning Objects in Drawing Systems},
author = {Zaman*, Loutfouz and Stuerzlinger, Wolfgang},
booktitle = {GRAND NCE Conference},
series = {GRAND '10},
howpublished = {Poster},
year = {2010},
month = {Jun},
abstract = {Cloning objects is a common operation in graphical user interfaces. A good example is calendar systems, where users commonly create and modify recurring events, i.e. repeated clones of a single event. Inspired by the calendar paradigm, we introduce a new cloning technique for 2D drawing programs. This technique allows users to clone objects by first selecting them and then dragging them to create clones along the dragged path. A novel approach for the generation of clones of clones is also presented. Moreover, the technique enables editing of the generated sequences of clones similar to the editing of calendar events.
We compared our new clone creation technique with generic duplication via copy-and-paste, smart duplication, and a dialog driven technique on a desktop system. The results show that the new cloning method is always faster than dialogs and faster than smart duplication for most conditions. We also compared our clone editing method against rectangular selection. The results show that our method is better in general. In situations where rectangle selection is effective, our method is still competitive. Participants preferred the new techniques overall, too.},
keywords = {cloning, drawing, copy, paste},
}
@misc{pavlovych2010effectslatency,
title = {Effects of Latency Jitter and Dropouts in Pointing Tasks},
author = {Pavlovych*, Andriy and Stuerzlinger, Wolfgang},
booktitle = {Graphics Interface},
series = {GI '10},
howpublished = {Poster},
year = {2010},
month = {May},
pages = {30-32},
abstract = {Interactive computing systems frequently use pointing as an input modality, while also supporting other forms of input. We focus on pointing and investigate the effects of variations, i.e. jitter, in the input device latency, as well as dropouts, on 2D pointing speed and accuracy. First, we characterize the latency, latency jitter, and dropouts in several common input technologies. Then we present an experiment, where we systematically explore combinations of dropouts, latency, and latency jitter on a desktop mouse. The results indicate that latency and dropouts have a strong effect on human performance; moderate amounts of jitter in latency do not change performance in a significant way in most cases.},
keywords = {latency, jitter, pointing},
}
@misc{arif2010mobile,
title = {Two New Mobile Touchscreen Text Entry Techniques},
author = {Arif*, Ahmed Sabbir and Lopez+, Mauricio H. and Stuerzlinger, Wolfgang},
booktitle = {Graphics Interface},
series = {GI '10},
howpublished = {Poster},
year = {2010},
month = {May},
abstract = {This article introduces two new mobile touchscreen text entry techniques. One is timeout-based and the other is pressure-based. Also, this work examines the effects of tactile feedback on text entry techniques. Empirical comparisons between conventional and proposed techniques show that the new techniques, as well as tactile feedback, enhance overall text entry performance.},
keywords = {text entry, mobile device},
}
@misc{agarwal2010widgetlens,
title = {{WidgetLens}: Interaction Through The Looking Glass},
author = {Agarwal*, Bhavna and Stuerzlinger, Wolfgang},
booktitle = {Graphics Interface},
series = {GI '10},
howpublished = {Poster},
year = {2010},
month = {May},
abstract = {Computer and mobile device screens are increasing in size and resolution. This increase in resolution causes problems with graphical user interfaces designed for lower resolution screens, as all information gets smaller and smaller. We present two novel techniques to make graphical user interfaces on high-resolutions screens more accessible and usable. We introduce a new in-place, localized zooming technique that works on a per widget basis. We also present a novel widget magnification technique that implements special modalities for common user interface elements, which affords widget-dependent magnification.},
keywords = {GUI, widget, magnification, layout},
}
@misc{dehmeshki2010design,
title = {Design of a Perceptual-Based Object Group Selection Technique},
author = {Dehmeshki*, Hoda and Stuerzlinger, Wolfgang},
booktitle = {Graphics Interface},
series = {GI '10},
howpublished = {Poster},
year = {2010},
month = {May},
abstract = {Selecting groups of objects is a common task in graphical user interfaces. Current selection techniques such as lasso and rectangle selection become time-consuming and error-prone in dense configurations or when the area covered by targets is large or hard to reach. This paper presents a new pen-based interaction technique that allows users to efficiently select perceptual groups formed by the Gestalt principle of good continuity.},
keywords = {group selection},
}
@misc{teather2010target,
title = {Target Pointing in {3D} User Interfaces},
author = {Teather*, Robert J. and Stuerzlinger, Wolfgang},
booktitle = {Graphics Interface},
series = {GI '10},
howpublished = {Poster},
year = {2010},
month = {May},
abstract = {We present two studies using ISO 9241-9 to evaluate target pointing in two different 3D user interfaces. The first study was conducted in a CAVE, and used the standard tapping task to evaluate passive haptic feedback. Passive feedback increased throughput significantly, but not speed or accuracy alone. The second experiment used a fish tank VR system, and compared tapping targets presented at varying heights stereoscopically displayed at or above the surface of a horizontal screen. The results indicate that targets presented closer to the physical display surface are generally easier to hit than those displayed farther away from the screen.},
keywords = {3D pointing},
}
@misc{ashtiani2009xnt,
title = {XNT: Object Transformation on Multi-Touch Surfaces},
author = {Ashtiani*, Behrooz and Stuerzlinger, Wolfgang},
booktitle = {Conference on Interactive Tabletops and Surfaces 2009},
series = {ITS '09},
howpublished = {Poster},
year = {2009},
month = {Nov},
numpages = {2},
pdf = {papers/xntposter.pdf},
video = {videos/XNT3D.mp4},
abstract = {We present and evaluate a new object transformation technique for multi-touch surfaces. Specifying complete object transformations for a two-dimensional space requires a minimum of four degrees of freedom (DOF): two for position, one for rotation, and another for scaling. Many existing techniques for object transformation are designed to function with traditional input devices such as mice, single-touch surfaces, or stylus pens. The challenge is then to compensate for the lack of DOF's. XNT is a new three-finger object transformation technique, designed specifically for multi-touch surface devices. It provides a natural interface for object manipulation and was experimentally found to be faster than previous techniques.},
keywords = {manipulation, touch},
}
@misc{teather2009coupling,
title = {Evaluating Visual/Motor Coupling in Fish Tank VR},
author = {Teather*, Robert J. and Allison, Robert and Stuerzlinger, Wolfgang},
booktitle = {CVR Conference},
series = {CVR '09},
howpublished = {Poster},
year = {2009},
month = {Jun},
keywords = {3D pointing},
}
@misc{teather2009effectslatency,
title = {Effects of Latency and Spatial Jitter on {2D} and {3D} Pointing},
author = {Teather*, Robert J. and Pavlovych*, Andriy and Stuerzlinger, Wolfgang},
booktitle = {Virtual Reality Conference},
publisher = {IEEE},
series = {VR '09},
howpublished = {Poster},
year = {2009},
month = {Mar},
pages = {229-230},
doi = {https://doi.org/10.1109/VR.2009.4811029},
abstract = {We investigate the effects of input device latency and spatial jitter on 2D pointing tasks and a 3D movement. First, we characterize jitter and latency in a 3D tracking device and an optical mouse used for baseline comparison. We present an experiment based on ISO 9241-9, which measures performance of pointing devices. We added latency and jitter to the mouse and compared it to a 3D tracker. Results indicate that latency has a stronger effect on performance than small spatial jitter. A second experiment found that erratic jitter "spikes" can affect 3D movement performance.},
keywords = {3D pointing, latency, jitter},
}
@misc{stuerzlinger2008nextgen,
title = {Next Generation {3D} Interaction Techniques},
author = {Stuerzlinger, Wolfgang and Wingrave*, Chad},
booktitle = {Virtual Realities},
series = {Dagstuhl Seminar 08231},
howpublished = {Abstract},
year = {2008},
month = {Jun},
url = {http://drops.dagstuhl.de/opus/volltexte/2008/1634},
abstract = {We present a set of guidelines for 3D positioning techniques. These guidelines are intended for developers of object interaction schemes in 3D games, modeling packages, computer-aided design systems, and virtual environments. The guidelines promote intuitive object movement techniques in these types of environments.},
keywords = {3D manipulation, 3D pointing},
}
@misc{das2008recall,
title = {Recall Accuracy Drive Visual Strategy Adaptation in Multi-tap Text Entry},
author = {Das*, Arindam and Stuerzlinger, Wolfgang},
booktitle = {Graphics Interface},
series = {GI '08},
howpublished = {Poster},
year = {2008},
month = {May},
abstract = {We present a cognitive model that demonstrates how the recall accuracy of letter positions on a cell phone keypad effects the transition from novice to expert behavior. In particular, we target multi-tap text entry methods and focus on the process of visually searching versus selecting (i.e. deciding) a letter on the keypad. The model predicts the probability of letter location recall by novice users through a cognitive architecture named ACT-R, and models learning as the user gradually gains cognitive expertise with practice, session after session. We then employ this probability within a model of strategy adaptation that encapsulates the effect of different visual exploration strategies: novice users search for a letter while the behavior of advanced users is modeled by the Hick-Hyman Law. The final output of our cognitive model is the entry speed for the key press for a letter in a letter-group containing multiple distinct letters.},
keywords = {text entry, learning},
}
@misc{dadgari2008analysis,
title = {Analysis of Merging Text Versions Using Differentiation Methods},
author = {Dadgari*, Darius and Stuerzlinger, Wolfgang},
booktitle = {Graphics Interface},
series = {GI '08},
howpublished = {Poster},
year = {2008},
month = {May},
abstract = {Comparing and selecting text from multiple versions of a document is a necessary task for a task-leader or group to undertake when users collaborate in writing a document, or when a single user generates different versions of a document to experiment with. Comparing multiple documents in an intuitive, efficient way allows a user to select the most appropriate portions of work from multiple sources quickly, to create a final document. Examination and even publications of text versioning methods are not documented in the literature, even though implementations of text versioning are abundant in a multitude of commercial and non-commercial software.
We propose new methods for text versioning, based on methods which have been previously shown to be effective for differentiating between objects. We plan to perform an extensive evaluation with these proposed methods to currently implemented ones in order to examine which methods are preferred by users and which show benefit in terms of error rate and completion time.},
keywords = {difference visualization},
}
@misc{dehmeshki2008using,
title = {Using Perceptual Grouping for Object Group Selection},
author = {Dehmeshki*, Hoda and Stuerzlinger, Wolfgang},
booktitle = {Graphics Interface},
series = {GI '08},
howpublished = {Poster},
year = {2008},
month = {May},
abstract = {Selection is a critical task in document processing systems, and is required for many manipulation operations such as deleting, moving, reusing, or re-formatting. Documents have usually a hierarchical structure. For example, books are naturally represented as a sequence of chapters, sections, subsections and so on until described completely in terms of basic component such as paragraphs, tabular material, and images. This structure is usually visualized using different formats (e.g. font sizes) or different views (e.g. outline views in Microsoft Words). Despite this inherent structure, to the best of our knowledge no selection technique systematically utilizes this structure in pen-based system. The multi-click approach is a standard selection method offered by many systems. Single, double, and triple clicking then selects the corresponding unit (e.g. word, line, and paragraph, respectively). This approach cannot select larger units than a paragraph and is not well suited for pen-based systems, as multi-clicking is unreliable for pens. Current selection techniques such as Rectangle, Lasso require users to explicitly define a selection scope by a pen movement. This can be time-consuming and error-prone when the target is large (e.g. multiple paragraphs) or spans more than a page. In the later case, the user has to select and scroll simultaneously. Moreover, these techniques are one directional, i.e. from the start point to the end point. The following common scenario describes potential problems: during a paragraph selection, the user decides to select the previous paragraph as well. She has two choices: either cancelling, relocating the mouse (pen), and re-starting a new selection, or selecting both paragraphs individually while using a phrasing technique (such as a Shift-key).
We propose a novel pen-based technique issues for selecting document components. Performing a pigtail gesture in a margin selects the nearby unit. Continuous pigtails extend selection to previous, next or both units according to the last pigtail orientation. Our technique automatically scrolls (or zooms out) when selecting off-screen targets.},
keywords = {group selection},
}
@misc{pavlovych2008effect,
title = {Effect of Group Size and Interaction Devices in Co-Located Computer Supported Collaborative Work},
author = {Pavlovych*, Andriy and Stuerzlinger, Wolfgang},
booktitle = {Graphics Interface},
series = {GI '08},
howpublished = {Poster},
year = {2008},
month = {May},
keywords = {large display interaction, collaboration, groupware, CSCW},
}
@misc{teather2008exaggerating,
title = {Exaggerating Head-Coupled Camera Motions in Fish Tank VR},
author = {Teather*, Robert J. and Stuerzlinger, Wolfgang},
booktitle = {Graphics Interface},
series = {GI '08},
howpublished = {Poster},
year = {2008},
month = {May},
abstract = {Virtually exaggerating head motions when using head-coupled viewing may be beneficial. This is especially important in environments where the user is sitting, such as in desktop or "fish-tank" VR. We present an evaluation of exaggerated head-coupled perspective for 3D assembly tasks. Three levels of exaggeration were compared to determine if exaggeration was beneficial compared to a direct mapping. The results suggest that there is some user preference towards modest levels of exaggeration. However, no significant differences by the experimental conditions were detected, other than a learning effect.},
keywords = {3D navigation},
}
@misc{dehmeshki2008intelligent,
title = {Intelligent Object Group Selection},
author = {Dehmeshki*, Hoda and Stuerzlinger, Wolfgang},
booktitle = {Extended Abstracts on Human Factors in Computing Systems},
publisher = {ACM},
series = {CHI EA '08},
howpublished = {Extended Abstract},
year = {2008},
month = {Apr},
pages = {3111-3116},
doi = {https://doi.org/10.1145/1358628.1358816},
pdf = {papers/gestaltclick.pdf},
abstract = {Current object group selection techniques such as lasso or rectangle selection can be time consuming and error prone. This is apparent when selecting distant objects on a large display or objects arranged along curvilinear paths in a dense area. We present a novel group selection technique based on the Gestalt principles of proximity and good continuity. The results of a user study show that our new technique outperforms lasso and rectangle selection for object groups in(curvi)linear arrangements or clusters, i.e. groups with an implicit structure.},
keywords = {group selection},
}
@misc{teather2008assessingeffects,
title = {Assessing the Effects of Orientation and Device on {3D} Positioning},
author = {Teather*, Robert J. and Stuerzlinger, Wolfgang},
booktitle = {Virtual Reality Conference},
publisher = {IEEE},
series = {VR '08},
howpublished = {Poster},
year = {2008},
month = {Mar},
pages = {293-294},
doi = {https://doi.org/10.1109/VR.2008.4480807},
pdf = {papers/move3dposter2.pdf},
abstract = {We present two studies to assess which physical factors of various input devices influence 3D object movement tasks. In particular, we evaluate the factors that seem to make the mouse a good input device for constrained 3D movement tasks. The first study examines the effect of a supporting surface across orientation of input device movement and display orientation. Surprisingly, no significant results were found for the effect of physical support for constrained movement techniques. Also, no significant difference was found between matching the orientation of the display to that of the input device movement. A second study found that the mouse outperformed all tracker conditions for speed, but the presence or absence of support had no significant effect when tracker movement is constrained to 2D.},
keywords = {3D pointing},
}
@misc{dehmeshki2007gestalt,
title = {Gestalt-Based Object Group Selection},
author = {Dehmeshki*, Hoda and Stuerzlinger, Wolfgang},
booktitle = {CVR Conference},
series = {CVR '08},
howpublished = {Poster},
year = {2007},
month = {Jun},
pdf = {papers/gestaltmodel2.pdf},
abstract = {Object grouping in graphical systems is supported by Lasso or Rectangle techniques which could require extra steps. This work presents a new approach to group objects by Gestalt principles of proximity, curve-linearity, similarity and common region. We demonstrate the results with several examples.},
keywords = {group selection},
}
@misc{teather2007challenge,
title = {The Challenge of {3D} Interaction: Guidelines for Intuitive {3D} Manipulation Techniques},
author = {Teather*, Robert J. and Stuerzlinger, Wolfgang},
booktitle = {Interacting with Immersive Worlds},
howpublished = {Abstract},
year = {2007},
month = {Jun},
numpages = {1},
abstract = {The rapid evolution of computer technology has made it possible to generate increasingly realistic virtual environments. However, despite the promise and hype of virtual reality that began in the 1980s, actual usage of the technology (outside of research settings) is limited primarily to derivatives of truly immersive VR, such as 3D video games. We suggest that one of the greatest barriers to widespread adoption of VR technology is the lack of intuitive interaction techniques available in virtual environments. True 3D manipulation is a 6 degree of freedom (6DOF) task, i.e. three independent axes of movement and three independent axes of rotation. Although we regularly perform such manipulations in reality with our hands, in a virtual environment, we are faced with a difficult choice of input devices: either use a familiar, but less immersive device, such as a mouse or use any of a number of unfamiliar and problematic 3D input devices. However, a mouse is a 2DOF device, providing movement in two directions only. Without support from software techniques that map 2D mouse movements into 6DOF operations, such a device is inadequate for manipulating objects in 3D.
One alternative is to use a higher DOF input device (e.g. 3D wands or gloves) which can provide high-precision 3D positioning and orientation. This is an attractive solution for immersive environments where the user is standing. Another possibility is to use a mouse with indirect manipulation techniques, such as 3D widgets, or control keys to toggle the axis of movement/rotation. However, both of these approaches present unique sets of problems. Full 6DOF input devices tend to be difficult to use and indirect manipulation techniques force the user to mentally decompose each manipulation into a series of steps. Both solutions require the user to think about the interface, rather than the task at hand.
A third approach is to use constraints, such as gravity, collision avoidance, etc. Building on this idea, we propose instead the use of "intelligent" 2DOF interaction techniques that automatically and intuitively map 2D mouse motions to 3D movement. One such technique, used for moving objects in the Sesame 3D conceptual modeling tool has been shown in experiments to be significantly faster and more accurate than both 6DOF input and 3D widget interaction techniques. This technique is an example of 3D direct manipulation, allowing users to "click and drag" objects in the scene. Dragging the object causes it to slide along the foremost visible surface behind it in the scene. This sliding motion behaves in a very predictable, natural way, and suggests that a mouse with suitably intelligent software support may be an ideal "3D" input device for certain VR and 3D applications, notably 3D modeling.
Based on this, and related research, we have composed a list of several guidelines for researchers developing immersive applications requiring 3D interaction. These guidelines are intended to aid designers in choosing methods of interaction, but are broad enough to encompass any type of 3D application requiring the accurate interactive positioning of objects in the environment. Current research suggests that techniques based on these guidelines may not only benefit mouse-based input, but input from higher-DOF devices as well.},
keywords = {3D manipulation},
}
@misc{teather2007evaluation,
title = {An Evaluation of {3D} Positioning Techniques for Scene Assembly},
author = {Teather*, Robert J. and Stuerzlinger, Wolfgang},
booktitle = {Symposium on {3D} User Interfaces},
publisher = {IEEE},
series = {3DUI '07},
howpublished = {Poster},
year = {2007},
month = {Mar},
numpages = {1},
pdf = {papers/move3dposter.pdf},
keywords = {3D manipulation, 3D positioning},
}
@misc{stuerzlinger2006covidsystem,
title = {{CoViD}: A System for Collaborative Virtual {3D} Design},
author = {Stuerzlinger, Wolfgang},
booktitle = {CSCW Workshop: Design and CSCW},
howpublished = {Extended Abstract},
year = {2006},
month = {Nov},
numpages = {2},
pdf = {papers/covid_short.pdf},
abstract = {Many important decisions in the design process are made fairly early on, after designers have presented initial concepts. In many domains, these concepts are now realized as 3D digital models and, in meetings, the stakeholders evaluate these potential solutions. Frequently, the participants in such a meeting want to interactively modify the proposed designs to explore the design space better. Today's systems and tools do not support this, as computer systems typically support only a single user and computer-aided design tools require significant training. This paper presents a new system to facilitate a collaborative 3D design process. The new system, CoViD, consists of two main parts. The first part is an easy-to-use conceptual 3D design tool that can be used productively even by naive users. The second part is a novel infrastructure for collaborative work, which offers an interactive table and several large interactive displays in a semi-immersive setup. The synthesis of both parts forms a new platform for collaborative virtual 3D design.},
keywords = {collaboration, design, 3D modeling},
}
@misc{dehmeshki2006perceptual,
title = {A Perceptual-based Group Selection Technique for Graph Drawing Systems},
author = {Dehmeshki*, Hoda and Stuerzlinger, Wolfgang},
booktitle = {Grace Hopper Conference},
howpublished = {Poster},
year = {2006},
month = {Oct},
keywords = {group selection},
}
@misc{stuerzlinger2006reality,
title = {Reality-Based Object Movement Techniques for {3D}},
author = {Stuerzlinger, Wolfgang and Dadgari*, Darius and Oh*, Ji-Young},
booktitle = {CHI Workshop: What is the Next Generation of Human-Computer Interaction?},
howpublished = {Extended Abstract},
year = {2006},
month = {Apr},
articleno = {D.3},
numpages = {4},
pdf = {papers/realitymove3d.pdf},
abstract = {Scene layout and part assembly are basic tasks in 3D object manipulation. While movement methods based on 3D or 6D input devices exist, the most efficient 3D movement techniques are based on utilizing only two degrees of freedom. This poses the problem of mapping the motion of the 2D input device to efficient and predictable object motion in 3D. We present a new method to map 2D input to 3D motion in this paper. The object position follows the mouse cursor position closely, while the object always stays in contact with other surfaces in the scene. In contrast to existing techniques, the movement surface and the relative object position is determined using the whole area of overlap of the moving object with the static scene. The resulting object movement is visually smooth and predictable, while avoiding undesirable collisions. The technique also utilizes the fact that people easily recognize the depth-order of shapes based on occlusions. The proposed technique runs in real-time. Finally, the evaluation of the new technique with a user study shows that it compares very favorably to conventional techniques.},
keywords = {3D manipulation, 3D positioning},
}
@misc{kulikov2006targeted,
title = {Targeted Steering Motions},
author = {Kulikov*, Sergey and Stuerzlinger, Wolfgang},
booktitle = {Extended Abstracts on Human Factors in Computing Systems},
publisher = {ACM},
series = {CHI EA '06},
howpublished = {Extended Abstract},
year = {2006},
month = {Apr},
pages = {983-988},
doi = {https://doi.org/10.1145/1125451.1125640},
pdf = {papers/targetsteer.pdf},
abstract = {In this paper we investigate targeted steering motions. Fitts' law is a very successful model to explain human targeting behavior, while the Steering law has been used to model steering motions. Dennerlein et al. combined these two models to explain targeted steering motions, but this combination introduces additional parameters. In this paper, we present a new, simpler, model that can be used to predict targeted steering motions.},
keywords = {steering},
}
@misc{dehmeshki2006using,
title = {Using Perceptual Grouping for Object Group Selection},
author = {Dehmeshki*, Hoda and Stuerzlinger, Wolfgang},
booktitle = {Extended Abstracts on Human Factors in Computing Systems},
publisher = {ACM},
series = {CHI EA '05},
howpublished = {Extended Abstract},
year = {2006},
month = {Apr},
pages = {700-705},
doi = {https://doi.org/10.1145/1125451.1125593},
pdf = {papers/gestaltmodel.pdf},
abstract = {Modern graphical user interfaces support the direct manipulation of objects and efficient selection of objects is an integral part of this user interface paradigm. For the selection of object groups most systems implement only rectangle selection and shift-clicking. This paper presents an approach to group selection that is based on the way human perception naturally groups objects, also known as the "Gestalt" phenomenon. Based on known results from perception research, we present a new approach to group objects by the Gestalt principles of proximity, curve-linearity, and closure. We demonstrate the results with several examples.},
keywords = {group selection},
}
@misc{kulikov2005measuring,
title = {Measuring the Effective Parameters of Steering Motions},
author = {Kulikov*, Sergey and {MacKenzie}, I. Scott and Stuerzlinger, Wolfgang},
booktitle = {Extended Abstracts on Human Factors in Computing Systems},
publisher = {ACM},
series = {CHI EA '05},
howpublished = {Extended Abstract},
year = {2005},
month = {Apr},
pages = {1569-1572},
doi = {https://doi.org/10.1145/1056808.1056968},
pdf = {papers/steeringwidth.pdf},
teaser = {teasers/steeringwidth.png},
abstract = {The steering law model describes pointing device motion through constrained paths. Previous uses of the model are deficient because they are built using only error-free responses, ignoring altogether the path of the cursor. We correct this by proposing and validating a technique to include spatial variability, including errors. The technique is a variant of the well-known "effective target width" used in Fitts' law models. An experiment designed to test our technique demonstrates the improvement: Correlations are consistently higher when spatial variability is included in building the model. Suggestions to aid further development of the steering law model are included.},
keywords = {steering},
}
@misc{stuerzlinger2005multi,
title = {MULTI: Multi-User Laser Table Interface},
author = {Stuerzlinger, Wolfgang},
booktitle = {CHI Workshop on Distributed Display Environments},
howpublished = {Extended Abstract},
year = {2005},
month = {Apr},
numpages = {2},
pdf = {papers/multi_design.pdf},
abstract = {We present a new system, which consists of an interactive table and several interactive wall displays and is designed to be used by a single person as well as collaboratively. A new kind of interaction device, based on laser pointes, affords both local (i.e. pen-based) as well as remote interaction. The research focuses on interaction techniques for this system as well as research on collaborative activities, in particular collaborative design.},
keywords = {large display system, large display interaction, collaboration, laser},
}
@misc{pavlovych2005windowmanager,
title = {A Window Manager for High Dynamic Range Display Systems},
author = {Pavlovych*, Andriy and Vorozcovs*, Andrew and Stuerzlinger, Wolfgang},
booktitle = {VR Workshop on Emerging Display Technologies},
howpublished = {Extended Abstract},
year = {2005},
month = {Mar},
pages = {31-34},
pdf = {papers/hdrwinmgr.pdf},
abstract = {The dynamic luminance range of many real-world environments exceeds the capabilities of current display technology by several orders of magnitude. Recently, new display systems have demonstrated, which are capable of displaying images with a dynamic luminance range much more similar to that encountered in the real world.
The paper summarizes how the human eye perceives high dynamic luminance ranges, sources of high dynamic range data, how the new display systems work, as well as their limitations. The paper discusses the need for a high dynamic range window manager and presents an initial implementation. Finally, the results of a preliminary evaluation are presented.},
keywords = {high dynamic range, GUI},
}
@misc{oh2004sesame,
title = {{SESAME}: {3D} Conceptual Design System},
author = {Oh*, Ji-Young and Stuerzlinger, Wolfgang},
booktitle = {SIGGRAPH Posters},
publisher = {ACM},
series = {SIGGRAPH '04},
howpublished = {Poster},
year = {2004},
month = {Aug},
numpages = {1},
doi = {https://doi.org/10.1145/1186415.1186461},
pdf = {papers/sesame_poster.pdf},
abstract = {We present a system for a conceptual design session in the desktop Virtual Environment (DVE) and Computer Aided Design (CAD). We consider easy modification to be important for conceptual sessions, as users alter the design frequently in those sessions. The system presents new techniques to make the modification of a scene easy.},
keywords = {3D manipulation, 3D positioning, design},
}
@misc{pouliquen2004hog,
title = {{HOG}: A New Model Representation for {3D} Acquisition and Planning},
author = {Pouliquen*, Gilles and Stuerzlinger, Wolfgang},
booktitle = {Canadian Conference on Intelligent Systems},
howpublished = {Poster},
year = {2004},
month = {Jun},
numpages = {1},
pdf = {papers/HOG_poster.pdf},
abstract = {Digital acquisition of 3D objects is a process in which a computer model of a physical object is constructed. This process is extremely popular nowadays as the resulting computer models have many applications. The acquisition process can be decomposed into four stages which have to be repeated until a satisfying model is obtained. Those four stages are scanning, registration, integration and planning [1].
The planning stage is needed because an object cannot be modeled from a single scan. It is necessary to measure the object from various points of view to obtain a complete model.
Currently, there is no system that can automatically scan an unknown object. Hence, a highly trained operator is needed to control the scanning device. The operator must select poses for the scanner such that the number of scans required to completely scan the object is kept reasonably small.
We present a novel representation for the model: the Hierarchical Occupancy Grid (HOG). This representation can be used for the integration and planning stage of the 3D acquisition pipeline.},
keywords = {3D scanning, next-best view},
}
@misc{stuerzlinger2004presentation,
title = {High Dynamic Range Display System},
author = {Stuerzlinger, Wolfgang},
booktitle = {DRDC/CVR Workshop},
howpublished = {Abstract},
year = {2004},
month = {Mar},
keywords = {high dynamic range, display},
}
@misc{pavlovych2003modeling,
title = {Modeling non-Expert Text Entry Speed on Phone Keypads},
author = {Pavlovych*, Andriy and Stuerzlinger, Wolfgang},
booktitle = {16th Annual ACM Symposium on User Interface Software and Technology},
series = {UIST '03},
howpublished = {Poster},
year = {2003},
month = {Nov},
pdf = {papers/nonexpertmodel.pdf},
abstract = {For mobile phones, previous research has created models that can be used to predict expert performance. However, one important factor that influences the success of new interaction techniques is the users' initial experience with them. In this work, we present a new model to predict text entry speed on 12-button mobile phone keypads for novices. The model is based on Fitts' law, letter digraph probabilities, and a model of the mental processing time before key presses.},
keywords = {text entry, novice},
}
@misc{seetzen2003emerging,
title = {High Dynamic Range Display System},
author = {Seetzen*, Helge and Whitehead, Lorne and Stuerzlinger, Wolfgang and Vorozcovs*, Andrew and Wilson, Hugh and Ashdown, Ian and Ward, Greg},
booktitle = {Emerging Technologies at ACM SIGGRAPH 2003},
series = {SIGGRAPH '03},
howpublished = {Demonstration},
year = {2003},
month = {Jul},
numpages = {1},
pdf = {papers/hdr_demonstration.pdf},
abstract = {We have developed a high dynamic range (HDR) display capable of presenting a luminance range of 10,000 cd/m2 to 0.1 cd/m2. In addition to the initial embodiment of the technology, we have developed a flat-panel version using light emitting diodes (LED) which offers the same dramatic dynamic range benefits in a much smaller package.},
keywords = {high dynamic range, display},
}
@misc{yourganov2002simulation,
title = {Simulation of Camera Distortions},
author = {Yourganov*, Grigori and Stuerzlinger, Wolfgang},
booktitle = {Space Vision and Advanced Robotics},
series = {SVAR '02},
howpublished = {Poster},
year = {2002},
month = {Jun},
keywords = {camera distortion},
}
@techreport{yourganov2001tonemapping,
title = {Tone-Mapping for High Dynamic Range Images},
author = {Yourganov*, Grigori and Stuerzlinger, Wolfgang},
institution = {Dept. of Computer Science, York University, Canada},
type = {Technical Report},
year = {2001},
month = {Dec},
numpages = {12},
pdf = {papers/TR_tonemapping.pdf},
keywords = {high dynamic range, tone mapping},
}
@misc{yourganov2001hdrvideo,
title = {High Dynamic Range Video},
author = {Yourganov*, Grigori and Stuerzlinger, Wolfgang},
booktitle = {York CVR Conference: Levels of Perception},
series = {CVR '01},
howpublished = {Poster},
year = {2001},
month = {Jun},
keywords = {high dynamic range, video},
}
@techreport{yourganov2001acquiring,
title = {Acquiring High Dynamic Range Video at Video Rates},
author = {Yourganov*, Grigori and Stuerzlinger, Wolfgang},
institution = {Dept. of Computer Science, York University, Canada},
type = {Technical Report},
year = {2001},
month = {May},
numpages = {18},
pdf = {papers/TR_hdrvideo.pdf},
abstract = {In the real world, the scene may contain some well-illuminated areas as well as some areas that are in the darkness. The dynamic range of the scene, or the radiance ratio between the brightest and the darkest spots, can be quite big – it can span several orders of magnitude in some cases. This is a lot wider range than the range that our digital camera can adequately capture, and that our monitor can adequately display. The areas that are too bright for the dynamic range of our camera are going to be saturated on our image, and the areas that are too dark will be under-exposed. In both cases, all the information about these areas will be lost in the image.
A way to solve this problem is to combine different shutter speeds of our camera. Smaller shutter speeds can give us good information about the bright areas (because we won't have saturation), and longer shutter speeds effectively capture the dark areas. So by alternating the shutter speeds and by combining the two images into one in real-time, we can achieve higher dynamic range for digital video cameras.},
keywords = {high dynamic range, video},
}
@misc{yourganov2001poster,
title = {High Dynamic Range Video},
author = {Yourganov*, Grigori and Stuerzlinger, Wolfgang},
booktitle = {Vision and Intelligent Systems Workshop},
howpublished = {Poster},
year = {2001},
month = {May},
keywords = {high dynamic range, video},
}
@misc{poupyrev20003duibib,
title = {20th Century {3DUI} Bib: Annotated Bibliograpy of {3D} User Interfaces of the 20th Century},
author = {Poupyrev, Ivan and Kruijff, Ernst and Bowman, Doug and Billinghurst, Mark and Cugini, John and Dachselt, Raimund and Hinckley, Ken and {LaViola}, Joe and Lindeman, Rob and Pierce, Jeff and Steed, Anthony and Stuerzlinger, Wolfgang},
year = {2000},
month = {Jan},
url = {http://people.cs.vt.edu/~bowman/3dui.org/bibs/3duibib.pdf},
commented-url = {http://www.mic.atr.co.jp/~poup/3dui/3duibib.htm},
commented-url2 = {https://web.archive.org/web/20070223123901/http://www.mic.atr.co.jp/~poup/3dui/3duibib.htm},
}
@misc{elinas2000clouds,
title = {Real Time Rendering of {3D} Clouds},
author = {Elinas*, Pantelis and Stuerzlinger, Wolfgang},
booktitle = {Graphics Interface},
series = {GI '00},
howpublished = {Poster},
year = {2000},
month = {May},
numpages = {3},
pdf = {papers/cloudsposter.pdf},
abstract = {There is a myriad of real-time graphics applications that can greatly increase in realism with the introduction of realistic clouds in the scenery. These include applications in virtual reality, outdoor scene visualization, flight simulation, games etc. In the past, several researchers have proposed algorithms for realistic cloud rendering for non-real-time applications. Of these, the approaches of Gardner 85 and Nishita 96 stand out as the ones that give the most visually pleasing results. In our work, we are developing an implementation of Gardner's 3D cloud rendering algorithm augmented with recent advances such as photon maps with the help of hardware accelerated OpenGL.
Our implementation follows closely, Gardner's approach. We use textured ellipsoids as the building blocks for the clouds. We use Perlin noise textures compared to Gardner's spectral noise textures because we have more flexibility in controlling their appearance. The texture used is an indication of the volume density of the ellipsoid. Rendering the ellipsoids produces ellipses. Because clouds are more transparent at their edges compared to their middle, a result of the fact that the center of a cloud is denser, we need to fuzz out the edges of the ellipses.
Each cloud is made of a number of ellipsoids. The first step is to render each of the ellipsoids individually and evaluate the transparency over the resulting ellipse. The next step is to combine all the ellipses together to render the complete cloud.
Equation (1) is used to compute the transparency as a function of two thresholds one applied to the edge (T1) and one applied to the center of
the ellipse (T2). The values produced are consistent with OpenGL alpha channel values. We use a normalizing factor D just as Gardner did. We generate the function g(x,z) over the ellipsoid by utilizing projective textures. The latter function is maximum at the center of the ellipse and goes to zero at its edges; a spotlight texture is used to generate this effect. Evaluation is done partly in the alpha channel and partly in the RGB channels of the frame buffer in two steps. First T2*(1-g(x,z)) is computed and stored in the RGB channels. The It-T1 part is computed in the alpha channel. We then perform α = (R-α) by utilizing the color matrix extension. We set the color matrix to copy the red to the alpha channel while setting up subtractive blending and then we perform the operation by copying the frame buffer onto itself. The 1/D scaling is also achieved in the same step by including the 1/D term in the color matrix. The result is stored in the alpha channel while the RGB channels are cleared to accept new data in the next step.
Next we render the ellipsoids using a second texture that determines their color. We use another Perlin noise texture modulated with the color of the ellipsoids calculated using an infinite light source representing the Sun. The latter produces a simple approximation to global illumination of the cloud even though effects such as self-shading of the cloud is not taken into account. We are currently investigating better approaches to this such as using photon maps. The results of this step are stored in the RGB channels.
At this point the back buffer holds each of the ellipses including their transparency. We read these data into a texture of the smallest size that includes all the ellipses. Then, we calculate where on the screen each of the ellipses should appear and we render textured rectangles for each of the ellipsoids. We render each of the rectangles in the order of back to front with respect to the position of the ellipsoids in 3D; the ellipsoids are originally sorted roughly from back to front with respect to the location of their center.
This implementation is compatible with standard OpenGL hardware in its majority with the exception of the color matrix extension that is only available on SGI machines. Our implementation achieves real-time frame rates on low-end workstations such the SGI NT 320 and SGI O2 machines. More complex clouds made of 130+ ellipsoids can be rendered in real-time on more powerful machines such as the SGI Onyx.},
keywords = {rendering, real-time},
}
@misc{salzman2000constraint,
title = {Constraint Based {3D} Scene Construction},
author = {Salzman*, Tim and Smith*, Graham and Stuerzlinger, Wolfgang},
booktitle = {Graphics Interface},
series = {GI '00},
howpublished = {Poster},
year = {2000},
month = {May},
numpages = {2},
pdf = {papers/miveposter.pdf},
abstract = {Realistic 3D scenes often contain thousands of objects, and are in general difficult to model using today's CAD programs. We address this problem by exploiting predefined semantic relationships between objects to dynamically group and constrain them [GS99]. Virtual constraints, which de-couple the object's geometry from its constraints, are presented. Also discussed are techniques for dynamically grouping and re-grouping objects based on their semantic and virtual constraints. Preliminary testing shows that our system provides a fast, intuitive user interface for 3D scene construction. Finally, we will present ideas for future work.
Positioning objects in a virtual environment is not an intuitive task. One approach is direct manipulation using a six degree of freedom (DOF) input device. However, it is hard to position objects precisely using these devices, users often become fatigued, and many object interactions can be more effectively accomplished using a simple 2D interface such as a mouse [HPGK+94]. For these reasons, much research has been focused on software techniques for manipulating 3D objects using standard 2D input devices.
Bier [Bi90] presented snap-dragging for interactive solid modeling systems. This system used a general purpose gravity function and alignment manifolds to position objects in the scene. Snap-dragging provided easy selection of object features but the system required a complex user interface, had an unchangeable view and was computationally intensive.
In Object Associations [BS95], Bukowski and Sequin use a combination of physical properties (pseudo gravity) and goal oriented behaviour (alignment) to position and manipulate objects in a scene. This system was used to model the Berkeley Soda Hall WALKTRHU environment, which contained thousands of objects. However, adding new objects to the library is difficult, as object association must be coded. Constrained objects do not always move together because there is no dynamic grouping, instead the scene is searched for associated objects each time an object is moved. Further, all associations in this system are limited by object geometry.
Gosele exploited natural object behaviour to define and maintain object constraints [Go99]. Polygons were used to define offer and constraint areas, and a hierarchical labelling system was used to define which polygons could be constrained together. Typical constraint labels were on-Floor, on-Wall, and on-Workspace. Collision detection was added to the system to add realism by preventing inter-object penetrations. However, once constrained, objects in this system could not be unconstrained. Also, multiple constraints between two-objects were not possible.
Our system improves upon previous work in the following ways. Firstly, we allow constraints to be broken by pulling away from the constraining surface. For example, an object constrained to the floor and the wall can be unconstrained from the wall by pulling the object away from the wall. Also, an object can be re-constrained by translating it to another acceptable offer area. To show the user which offer areas will accept an object, all acceptable offer areas are highlighted when an object is selected for translation. Un-constraining and re-constraining an object invokes the dynamic grouping mechanism, which maintains the constraint relationships between objects.
We present the notion of virtual constraints. A virtual-constraint can be any polygon in 3D object-space, not necessarily associated with the object's geometry. An example is a polygon somewhere beneath a table, to which the front of a chair may be constrained. We present negative constraints, which are a specialization of virtual constraints are. Negative constraints are useful for defining volumes of space in which certain objects should not be placed. For example a desk would not be placed against a doorway because it would make the door inaccessible.
Our system has optimized the constraint satisfaction algorithm by pruning the search for valid offer areas and using a minimal distance constraint, typically the bounding radius of an object.
Finally, we present dual-constraints, bi-directional constraints between objects. When two or more objects are constrained by dual constraints, they form a dual-group. Using a drag-add technique, a row of constrained, neatly aligned books can be created on a bookshelf with one interaction step. We introduce the push-pull metaphor for interacting with a dual-group. When a dual-group is selected for translation, a connected-component search finds all group members who are attached to the selected object by dual-constraints in the approximate direction of translation. Those objects that are not attached in the direction of translation are un-grouped. With this technique, a row of cabinets that are connected by dual groups can be split into two groups by selecting a cabinet in the center and pulling in the direction that the new group is to translate.
Preliminary testing of the system is very promising. After a very short demo of the system, first time users were able to recreated a reasonably complicated scene in a matter minutes. Future plans are to test the system rigorously and compare results to a system with conventional interaction techniques.},
keywords = {3D manipulation},
}
@misc{stcyr2000knowledge,
title = {A Knowledge-Based Agent for CAD systems},
author = {St-Cyr+, Olivier and Lesperance, Yves and Stuerzlinger, Wolfgang},
booktitle = {Graphics Interface},
series = {GI '00},
howpublished = {Poster},
year = {2000},
month = {May},
numpages = {2},
pdf = {papers/agentposter.pdf},
abstract = {This poster describes an approach in improving the usability of computer-aided design (CAD) applications by adding an intelligent agent that assists the user in his/her interaction with the system. To implement the agent, I used ConGolog [GLL97, LLR99] – a very high-level programming language for developing knowledge-based agents that are embedded in complex environments. ConGolog supports the specification of a task-level model of a dynamic environment, the description of complex behaviours, and the synthesis of new plans at run-time. A prototype intelligent agent is being developed to work with an existing 3D CAD system [GS99]. This agent is intended to help the user in designing an office layout that satisfies his goals.
The CAD system [GS99] that our intelligent agent works with is built to allow the user to design a 3D virtual environment (office, kitchen, living room, etc.). The system's graphical user interface is quite simple. Interactions consist primarily of using the mouse to pick and place various types of objects (desk, chair, lamp, inkwell, etc.) in the room layout. In this, it resembles the Object Associations system [BS95]. The system handles the details of interactions based on a model of objects and the physical constraints that hold in the scene, for instance, an object being supported by a particular surface. But the system lacks a model of the user, of the task that he/she is trying to perform, and of the objectives that he/she is trying to achieve. It cannot really assist the user in quickly creating the desired room layout.
An early example for a system that attempts to aid the user in creating a room layout is CRACK [FM88]. This 2D system critiques the current design with text messages that explain the problem. The domain knowledge embedded in the critiquing system is not used to actively aid the user for placing objects.
It is believed that the use of intelligent agent technology can provide many benefits in the area of layout systems. An agent would maintain a high-level representation of the application domain, including object behaviour and user knowledge and goals. This could be used to enforce complex application specific constraints on the way objects are manipulated and on the layouts
that are produced. Secondly, such a model could be used for disambiguation and consistency checking. Humans often communicate information about a task very inaccurately because they understand the context of the task and its goals from previous experience. An agent could use its domain knowledge to resolve ambiguities, as well as ask more meaningful questions when user input is required. Moreover, the user goal model could be exploited to detect inadvertent errors. Thirdly, the agent could also aid the user in constructing the virtual design using its knowledge of the domain and user goals. Because it is aware of the current state of the design, it can provide suggestions and advice to the user, guide him through the task, and respond to user's questions. All this would lead towards much more natural and intuitive interaction between the user and the CAD system.},
keywords = {3D manipulation, design},
}
@misc{stcyr2000intelligent,
title = {An Intelligent Assistant for Computer-Aided Design},
author = {St-Cyr+, Olivier and Lesperance, Yves and Stuerzlinger, Wolfgang},
booktitle = {Smart Graphics: Papers from the AAAI Spring Symposium},
series = {SG '00},
isbn = {978-157735110-8},
howpublished = {Extended Abstract},
year = {2000},
month = {Mar},
pages = {24-28},
url = {https://aaai.org/Library/Symposia/Spring/ss00-04.php},
pdf = {papers/intelagent.pdf},
abstract = {This paper describes an approach in improving the usability of computer-aided design (CAD) applications by adding an intelligent agent that assists the user in his/her interaction with the system. To implement the agent, we use ConGolog [GLL97, LLR99] – a very high-level programming language for developing knowledge-based agents that are embedded in complex environments. ConGolog supports the specification of a task-level model of a dynamic environment, the description of complex behaviors, and the synthesis of new plans at run-time. A prototype intelligent agent is being developed to work with an existing 3D CAD system [GS99]. This agent is intended to help the user in designing an office layout that satisfies his goals.
The CAD system [GS99] that our intelligent agent works with is built to allow the user to design a 3D virtual environment (office, kitchen, living room, etc.). The system's graphical user interface is quite simple. Interactions consist primarily of using the mouse to pick and place various types of objects (desk, chair, lamp, inkwell, etc.) in the room layout. In this it resembles the Object Associations system [BS95]. The system handles the details of interactions based on a model of objects and the physical constraints that hold in the scene, for instance, an object being supported by a particular surface. But the system lacks a model of the user, of the task that he is trying to perform, and of the objectives that he is trying to achieve. It cannot really assist the user in quickly creating the desired room layout.
An early example for a system that attempts to aid the user in creating a room layout is CRACK [FM88]. This 2D system critiques the current design with text messages that explain the problem. The domain knowledge embedded in the critiquing system is not used to actively aid the user for placing objects.
We believe that the use of intelligent agent technology can provide many benefits in the area of layout systems. An agent would maintain a high-level representation of the application domain, including object
behavior and user knowledge and goals. This could be used to enforce complex application specific constraints on the way objects are manipulated and on the layouts that are produced. Secondly, such a model could be used for disambiguation and consistency checking. Humans often communicate information about a task very inaccurately, because they understand the context of the task and its goals from previous experience. An agent could use its domain knowledge to resolve ambiguities, as well as ask more meaningful questions when user input is required. Moreover, the user goal model could be exploited to detect inadvertent errors. Thirdly, the agent could also aid the user in constructing the virtual design using its knowledge of the domain and user goals. Because it is aware of the current state of the design, it can provide suggestions and advice to the user, guide him through the task, and respond to user questions. All this would lead to much more natural and intuitive interaction between the user and the CAD system.},
keywords = {3D modeling, 3D manipulation, constraints},
}
@comment{c, c={leave the "_stuerzlinger" in the ID to enable umlaut-free search!}}
@techreport{bastos_stuerzlinger1998forward,
title = {Forward Mapped Planar Mirror Reflections},
author = {Bastos*, Rui and Stürzlinger, Wolfgang},
institution = {Univ. of North Carolina at Chapel Hill},
type = {Technical Report},
year = {1998},
month = {Aug},
number = {TR98-026},
numpages = {12},
pdf = {papers/TR98-026.pdf},
abstract = {This paper presents a new technique, which we call depth-preserving reflection mapping, to render mirror-like reflections on planar surfaces in constant time. It is a hybrid solution which combines geometry-based rendering and image-based rendering into a two-pass mirror reflection rendering approach. The technique extends the traditional reflection mapping to preserve depth per texel and uses forward warping to approximate the mirror-like reflections on planar surfaces. For clarity, to distinguish these texels from the ones of traditional reflection mapping, we call them zexels.},
keywords = {rendering, real-time},
}
@comment{c, c={leave the "_stuerzlinger" in the ID to enable umlaut-free search!}}
@techreport{raskar_stuerzlinger1998efficientimage,
title = {Efficient Image Generation for Multiprojector and Multisurface Displays},
author = {Raskar*, Ramesh and Cutts*, Matt and Welch, Greg and Stürzlinger, Wolfgang},
institution = {Univ. of North Carolina at Chapel Hill},
type = {Technical Report},
year = {1998},
month = {Apr},
number = {TR98-016},
numpages = {12},
pdf = {papers/TR98-016.pdf},
abstract = {We describe an efficient approach to rendering a perspectively correct image on a potentially irregular display surface that may be illuminated with one or more distinct devices. The first pass of the technique generates an image of the desired graphics model using conventional rendering. The second pass projects that image as a texture onto a model of the display surface, then re-renders the textured display surface model from the viewpoint of each display device. The algorithm scales with the complexity of the display surface, and is constant with respect to the complexity of the graphics model.},
keywords = {rendering, projector, real-time},
footnote = {Extended version of EGSR '98 paper with theoretical analysis},
}
@comment{c, c={leave the "_stuerzlinger" in the ID to enable umlaut-free search!}}
@misc{schaufler_stuerzlinger1998hierarchical,
title = {{3D} Hierarchical Image Cache},
author = {Schaufler*, Gernot and Stürzlinger, Wolfgang},
booktitle = {Workshop on Image-Based Rendering and Modeling},
howpublished = {Poster},
year = {1998},
month = {Mar},
commented-url = {http://www.gup.uni-linz.ac.at:8001/staff/schaufler/papers/octimp},
keywords = {rendering, real-time},
}
@techreport{aliaga_stuerzlinger1998framework,
title = {A Framework for the Real-Time Walkthrough of Massive Models},
author = {Aliaga*, Daniel and Cohen*, Jon and Wilson*, Andrew and Zhang*, Hansong and Erikson*, Carl and Hoff*, Kenny and Hudson*, Tom and Stürzlinger, Wolfgang and Baker*, Eric and Bastos*, Rui and Whitton, Mary and Brooks, Fred and Manocha, Dinesh},
institution = {Univ. of North Carolina at Chapel Hill},
type = {Technical Report},
year = {1998},
month = {Mar},
number = {TR98-013},
numpages = {12},
url = {https://techreports.cs.unc.edu/papers/98-013.pdf},
pdf = {papers/TR98-013.pdf},
abstract = {We present a framework for rendering very large 3D models at nearly interactive rates. The framework scales with model size. Our framework can integrate multiple rendering acceleration techniques, including visibility culling, geometric levels of detail, and image-based approaches. We describe the database representation scheme for massive models used by the framework. We provide an effective pipeline to manage the allocation of system resources among different techniques. We demonstrate the system on a model of a coal-fired power plant composed of more than 15 million triangles.},
keywords = {rendering, real-time},
}
@techreport{stuerzlinger1998imaging,
title = {Imaging all Visible Surfaces Or How many Reference Images are needed for Image-Based Modeling?},
author = {Stürzlinger, Wolfgang},
institution = {Univ. of North Carolina at Chapel Hill},
type = {Technical Report},
year = {1998},
month = {Mar},
number = {TR98-010},
numpages = {11},
pdf = {papers/TR98-010.pdf},
abstract = {Today many systems exist to generate geometric models of existing scenes and objects. However, no accurate data about surface appearance such as colors and textures is stored in this process. Such data can be captured as a series of images that, collectively, capture all surfaces of the object.
This work introduces a method to compute a minimal set of camera positions for this purpose. Taking images from the computed positions can then be used to derive a complete set of surface appearance data. A slightly different application of the presented method is the computation of a minimal set of viewpoints for reference images to be used in image-based rendering methods.
First a method to determine an optimal set of viewpoint regions for a given scene is introduced. It uses a hierarchical visibility method to preprocess the scene. Then a technique to find an optimal set of viewpoint regions is presented and the solution is used to derive an optimal set of viewpoints. Results and visualizations of the computed solutions are presented.},
keywords = {3D scanning, visibility},
}
@techreport{stuerzlinger1995discontinuity,
title = {Discontinuity Meshing for a Radiosity Algorithm},
author = {Stürzlinger, Wolfgang},
institution = {GUP, Johannes Kepler Universität Linz, Austria},
type = {Technical Report},
year = {1995},
month = {Oct},
number = {CEI PACT D4V-8},
url = {https://www.jku.at/forschung/forschungs-dokumentation/publikation/2155},
keywords = {rendering, global illumination},
}
@techreport{stuerzlinger1995form,
title = {Form Factor Calculation for a Parallel Radiosity Algorithm},
author = {Stürzlinger, Wolfgang},
institution = {GUP, Johannes Kepler Universität Linz, Austria},
type = {Technical Report},
year = {1995},
month = {Jul},
number = {CEI-PACT D4V-6},
url = {https://www.jku.at/forschung/forschungs-dokumentation/publikation/2142},
keywords = {rendering, global illumination, parallel, visibility},
}
@comment{c, c={leave the "_stuerzlinger" in the ID to enable umlaut-free search!}}
@misc{schaufler_stuerzlinger1995parallelposter,
title = {Parallel Radiosity},
author = {Schaufler*, Gernot and Stürzlinger, Wolfgang and Volkert, Jens},
booktitle = {Workshop on Algorithms for Future Technologies},
howpublished = {Poster},
year = {1995},
month = {Mar},
commented-location = {Prague, CZ},
keywords = {rendering, global illumination, parallel},
}
@comment{c, c={leave the "_stuerzlinger" in the ID to enable umlaut-free search!}}
@techreport{schaufler_stuerzlinger1995load,
title = {Load Balancing for a Parallel Radiosity Algorithm},
author = {Schaufler*, Gernot and Stürzlinger, Wolfgang and Wild*, Christoph},
institution = {GUP, Johannes Kepler Universität Linz, Austria},
type = {Technical Report},
year = {1995},
month = {Jan},
number = {CEI PACT D4V-3},
url = {https://www.jku.at/forschung/forschungs-dokumentation/publikation/2134},
keywords = {rendering, global illumination, parallel, visibility},
}
@techreport{stuerzlinger1994description,
title = {Description and Implementation of a Parallel Radiosity Algorithm},
author = {Stürzlinger, Wolfgang and Wild*, Christoph and Schaufler*, Gernot},
institution = {GUP, Johannes Kepler Universität Linz, Austria},
type = {Technical Report},
year = {1994},
month = {Jul},
number = {CEI PACT D4V-1},
url = {https://www.jku.at/forschung/forschungs-dokumentation/publikation/2129},
keywords = {rendering, global illumination, parallel},
}
@misc{stuerzlinger1994parallelvisibility,
title = {Parallel Visibility Calculations for Parallel Radiosity},
author = {Stürzlinger, Wolfgang and Wild*, Christoph},
booktitle = {Workshop Paragraph},
howpublished = {Poster},
year = {1994},
month = {Mar},
pages = {32-40},
commented-location = {Hagenberg, AT},
abstract = {The radiosity method models the interaction of light between diffuse reflecting surfaces, thereby accurately predicting global illumination effects. Due to the high computational effort to calculate the transfer of light between surfaces and the memory requirements for the scene description, a distributed, parallelized version of the algorithm is needed for scenes consisting of thousands of surfaces. We present a distributed, parallel progressive radiosity algorithm. Then we parallelize the visibility calculations and present a scheme for the communication structure. Finally we analyze the results.},
keywords = {rendering, global illumination, parallel, visibility},
}
@techreport{stuerzlinger1993fxfire,
title = {FXFIRE - Global Illumination with Radiosity},
author = {Stürzlinger, Wolfgang},
institution = {GUP, Johannes Kepler Universität Linz, Austria},
type = {Technical Report},
year = {1993},
month = {Dec},
keywords = {rendering, global illumination},
}
@techreport{stuerzlinger1993flirt,
title = {FLIRT - Faster than Light Ray Tracer},
author = {Stürzlinger, Wolfgang and Tobler*, Robert and Schindler*, Michael},
institution = {Vienna University of Technology, Austria},
type = {Technical Report},
year = {1993},
month = {Aug},
keywords = {rendering, ray tracing},
}
@mastersthesis{stuerzlinger1999habilitation,
title = {Bildgenerierung},
author = {Stürzlinger, Wolfgang},
publisher = {Johannes Kepler Universität Linz, Austria},
year = {1999},
month = {Apr},
abstract = {A fundamental task in computer graphics is the generation of images. Given a geometric model of an object or scene the user wants a visual representation for a given viewpoint. This visualization process is also known as rendering images of a model.
An active research area in rendering is the generation of images with high visual realism. Important visual cues like highlights on surfaces and shadows cast by light sources aid the viewer in understanding an image. Images with high realism are produced with global illumination methods, which approximate the light distribution in an environment to varying degrees.
The major challenge in real-time rendering is to generate images as quickly as possible. Frame rates higher than 20 frames per second are needed to ensure that users perceive smooth motion. Although image generation hardware is widely available, it is hard to visualize very large structures at interactive rates even on high-end platforms. Furthermore, model sizes are growing quicker than graphics hardware capabilities. Several classes of techniques for optimized rendering have been devised to achieve high frame rates.
This text places most publications of the author in the context of these two research areas in computer graphics.},
keywords = {rendering, real-time, ray tracing},
note = {Austrian Habilitation},
}
@phdthesis{stuerzlinger1992dissertation,
title = {Radiosity mit Voronoi-Diagrammen und Diskontinuitäts-Meshes},
author = {Stürzlinger, Wolfgang},
school = {Vienna University of Technology, Austria},
year = {1992},
month = {Dec},
url = {https://catalogplus.tuwien.at/permalink/f/qknpf/UTW_alma2156324830003336},
abstract = {In dieser Arbeit wird ein Verfahren vorgestellt, das es ermöglicht, die genaue Beleuchtung einer Szene zu berechnen, die von flächigen Lichtquellen beleuchtet wird und die durch Polygone beschrieben ist, deren Oberflächen diffus sind. Zuerst wird eine Oberflächenrepräsentation mit Voronoi-Diagrammen vorgestellt, die es erlaubt beim Progressive Refinement Radiosity-Verfahren die Oberflächen adaptiv zu unterteilen, ohne dass die aus der Literatur bekannten Probleme auftreten. Dann wird ein Verfahren zur Berechnung von Schatten- und Halbschatten-Bereichen besprochen. Dieses Verfahren konstruiert eine Oberflächen-Repräsentation, die auf die verschiedenen Diskontinuitäten der Helligkeitsfunktion auf einer Oberfläche Rücksicht nimmt. Durch die neu vorgestellte Kombination der beiden Verfahren kann nun sowohl die Helligkeitsfunktion auf den Oberflächen sehr exakt approximiert werden, als auch die Radiosity von diesen Flächen genau weiterverteilt werden. Dadurch wird das Problem der diffusen globalen Beleuchtung gelöst. Zusätzlich wird eine Methode vorgestellt, die es erlaubt, nur die relevanten Diskontinuitäten zu berechnen, wodurch eine Beschleunigung des Verfahrens erzielt wird.},
keywords = {rendering, global illumination},
note = {Dissertation, in German},
}
@mastersthesis{stuerzlinger1989ccompiler,
title = {C-Compiler für den VIP-Prozessor},
author = {Stürzlinger, Wolfgang},
school = {Vienna University of Technology, Austria},
year = {1989},
month = {Nov},
url = {https://catalogplus.tuwien.at/permalink/f/qknpf/UTW_alma2145146200003336},
abstract = {An der Technischen Universität Wien ist in den Jahren 1985 bis 1988 das VIP-System ("Vienna Integrated Prolog") entstanden. Speziell für die schnelle Interpretation der Prolog-Programme wurde nun dazu der VIP-Prozessor entworfen. Beim Design des Prozessors wurden, um den Durchsatz zu steigern, einige RISC-Technologien verwendet. Vienna Integrated Prolog ist in der Programmiersprache C implementiert. Zur Portierung auf den VIP-Prozessor wurde nun ein Entwicklungssystem benötigt. Im Rahmen dieser Arbeit wurde ein existierender C-Compiler auf den Prozessor angepasst. Als Compiler wurde ein Produkt der Free Software Foundation ausgewählt, das unter dem Namen GNU-C bekannt ist. Dieser optimierende Compiler ist durch das Erstellen einer sogenannten Maschinenbeschreibung auf einen neuen Prozessor portierbar. Der Compiler wird kontinuierlich erweitert und ist kostenlos erhältlich.},
keywords = {compiler, optimization},
note = {Diplomarbeit, in German},
}
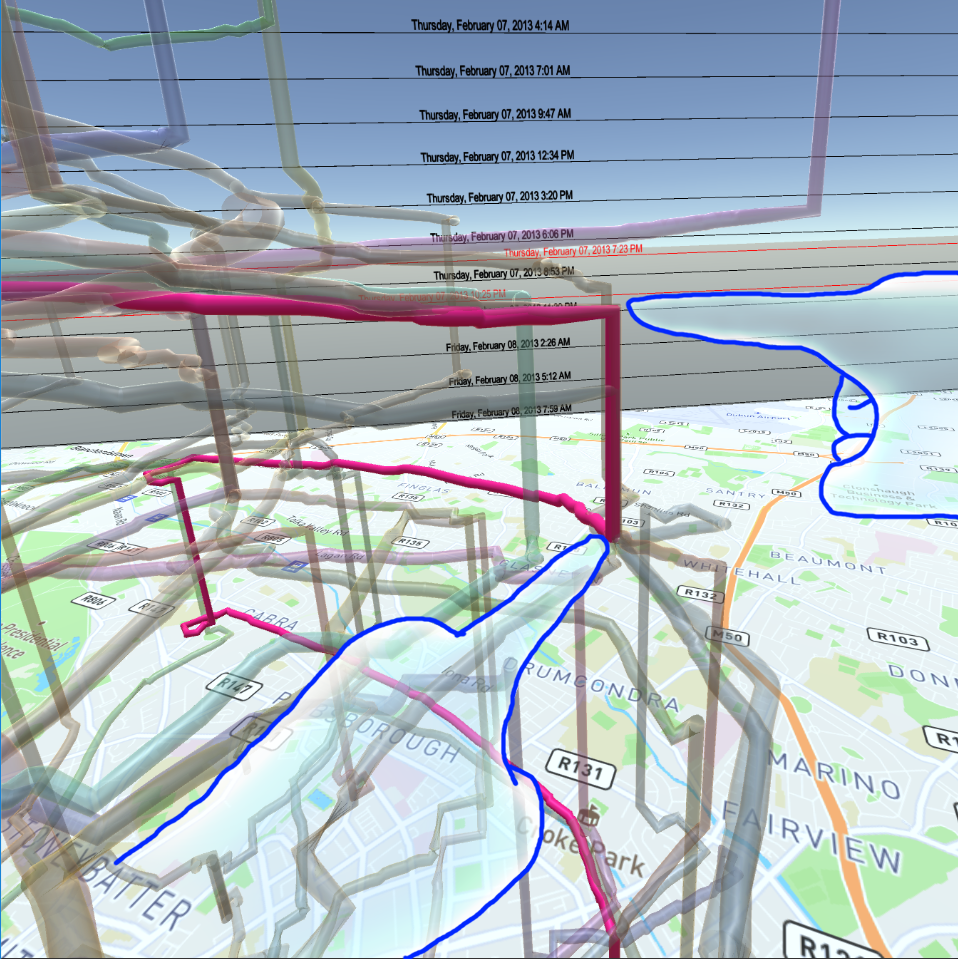
Difference Visualizations
When managing multiple versions of a given document or dataset, gaining a quick overview of the differences between such versions is critical. Here we investigate difference visualization methods that facilitate seeing what is different between versions.
@comment{c, c={STYLE: Author entry should be in "[von] Last [Jr.], First and ..." format}}
@comment{c, c={STYLE: Author trailing* on last name is grad, trailing+ is undergrad student}}
@comment{c, c={STYLE: no year or series or publisher name in booktitle}}
@comment{c, c={STYLE: series should have format "ACRONYM '##", with 2-digit year}}
@comment{c, c={STYLE: conference articles published in journal have conference name in note= and journal acronym in series=}}
@comment{c, c={STYLE: articleno= and numpages= are both supported}}
@comment{c, c={STYLE: pdf= is link to PDF, video= is link to video, teaser= is link to teaser image}}
@comment{c, c={STYLE: doi= is link to doi (or publisher page), url= is link to webpage}}
@comment{c, c={STYLE: note= shows up in the list, footnote= shows up in the individual pages}}
@comment{c, c={STYLE: footnote= is the right place for pdf2, url2, video2, other supplementary materials, etc.}}
@comment{c, c={STYLE: to comment out a field, just prefix it with "commented-", e.g., "commented-year"}}
@comment{c, c={canonical field order: 'title', 'author', 'journal', 'booktitle', 'publisher', 'series', 'issn', 'isbn', 'institution', 'school', 'type', 'howpublished', 'year', 'month', 'volume', 'number', 'pages', 'articleno', 'numpages', 'doi', 'url', 'pdf', 'video', 'teaser', 'abstract', 'keywords', 'award', 'note', 'footnote'}}
@comment{***************************books&special_issues*******************************}
@comment{zachman2025special,
title = {Special Section on the Best Papers of the 20th EuroXR International Conference (EuroXR 2023)},
author = {Walczak, Krzysztof and Zachmann, Gabriel and Niamut, Omar A. and Johnsen, Kyle and Stuerzlinger, Wolfgang and Bourdot, Patrick and Welch, Greg and Alcaniz Raya, Mariano},
journal = {Computers & Graphics},
publisher = {Elsevier},
series = {C&G},
year = {2025},
month = {Nov},
commented-volume = {48},
commented-number = {C},
pages = {1-2},
commented-doi = {https://doi.org/10.1016/j.cag.2025.00.000},
abstract = {We are delighted to introduce this special section of Computers & Graphics, which presents extended versions of the best papers selected from the 20th EuroXR International Conference (EuroXR 2023). The conference was held in Rotterdam, The Netherlands, from November 29 to December 1, 2023, co-located with the Immersive Tech Week. It continues a rich tradition of EuroXR events focused on advances in Virtual, Augmented, and Mixed Reality (VR, AR, MR), collectively referred to as Extended Reality (XR). Since its inception in 2004 under the INTUITION Network of Excellence and subsequent evolution into the EuroXR International Conference, the event has consistently served as a platform to present cutting-edge research, foster collaborations among academia, industry, and public institutions, and promote the adoption of XR technologies across various domains.
The scientific track of EuroXR 2023 maintained a rigorous review process to ensure high quality and impact. A total of 42 papers were submitted to the scientific program, out of which 14 were accepted (an acceptance rate of 33%) across different categories: long, medium, and short papers. Each submission underwent a thorough double-blind peer review process by at least three independent experts, followed by a rebuttal phase and final discussions among the reviewers. The scientific program chairs then made final decisions based on comprehensive meta-reviews. A dedicated Best Papers Awards Committee subsequently evaluated the accepted papers, identifying outstanding contributions, which were then invited for significant extension and re-review for publication in this special section of Computers & Graphics.
The two articles presented here exemplify the diversity and high quality of research at EuroXR 2023:
Enhancing anatomy learning through collaborative VR? An advanced investigation by Haya Almaree, Roland Fischer, René Weller, Verena Uslar, Dirk Weyhe, and Gabriel Zachmann explores the potential benefits of collaborative VR learning environments in medical education. The authors developed a multi-user VR Anatomy Atlas and conducted two comprehensive user studies comparing individual and collaborative learning modes. Their findings offer valuable insights into the effectiveness, usability, and motivational aspects of collaborative VR learning, suggesting that although collaboration does not necessarily enhance learning outcomes or motivation in anatomy education, it opens important questions regarding cognitive load and system usability that require further research.
Psychophysiology of rhythmic stimuli and time experience in virtual reality by Stéven Picard and Jean Botev investigates how rhythmic auditory and visual stimuli influence users' perception of time and task performance within VR environments. The authors systematically analyze the interplay between sensory stimuli, physiological responses (such as eye-tracking data and body temperature), and subjective time estimation. Their results reveal nuanced relationships between stimulus modality, tempo, fatigue, and time perception, offering promising directions for designing VR environments that strategically modulate user experience through rhythm and sensory cues.
Collectively, these papers highlight valuable advancements at the intersection of XR technology, human factors, education, and psychophysiology. They demonstrate how XR can be leveraged not only to improve learning and interaction but also to deepen our understanding of human cognitive and sensory experiences in immersive contexts.
We express our sincere gratitude to all the authors for their outstanding contributions and to the reviewers for their thorough work in maintaining the high standards of Computers & Graphics. We also extend special thanks to the EuroXR 2023 Organizing Committee and the Immersive Tech Week team for hosting a vibrant conference that successfully bridged research, practice, and innovation in Extended Reality.
For further information about EuroXR and future conferences, please visit the official EuroXR Association website at https://www.euroxr-association.org.
We hope that readers will find these contributions as inspiring and thought-provoking as we did.},
keywords = {3D user interfaces, virtual reality, augmented reality},
note = {To appear},
}
@proceedings{zachman2023euroxr,
title = {Virtual Reality and Mixed Reality, 20th EuroXR International Conference},
author = {Zachmann, Gabriel and Walczak, Krzysztof and Niamut, Omar A. and Johnsen, Kyle and Stuerzlinger, Wolfgang and Alcaniz Raya, Mariano and Bourdot, Patrick and Welch, Greg},
publisher = {Springer},
series = {EuroXR '23},
volume = {LNCS 14410},
year = {2023},
month = {Nov},
doi = {https://doi.org/10.1007/978-3-031-48495-7},
teaser = {teasers/EuroXR23.png},
abstract = {We are pleased to present in this LNCS volume the scientific proceedings of the 20th EuroXR International Conference (EuroXR 2023), organized in colocation with the Immersive Tech Week, Rotterdam, the Netherlands, and held during November 29 – December 1, 2023.
This conference follows a series of successful international conferences initiated in 2004 by the INTUITION Network of Excellence on Virtual and Augmented Reality, which was supported by the European Commission until 2008. From 2009 through 2013, it was embedded in the Joint Virtual Reality Conferences (JVRC). Since then, it was known as EuroVR, then EuroXR International Conference, in line with the renaming of the umbrella association.
The focus and aim of the EuroXR conferences is to present, each year, novel results and insights in Virtual Reality (VR), Augmented Reality (AR), and Mixed Reality (MR), commonly referred to under the umbrella of Extended Reality (XR), including software systems, immersive rendering technologies, 3D user interfaces, and applications. EuroXR also aims to foster engagement between European industries, academia, and the public sector, to promote the development and deployment of XR techniques in new and emerging, but also in existing fields. To this end, all EuroXR conferences include not only a scientific track, but also an application-oriented track, with its own proceedings.
Since 2017, the EuroXR Association has collaborated with Springer to publish the proceedings of the scientific track of its annual conference. In order to maintain the scientific standards to be expected from such a conference, we established a number of committees overseeing the process of creating a scientific program: the scientific program chairs, leading an International Program Committee (IPC) made up of international experts in the field, and the EuroXR academic task force.
For the 2023 issue, a total of 42 papers were submitted, out of which 14 papers were accepted (4 long, 8 medium, and 2 short papers). This amounts to an acceptance ratio of 33%. The selection process involved a double-blind peer-review process (each and every paper was reviewed by at least 3 members of the IPC, in many cases even 4), followed by a rebuttal phase, and a final discussion and scoring phase amongst the revewiers. Based on the review reports, the scores, and the reviewers’ discussions, the scientific program chairs took the final decision and wrote a meta-review for each paper.
This year, the scientific program of EuroXR and, hence, this LNCS volume, is organized into three sections: Interaction in Virtual Reality, Designing XR Experiences, and Human Factors in VR: Performance, Acceptance, and Design.
In addition to the regular scientific papers track, EuroXR invited three keynote speakers: Tabitha C. Peck (Davidson College, Davidson, NC, USA), Ferran Argelaguet (Research Scientist, Hybrid team, IRISA/Inria, Rennes, France), and Zerrin Yumak (Assistant Professor of Utrecht University, The Netherlands). Furthermore, the conference hosted an application track, demos and posters sessions, and lab tours. Finally, there were dedicated sessions, for instance, by Greg Welch on VERA, and a workshop on “Vocational Training”.
We would like to thank all the IPC members and external reviewers for their insightful reviews, which helped ensure the high quality of papers selected for the scientific track. Furthermore, we would like to thank the application chairs, demos and posters chairs, and the local organizers of EuroXR 2023.
We are also grateful to the staff of Springer for their support and advice during the preparation of this LNCS volume.},
keywords = {virtual reality, augmented reality, extended reality},
}
@proceedings{teather2020vrstproceedings,
title = {26th Symposium on Virtual Reality Software and Technology 2020},
author = {Teather, Robert J. and Joslin, Chris and Stuerzlinger, Wolfgang and Figueroa, Pablo and Hu, Yaoping and Batmaz, Anil Ufuk and Lee, Wonsook and Ortega, Francisco},
publisher = {ACM},
series = {VRST '20},
year = {2020},
month = {Nov},
doi = {https://doi.org/10.1145/3385956},
teaser = {teasers/VRST2020.png},
abstract = {Welcome to the 26th ACM Symposium on Virtual Reality Software and Technology (VRST 2020) for exchanging knowledge and experience. It is our pleasure to virtually host VRST 2020 from Ottawa, Canada, for the safety of attendees, due to the on-going COVID-19 pandemic.
As a premier international forum for advanced in virtual reality technology, VRST 2020 received 132 paper submissions from all continents. Its program committee (PC) consisted of 27 esteemed researchers to coordinate additional 176 expert reviewers. Each submission underwent at least three reviews for its novelty, technical quality, and impact to the field. The final program of VRST 2020 was thus composed of 28 full papers and 7 short papers, yielding an overall acceptance rate of 26%. The topics of these papers ranged from simulation & graphics, 3D reconstruction & computer vision, haptics, navigation & locomotion, collaborations, avatars, and display & visual perception, to applications. In addition, a total of 59 posters and demos were submitted, and 43 of these were accepted to the technical program.
Moreover, the program was honoured by two distinguished keynote speakers: Doug Bowman from Virginia Tech University (USA) and Mary Whitton of the University of North Carolina at Chapel Hill (USA). As two of the foremost names in the field of virtual reality, they presented stimulating insights to energize the program and provide invaluable insights to new and seasoned researchers alike.
Special thanks are extended to the PC members and expert reviewers for all their dedicated efforts and thoughtful reviews. Their hard work uniquely empowered the program to be interesting.
We hope that attendees will find VRST 2020 inspiring, as it spotlights the latest research in the growing field of Virtual Reality. The event aims to foster collaboration and instigate further growth in this exciting field.},
keywords = {3D user interfaces, virtual reality},
}
@book{marriott2018immersiveanalytics,
title = {Immersive Analytics},
author = {Marriott, Kim and Schreiber, Falk and Dwyer, Tim and Klein, Karsten and Henry Riche, Nathalie and Itoh, Takayuki and Stuerzlinger, Wolfgang and Thomas, Bruce H.},
publisher = {Springer},
year = {2018},
month = {Oct},
volume = {LNCS 11190},
numpages = {371},
doi = {https://doi.org/10.1007/978-3-030-01388-2},
teaser = {teasers/iabook.png},
abstract = {We live in an age where the amount and complexity of data available to us far surpass our ability to understand or to utilise them in decision-making. Analysis of such data is not only common in the physical, social, and life sciences, but is becoming an integral part of effective planning in business, government, e-health, and many other aspects of modern society. Furthermore data analytics is no longer solely the preserve of scientists and professional analysts as personalised data analytics becomes increasingly common.
Visual analytics has become a key technology for human-in-the-loop data analysis. While the standard definition for visual analytics is agnostic of the actual interface devices employed by visual analytics systems, the affordances of the display and input devices used for analysing data strongly affect the experience of the users of such systems and, thereby, their degree of engagement and productivity. For practical visual analytics tools, the platform for interaction is almost always a standard desktop computer. A systematic approach to developing analysis and decision support tools that move beyond the desktop is lacking.
Immersive analytics is a new interdisciplinary field that brings together researchers and practitioners from data visualisation, visual analytics, virtual and mixed reality, human–computer interaction, and human-in-the-loop algorithmics to explore these new forms of analytics tools. The goal is to remove barriers between people, their data, and the tools they use for analysis by developing more engaging, embodied analysis tools that support data understanding and decision-making everywhere and by everyone, either working individually or collaboratively.
This book is the outcome of two coordinated workshops on immersive analytics held in 2016. The first in Shonan, Japan, took place in February and organised by Takayuki Itoh, Kim Marriott, Falk Schreiber, and Uwe Wössner with the help of Karsten Klein, the second was held in June at Dagstuhl, Germany, and was organised by Tim Dwyer, Nathalie Henry Riche, Wolfgang Stuerzlinger, and Bruce H. Thomas, again with the help of Karsten Klein. In all, 25 leading international experts in data visualisation, visual analytics, human–computer interaction, virtual reality and augmented reality attended the first workshop, with another 38 experts attending the second. There was a sizeable overlap of experts between the two workshops that provided a sensible continuity of concepts.
The two workshops explored the definition of immersive analytics and identified the structure and focus of this book. A working group for each chapter was formed at the workshops, with the participation of invited experts as needed, and the groups wrote the chapters contained in this book. A critical goal was to develop a vision of the research domain for immersive analytics and a roadmap for future investigations. Authors submitted manuscripts for their chapters in mid-2017. These initial versions were first reviewed "internally" by one of the book editors. After an initial round of revision based on these internal reviews, the updated manuscripts were sent to expert reviewers invited from the community. We are grateful to these people for their detailed and insightful reviews.},
keywords = {immersive analytics, visual analytics, visualization},
}
@proceedings{arif2018socio,
title = {Socio-Technical Aspects of Text Entry: {MobileHCI} 2018 Workshop},
author = {Arif, Ahmed Sabbir and Stuerzlinger, Wolfgang and Dunlop, Mark D. and Yi, Xin and Seim, Caitlyn},
series = {TEXT '18},
year = {2018},
month = {Sep},
url = {http://ceur-ws.org/Vol-2183},
teaser = {teasers/TEXT2018.png},
abstract = {Mobile text entry has become an integral part of our daily life. We regularly input text on smartphones, laptops, desktops and increasingly on smartwatches, VR systems, interactive tabletops/walls, and kiosks. This text entry is done in all social settings, from solo individuals writing private notes, through social networking in bars with friends, to jointly writing on collaborative devices in public spaces. Traditional tap-based input is increasingly being replaced with or supplemented by voice input or multimodal control. With the ubiquity of text entry, it is becoming increasingly important to consider socio-technical systems perspectives in the design, development, and evaluation of new techniques. The purpose of this one-day workshop is to share and encourage research exploring various socio-technical aspects of text entry, including social and cultural impacts, developing socially and culturally acceptable techniques, and techniques to support all users of varying ages, social and technical backgrounds, language, and physical abilities.},
keywords = {text entry},
}
@proceedings{banic2015suiproceedings,
title = {3rd Symposium on Spatial User Interaction 2015},
author = {Banic, Amy and Suma, Evan and Steinicke, Frank and Stuerzlinger, Wolfgang},
publisher = {ACM},
series = {SUI '15},
year = {2015},
month = {Aug},
doi = {https://doi.org/10.1145/2788940},
teaser = {teasers/SUI2015.png},
abstract = {It is our great pleasure to welcome you to the third ACM Symposium on Spatial User Interaction. This event focuses on the user interface challenges that appear when users interact in the space where the flat, two-dimensional, digital world meets the volumetric, physical, three-dimensional (3D) space we live in. The symposium considers both spatial input as well as output, with an emphasis on the issues around the interaction between humans and systems. Due to the advances in 3D technologies, spatial interaction is now more relevant than ever. Powerful graphics engines and high-resolution screens are now ubiquitous in everyday devices, such as tablets and mobile phones. Moreover, new forms of input, such as multi-touch, finger and body tracking technologies are now easily available, and more and more commercial 3D systems with spatial interaction capabilities exist, many priced at the consumer level. However, the challenges, limitations, and advantages of leveraging this third dimension in human-computer interfaces are still not yet fully understood. These questions will only become more relevant as these emerging technologies continue to cross the barrier towards wide adoption.
The call for papers attracted 48 submissions from Asia, Europe, Australia, and North and South America in all areas of Spatial User Interaction research. The international program committee consisting of 19 experts in the topic areas and the three program chairs handled the review process. Eight submissions were reviewed by the program chairs and rejected without further review due to being incomplete, insufficient quality, or inappropriate for the symposium topic. All other submissions received at least four detailed reviews, two from members of the international program committee and two or more from external reviewers. The reviewing process was double-blind, with the authors' identities visible only to the program chairs and the primary program committee member assigned to the paper. In the end, the program committee accepted 17 papers (10 long, 7 short), corresponding to an overall acceptance rate of 35%. Additionally, 11 posters complement the program and appear in the proceedings. Furthermore, three research demonstrations were accepted and will be presented at the symposium. We also encourage attendees to attend the keynote talk, TRANSFORM: Beyond Tangible Bits, Towards Radical Atoms, presented by Hiroshi Ishii from the MIT Media Lab.},
keywords = {3D user interfaces, virtual reality},
}
@article{steinicke2015spatial,
title = {Spatial Interfaces},
author = {Steinicke, Frank and Stuerzlinger, Wolfgang},
journal = {Computer Graphics and Applications},
publisher = {IEEE},
series = {CG&A},
year = {2015},
month = {Jul},
volume = {35},
number = {4},
pages = {6-7},
doi = {https://doi.org/10.1109/MCG.2015.92},
abstract = {CG&A welcomes Frank Steinicke (University of Hamburg) and Wolfgang Stuerzlinger (Simon Fraser University) as new members to its editorial board and as the new coeditors of the Spatial Interfaces department.},
keywords = {3D user interfaces, virtual reality},
}
@article{steinicke2015special,
title = {Special Section on Spatial User Interaction},
author = {Steinicke, Frank and Stuerzlinger, Wolfgang and Suma, Evan},
journal = {Computers & Graphics},
publisher = {Elsevier},
series = {C&G},
year = {2015},
month = {May},
volume = {48},
number = {C},
pages = {A1-A2},
doi = {https://doi.org/10.1016/j.cag.2015.03.002},
abstract = {It is our great pleasure to present you with the Computers & Graphics special section on Spatial User Interaction (SUI). The special section contains extended versions of the best scientific papers from the 2nd ACM Symposium on Spatial User Interaction (SUI׳14), which was held Oct. 4–5, 2014 in Honolulu, USA. The SUI symposium focuses on the user interface challenges that appear when users interact in the space where the flat, two-dimensional, digital world meets the volumetric, physical, three-dimensional (3D) space we live in. This considers both spatial input as well as output, with an emphasis on the issues around the interaction between humans and systems. The goal of the symposium is to provide an intensive exchange between academic and industrial researchers working in the area of SUI and to foster discussions among participants.
The symposium call for papers attracted 62 submissions from Asia, Europe, Australia, and North and South America in all areas of Spatial User Interaction research. The international program committee consisting of 19 experts in the topic areas and the two program chairs handled the highly competitive and selective review process. In the end, the program committee accepted overall 18 (11 long papers plus 7 short papers) out of 62 submissions, which corresponds to an acceptance rate of 29% in total.
The SUI׳14 award chairs, Bruce Thomas from the University of South Australia and Patrick Baudisch from the Hasso-Plattner-Institut in Germany, selected the best full and best short papers from these 18 submissions, which received the invitation to be published as extended articles in this special section:
The article "Coordinated 3D Interaction in Tablet- and HMD-Based Hybrid Virtual Environments" written by Jia Wang, Robert Lindeman proposes a novel spatial interactive solution using a coordinated, tablet- and HMD-based, hybrid virtual environment system.
The article "Principles, Interactions and Devices for Real-World Immersive Modeling" co-authored by Mark Mine, Arun Yoganandan, and Dane Coffey presents an approach that combines the natural and intuitive power of virtual reality interaction, the precision and control of 2D touch surfaces, and the richness of a commercial modeling package.
The article "VideoHandles: Searching through Action Camera Videos by Replicating Hand Gestures" by Jarrod Knibbe, Sue Ann Seah, and Mike Fraser introduces a detailed exploration of VideoHandles, a novel interaction technique to support rapid review of wearable video camera data by re-performing gestures as a search query.},
keywords = {3D user interfaces, virtual reality},
}
@proceedings{steinicke2014suiproceedings,
title = {2nd Symposium on Spatial User Interaction 2014},
author = {Steinicke, Frank and Stuerzlinger, Wolfgang and Suma, Evan},
publisher = {ACM},
series = {SUI '14},
year = {2014},
month = {Oct},
doi = {https://doi.org/10.1145/2659766},
teaser = {teasers/SUI2014.png},
abstract = {It is our great pleasure to welcome you to the second ACM Symposium on Spatial User Interaction - SUI'14. This event focuses on the user interface challenges that appear when users interact in the space where the flat, two-dimensional, digital world meets the volumetric, physical, threedimensional (3D) space we live in. This considers both spatial input as well as output, with an emphasis on the issues around the interaction between humans and systems. The goal of the symposium is to provide an intensive exchange between academic and industrial researchers working in the area of SUI and to foster discussions among participants. The SUI symposium was held October 4-5, 2014, in Honolulu, USA.
The call for papers attracted 62 submissions from Asia, Europe, Australia, and North and South America in all areas of Spatial User Interaction research. The international program committee consisting of 19 experts in the topic areas and the three program chairs handled the highly competitive and selective review process. Every submission received at least four detailed reviews, two from members of the international program committee and two or more from external reviewers. The reviewing process was double-blind, where only the program chairs as well as the program committee member, who was assigned to each paper to identify external reviewers, knew the identity of the authors. In the end, the program committee accepted overall 18 (11 long papers plus 7 short papers) out of 62 submissions, which corresponds to an acceptance rate of 29% in total. Additionally, 25 posters complement the program and appear in the proceedings. Furthermore, several demos were presented at the symposium. The topics range from spatial interaction techniques, gestures, vision in 3D space, spatial applications, to interaction with multi-touch technologies and spatial interaction in augmented reality. We hope that these proceedings will serve as a valuable reference for Spatial User Interaction researchers and developers.},
keywords = {3D user interfaces, virtual reality},
}
@proceedings{daiber2013isis3dproceedings,
title = {Interactive Surfaces for Interaction with Stereoscopic {3D}: Tutorial and Workshop at {ITS} 2013},
author = {Daiber, Florian and de Araujo, Bruno Rodrigues and Steinicke, Frank and Stuerzlinger, Wolfgang},
booktitle = {Conference on Interactive Tabletops and Surfaces},
publisher = {ACM},
series = {ISIS3D '13},
year = {2013},
month = {Oct},
pages = {483–486},
doi = {https://doi.org/10.1145/2512349.2512351},
abstract = {With the increasing distribution of multi-touch capable devices multi-touch interaction becomes more and more ubiquitous. Multi-touch interaction offers new ways to deal with 3D data allowing a high degree of freedom (DOF) without instrumenting the user. Due to the advances in 3D technologies, designing for 3D interaction is now more relevant than ever. With more powerful engines and high resolution screens also mobile devices can run advanced 3D graphics, 3D UIs are emerging beyond the game industry, and recently, first prototypes as well as commercial systems bringing (auto-) stereoscopic display on touch-sensitive surfaces have been proposed. With the Tutorial and Workshop on ``Interactive Surfaces for Interaction with Stereoscopic 3D (ISIS3D)'' we aim to provide an interactive forum that focuses on the challenges that appear when the flat digital world of surface computing meets the curved, physical, 3D space we live in.},
keywords = {3D user interfaces, virtual reality},
}
@proceedings{stuerzlinger2013suiproceedings,
title = {1st Symposium on Spatial User Interaction 2013},
author = {Stuerzlinger, Wolfgang and Steinicke, Frank},
publisher = {ACM},
series = {SUI '13},
year = {2013},
month = {Jul},
doi = {https://doi.org/10.1145/2491367},
teaser = {teasers/SUI2013.png},
abstract = {It is our great pleasure to welcome you to the first ACM Symposium on Spatial User Interaction - SUI'13. This new event focuses on the user interface challenges that appear when users interact in the space where the flat, twodimensional, digital world meets the volumetric, physical, three-dimensional (3D) space we live in. This considers both spatial input as well as output, with an emphasis on the issues around the interaction between humans and systems. The goal of the symposium is to provide an intensive exchange between academic and industrial researchers working in the area of SUI and to foster discussions among participants. The first SUI symposium was held July 20-21, 2013 in Los Angeles, USA.
The call for papers attracted 31 submissions from Asia, Europe, Australia, and North and South America in all areas of Spatial User Interaction research. The international program committee consisting of 15 experts in the topic areas and the two program chairs handled the highly competitive and selective review process. Every submission received at least four detailed reviews, two from members of the international program committee and two or more from external reviewers. The reviewing process was double-blind, where only the program chairs as well as the program committee member, who was assigned to each paper to identify external reviewers, knew the identity of the authors.
In the end, the program committee accepted overall 12 (8 full papers plus 4 short papers) out of 31 submissions, which corresponds to an acceptance rate of 26% for full papers (and 38% in total). Additionally 12 posters and demonstrations will complement the program and appear in the proceedings. The topics range from spatial interaction techniques, vision in 3D space, applications, to interaction with multi-touch technologies and in augmented reality. We hope that these proceedings will serve as a valuable reference for Spatial User Interaction researchers and developers.
Putting together the content for SUI'13 was a team effort. We first thank the authors for providing the content of the program. Special thanks go to the members of the international program committee, who successfully dealt with the reviewing load. We also thank the external reviewers.},
keywords = {3D user interfaces, virtual reality},
}
@proceedings{stuerzlinger2012vrstproceedings,
title = {Symposium on Virtual Reality Software and Technology 2012},
author = {Stuerzlinger, Wolfgang and Latoschik, Marc Erich and Kapralos, Bill},
publisher = {ACM},
series = {VRST '12},
year = {2012},
month = {Dec},
doi = {https://doi.org/10.1145/2407336},
teaser = {teasers/VRST2012.png},
abstract = {It is our great pleasure to welcome you to the 2012 ACM Symposium on Virtual Reality Software and Technology - VRST'12. VRST has become one of the major scientific events in the area of virtual reality since its debut in 1994 in Singapore. The symposium continues its tradition as an international forum for the presentation of research results and experience reports on leading edge issues of software, hardware and systems for Virtual Reality. The mission of the symposium is to share novel technologies that fulfill the needs of Virtual Reality applications and environments and to identify new directions for future research and development. VRST gives researchers and practitioners a unique opportunity to share their perspectives with others interested in the various aspects of Virtual Reality and owes its existence to a vibrant and productive research community. This year, VRST was held December 10-12, 2012 in Toronto, Ontario, Canada.
The call for papers attracted 88 submissions from Asia, Europe, Australia, and North and South America in all areas of Virtual Reality research. Particular attention was given to work on system with a special track focusing on architectures, frameworks, reusability, adaptivity, and performance testing and evaluation. An international program committee consisting of 16 experts in the topic areas and the three program chairs handled the highly competitive and selective review process. Almost every submission received four or more reviews, two from members of the international program committee and two from external reviewers. Reviewing was double-blind, where only the program chairs and the program committee member assigned to identify external reviewers knew the identity of the authors.
In the end, the program committee was able to accept 25 out of 88 submissions, which corresponds to an acceptance rate of 28%. For posters, 15 out of 32 submissions will appear in the proceedings. The topics range from tracking, augmented and mixed reality, interaction, navigation and locomotion, collaboration, haptics, simulation, agents and behaviors to two sessions for a systems track. We hope that these proceedings will serve as a valuable reference for Virtual Reality researchers and developers.},
keywords = {virtual reality, 3D user interfaces},
}
@article{bowman2009special,
title = {Special Issue on Current Trends in {3D} User Interface Research},
author = {Bowman, Doug and Fröhlich, Bernd and Kitamura, Yoshifumi and Stuerzlinger, Wolfgang},
journal = {Int. Journal of Human-Computer Studies},
publisher = {Elsevier},
series = {IJHCS},
year = {2009},
month = {Mar},
volume = {67},
number = {3},
pages = {223-224},
doi = {https://doi.org/10.1016/j.ijhcs.2008.10.003},
abstract = {Hardware, software, and in particular users now seem ready to engage with computer-generated 3D worlds and the appropriate 3D user interfaces (3D UIs) for interacting with such worlds. 3D UIs have traditionally only been used in very specific application domains such as virtual reality (VR) and augmented reality (AR) environments, digital content creation (DCC) systems, computer-aided design (CAD) systems, visualization systems, and computer games. Now they are beginning to appear in operating systems, on personal digital assistants (PDAs) and mobile phones, and in console gaming systems (e.g., Nintendo's Wii). Even 3D cinema has been given a second chance, and stereoscopic versions of movies are produced on a regular basis. Consequently, new television systems are being equipped with 3D functionality. These examples show that the demand for and the use of 3D UIs is significantly increasing.
The IEEE Symposium on 3D User Interfaces (3DUI) was established in 2006 following two successful workshops—the 2004 workshop "Beyond Wand and Glove Based Interaction" and the 2005 workshop "New Directions in 3D User Interfaces." Today, the 3DUI symposium is the premier conference for all types of 3D user interface research for desktop and off-the-desktop environments, including novel input device designs, interaction techniques, evaluation methods, and user studies.
In this special issue of IJHCS, we are pleased to present extended versions of three outstanding papers that were originally presented at the 3DUI 2007 and 3DUI 2008. An additional paper resulting from an open call was also accepted to this special issue.
The first paper, by Hachet et al. (2009), describes a set of widgets that provide a comprehensive solution for point of interest (POI) navigation in 3D environments. It allows users to quickly navigate to a particular view, explore a 3D scene, or investigate a single object in detail, and it can be used on a variety of display devices. These basic concepts are also extended to other uses beyond navigation alone.
The work by Vanacken et al. (2009) presents two new 3D selection techniques, 3D Bubble Cursor and Depth Ray. Both are targeted at selection in dense and occluded 3D virtual environments. The user studies vary both environment density and target visibility to evaluate the new techniques against a standard 3D point cursor. The effect of auditory and haptic feedback on the selection process is also investigated in a study. The results show that the new techniques enable efficient selection of hidden objects.
The paper by Pusch et al. (2009) presents a new method for providing a pseudo-haptic sensation in an augmented reality setting. The central idea is to displace the virtual representation of the hand from the actual position of the real hand depending on the strength of a virtual flow field. When a user places the hand in a virtual flow field and tries to maintain the hand's position at a cued location, a flow pressure-like sensation is perceived. Experimental results show that different force field strength levels can be discriminated.
Finally, Sharlin et al. (2009) present a novel system and a set of measures for assessing cognitive mapping abilities in the context of a wayfinding task. The hardware setup consists of a projection display for the presentation of virtual environments and a tangible tabletop interface for building a physical model of a seen environment. The cognitive mapping abilities of the users are assessed by recording and analyzing the building progress of the physical model. Since this setup has proven to be sensitive to factors affecting cognitive mapping it allows the computer-supported assessment of this important human ability.
All of these papers contain high-quality contributions to the growing field of 3D user interfaces. We thank the authors for their stimulating work and the reviewers for their constructive and detailed comments.},
keywords = {3D user interfaces, virtual reality},
}
@comment{c, c={leave the "_stuerzlinger" in the ID to enable umlaut-free search!}}
@proceedings{coquillart_stuerzlinger20083duiproceedings,
title = {Symposium on {3D} User Interfaces 2008},
author = {Coquillart, Sabine and Stürzlinger, Wolfgang and Kiyokawa, Kiyoshi},
publisher = {IEEE},
series = {3DUI '08},
year = {2008},
month = {Mar},
doi = {https://doi.org/10.1109/3DUI.2008.4476581},
teaser = {teasers/3DUI2008.png},
abstract = {Welcome to the IEEE Symposium on 3D User Interfaces 2008 (3DUI 2008), organized in Reno, Nevada on March 8-9, 2008. The symposium is co-located with IEEE Virtual Reality 2008 and with the symposium on Haptic Interfaces. 3DUI 2008 is the third international symposium focused on the topic of 3D UIs. It builds on successful 3DUI workshops in 2004 and 2005, as well as the IEEE 3DUI Symposiums in 2006 and 2007. Although a recent area of research, 3DUI is already a very well established topic and rapidely expanding. The submissions covered a variety of approaches ranging from handheld devices, desktop solutions, gesture, sound, haptics, augmented/mixed reality, to immersive systems.
This year, the program co-chairs received 67 submissions (45 papers and 22 technotes) in all areas of three-dimensional user interfaces. Each paper or technote was reviewed by at least two reviewers from the international program committee and two external reviewers. The review summary written by the primary reviewer provided the basis for a discussion among the reviewers when necessary. Reviewing was double-blind, i.e. the identity of the authors was known only to the program chairs and the program committee members responsible for choosing external reviewers for the submission. The acceptance rate was very selective at 28 % (31 % for papers and 23 % for technotes), and only 19 submissions were accepted (14 papers and 5 technotes). In addition, this year the proceedings also include 2 pages presentations for each of the 18 posters presented during the symposium.
We wish to thank all the persons who made 3DUI 2008 possible. Special thanks go to the program committee members and the reviewers for their insightful and thorough reviews of the submitted papers in a very short review period. We want to thank the posters chairs Raimund Dachselt, Robert Lindeman and Kouichi Matsuda who did handled the hard job of managing the posters. We also acknowledge the support by IEEE, the IEEE Visualization and Graphics Technical Committee as well as the VR steering committee. Most of the organization of IEEE 3DUI as well as local arrangement is shared with IEEE VR. We are grateful to Bill Sherman and the IEEE VR organizing committee for taking care of the organization of IEEE 3DUI 2008. Many thanks to James Stewart of Precision Conference Systems for his support of the reviewing process. Thanks also to Torsten Möllen and especially Meghan Haley for managing the printing process. Finally, we thank all the authors for their excellent submissions, without which this symposium could not exist.
We hope that this symposium will continue to connect researchers of all backgrounds in 3D user interface research and be enjoyable, interesting and stimulating for the participants. Please enjoy the 2008 3DUI Symposium !},
keywords = {3D user interfaces, virtual reality},
}
@proceedings{stuerzlinger20073duiproceedings,
title = {Symposium on {3D} User Interfaces 2007},
author = {Stürzlinger, Wolfgang and Kitamura, Yoshifumi and Coquillart, Sabine},
publisher = {IEEE},
series = {3DUI '07},
year = {2007},
month = {Mar},
doi = {https://doi.org/10.1109/3DUI.2007.340764},
teaser = {teasers/3DUI2007.png},
abstract = {Welcome to the IEEE Symposium on 3D User Interfaces 2007 (3DUI 2007), which took place in Charlotte, North Carolina on March 10-11, 2007. The symposium was held just before IEEE Virtual Reality 2007. The event owes its existence to a vibrant and productive research community in 3D user interfaces. This area has emerged from many different disciplines, including virtual reality, mixed and augmented reality, human-computer interaction, computer graphics, cognitive and perceptual psychology, and 3D games. 3DUI 2007 is sponsored by the IEEE Visualization and Graphics Technical Committee and is the second symposium in this series and follows two successful IEEE VR workshops on this topic in 2004 and 2005 as well as 3DUI 2006.
The program co-chairs received 81 submissions in all areas of three-dimensional user interfaces. The review process was highly competitive and selective. This year, we changed the review process and involved an international program committee consisting of 18 experts in 3D user interfaces. Each submission received at least 4 reviews, two of which were from members of the international program committee and two from external reviewers. Reviewing was double-blind this year, and the identity of the authors was known only to the program chairs and the program committee member responsible for choosing external reviewers for the submission. The program committee members were often able to solicit reviews from some of the top experts in a particular area of research. In the end, we were able to accept 18 full papers and 7 technotes (short papers), which corresponds to an acceptance rate of 31%. The accepted papers cover a wide range of topics in 3D user interfaces, including navigation, 3D movement, 3D selection, devices, gestures, mixed & augmented reality, force-feedback interfaces, and entertainment. We would like to thank all people who made 3DUI 2007 possible. Special thanks go to the program committee members who donated their time to ensure a fair selection process. Additional thanks go to the external reviewers who participated in the review process. We also acknowledge the support by IEEE, the IEEE Visualization and Graphics Technical Committee as well as the VR steering committee for support. Finally, we would like to thank Raimund Dachselt for handling the posters. Particular thanks go to IEEE VR's general chairs, especially Doug Bowman, for their great help with the organization of this event as well as the IEEE VR local arrangement chairs and other people involved in the local organization. Many thanks to James Stewart of Precision Conference Systems for his support of the reviewing process. Thanks also to Torsten Möller and especially Meghan Haley for creating the proceedings. Finally, we thank all the authors and researchers who submitted their work to the symposium.
We believe that 3DUI 2007 connects researchers of all backgrounds in 3D user interface research and collects and disseminates the best results in this area. Enjoy the symposium!},
keywords = {3D user interfaces, virtual reality},
}
@comment{c, c={leave the "_stuerzlinger" in the ID to enable umlaut-free search!}}
@proceedings{kitamura_stuerzlinger20063duiproceedings,
title = {Symposium on {3D} User Interfaces 2006},
author = {Kitamura, Yoshifumi and Bowman, Doug and Fröhlich, Bernd and Stürzlinger, Wolfgang},
publisher = {IEEE},
series = {3DUI '06},
year = {2006},
month = {Mar},
url = {https://ieeexplore.ieee.org/servlet/opac?punumber=10952},
teaser = {teasers/3DUI2006.png},
abstract = {We are extremely pleased and honored to present the proceedings of the First IEEE Symposium on 3D User Interfaces.
3DUI 2006 owes its existence to a vibrant and productive research community. Emerging from many different disciplines, such as virtual reality, mixed reality, computer graphics, human-computer interaction, and cognitive and perceptual psychology, 3D interaction has now become a coherent research area itself. Extremely successful workshops on this topic at IEEE Virtual Reality in 2004 and 2005 convinced us and the IEEE Visualization and Graphics Technical Committee that the time was right to give the 3D user interface community its own specialized venue. Our vision for the symposium is to connect researchers of all backgrounds working on 3D user interface issues, and to collect and disseminate the best 3D interaction research in the world.
Although this is the very first 3DUI symposium, the review of papers was highly competitive and selective. The program includes 18 full papers and 8 technotes (short papers), selected from 81 submissions (a 32% acceptance rate overall). The accepted papers cover a wide range of topics in 3D user interface, including navigation, applications and implementation, collaborative and bimanual interfaces, 3D interaction techniques, augmented reality and devices.
Dr. Ravin Balakrishnan of the University of Toronto will provide the keynote address for the Symposium. Dr. Balakrishnan is well-known for his research on effective and powerful 3D interaction techniques for emerging technologies such as volumetric displays and wall-sized displays. He is also a leader in the international human-computer interaction community. Dr. Balakrishnan's presentation will challenge researchers in 3D user interfaces to think more deeply about the application of their work to real-word problems.
We would like to thank all of the people who made this first-ever 3DUI Symposium possible. First, a big thank you to all of the dedicated reviewers who participated in the peer review process - your service helped to ensure the high quality of this technical program. Thanks are due to Simon Julier and Jim Chen, general chairs of IEEE VR 2006, who helped us make the transition from workshop to symposium smoothly and easily. We also thank the IEEE, the VGTC, and the VR steering committee for their support, as well as James Steward of Precision Conference Systems. Finally we thank all of the authors and researchers who submitted their work to the Symposium.
We trust that 3DUI 2006 will be the first in a long line of successful and influential events. Enjoy the Symposium!},
keywords = {3D user interfaces, virtual reality},
}
@comment{c, c={leave the "_stuerzlinger" in the ID to enable umlaut-free search!}}
@proceedings{bowman_stuerzlinger2005newdirections,
title = {New Directions in {3D} User Interfaces},
author = {Bowman, Doug and Fröhlich, Bernd and Kitamura, Yoshifumi and Stürzlinger, Wolfgang},
publisher = {Shaker Verlag},
year = {2005},
month = {Mar},
url = {https://www.shaker.de/de/content/catalogue/index.asp?lang=en&ID=8&ISBN=978-3-8322-3830-8},
pdf = {papers/3dui_workshop.pdf},
teaser = {teasers/3dui_workshop.png},
abstract = {This workshop focuses on novel research in three-dimensional user interfaces (3D UIs). The workshop builds on and expands the scope of last year's workshop "Beyond Wand and Glove Based Interaction." The theme of the workshop will again be on moving beyond the "common" and "traditional" (if one can use those words with respect to such a young research area) approaches to 3D UIs.
Just as wands, 3D mice, and gloves became traditional input devices for 3D UIs, a handful of well-known interaction techniques and UI metaphors also became de facto standards (often because they were the default interaction techniques in widely-used software toolkits). Most of these basic techniques, however, have been around for 5-10 years. Although this could certainly change, it seems that the discovery of radical new metaphors for the "universal 3D tasks" (navigation, selection, manipulation, system control) has slowed down significantly. This does not mean, however, that we should stop doing research on interaction techniques for these tasks. Rather, it means we have to improve the existing metaphors in subtle ways, experiment with the use of new devices, and consider the use of such techniques in specific domains or by specific types of users. Recent research has shown that there is still much to be learned in this area, and that current techniques can be enhanced to dramatically improve usability .
In this workshop, we will spotlight research that investigates novel and enhanced methods of 3D interaction for immersive virtual environments (VEs), augmented and mixed reality (AR/MR), and desktop 3D systems. Relevant topics include: 3D input devices, 3D display devices, 3D interaction techniques, 3D user interface metaphors, collaborative 3D interaction, evaluation methods for 3D UIs, application of existing devices/techniques in novel contexts (e.g. to AR, UbiComp, etc., migration of existing techniques to new display platforms.},
keywords = {3D user interfaces, virtual reality},
}
@book{stuerzlinger2003practical,
title = {Practical Programming in the Unix Environment},
author = {Stürzlinger, Wolfgang},
publisher = {Pearson Custom},
year = {2003},
month = {Jan},
teaser = {teasers/practicalprogramming.png},
abstract = {Today, software bugs are clearly a constant source of frustration with computers and also pose considerable security and safety concerns. While methods exist to prove the correctness of programs, they are not fully automatic and all requires significant training. Consequently, there is no real alternative to careful and systematic testing of programs to ensure that the software fulfills its designated function (even though testing cannot guarantee the absence of bugs). A further indication of the importance of this topic is that all accepted software development practices, such as Extreme Programming, require that programmers test their systems. While testing is taught abstractly in many courses, few students realized how important thorough testing is in practice. Only in the field do they gain this experience and learn the related skills. Hand in hand with testing goes debugging, the art of finding a problem based on observable symptoms and then fixing the problem. Last, but not least, optimization of programs is a skill that is often necessary for competitive systems.
When faced with the task of helping to re-design a second-year course on practical programming, I decided that C and UNIX were the right platform to teach many of the skills necessary for practical program development. Today, many students learn Java (or similar languages) in their first year, as this provides a relatively good and safe environment for learning the fundamental concepts. However, computer science students need to know how the layers underneath a high-level programming language work. C, besides being a high-performance environment and a prerequisite to C++, exposes students to these underlying layers and hence allows them to get a better understanding of how software works. Furthermore, a lot of safety layers (e.g., automatic handling of arithmetic overflows) are not present here, which makes this an ideal vehicle to teach the importance of testing. UNIX, with its cleverly designed file system, interactive shell and scripting languages, provides an excellent environment for systematic and repeated testing. The current implementation of the course teaches the importance of testing via strict enforcement of adherence to specifications in assignments. This is done with automatic, and hence objective, testing of assignments. As the test cases are revealed only after the deadline, this forces students to think very carefully about the robustness of their programs.
This textbook is designed to be used together with "The C Programming Language" by Kernighan & Ritchie. One of the most frustrating aspects of designing a course on practical programing is that there are very few textbooks that cover important skills, such as testing, debugging, optimization, the use of scripting languages, etc. with adequate examples. Fortunately, I found that parts of a book on the UNIX environment ("The UNIX Programming Environment" by Kernighan & Pike) and parts of a book on the practice of programming ("The Practice of Programming" by Kernighan & Pike) provide a good combination. Together, the new book covers most important issues for practical program development and hence forms a good basis for a course that focuses on such issues.
It is my hope that this book will help instructors to communicate practical programming skills as well as help students to develop better software.},
keywords = {programming},
}
@comment{c, c={leave the "_stuerzlinger" in the ID to enable umlaut-free search!}}
@article{heidrich_stuerzlinger2002special,
title = {Special Issue on Hardware-Accelerated Rendering Techniques},
author = {Heidrich, Wolfgang and Stürzlinger, Wolfgang},
journal = {Journal of Graphics Tools},
series = {JGT},
year = {2002},
month = {Dec},
volume = {7},
number = {4},
pages = {1-1},
doi = {https://doi.org/10.1080/10867651.2002.10487565},
teaser = {teasers/jgt4-2002.png},
abstract = {Real-time rendering systems are approaching a level of quality and economy that surpasses even the most elaborate offline rendering system available only ten years ago. As a consequence, hardware-accelerated rendering has had a strong impact on applications such as computer games, modeling and animation, design, and scientific visualization.
The aim of this special issue of the journal of graphics tools is to provide an overview of the state-of-the-art application of graphics hardware to problems in rendering, modeling, visualization, and other areas. One of the challenges in this area is to transform traditional algorithms into a form that adapts to the restrictions dictated by graphics hardware and takes advantage of its specific processing capabilities. These constraints often mandate significant changes or simplifications to the original algorithms, and sometimes lead to the development of new methods. Often it is possible to take a solution developed for solving a particular problem with the help of graphics hardware and to apply the ideas behind it to a completely different problem. This transfer of ideas is one of the motivations behind this special issue, which brings together work from a variety of application domains.
We received 33 submissions for this special issue, illustrating the recent interest in hardware-assisted techniques. From this, we selected 11 papers to be presented here. These represent a cross section of the different application areas for hardware-accelerated rendering. From realistic illumination algorithms to shadowing, from image-based rendering to non-photorealistic rendering, from digital imaging to digital halftoning, and from geometric modeling to collision detection, the papers in this special issue demonstrate the state-of-the art in hardware-assisted techniques. We hope you will enjoy these contributions as much as we did.},
keywords = {rendering, real-time},
}
@proceedings{stuerzlinger2002giproceedings,
title = {Graphics Interface 2002},
author = {Stürzlinger, Wolfgang and {McCool}, Mike},
publisher = {CHCCS and AK Peters},
series = {GI '02},
year = {2002},
month = {May},
url = {https://graphicsinterface.org/proceedings/gi2002},
teaser = {teasers/GI2002.png},
abstract = {Welcome to Graphics Interface (GI) 2002, a conference that combines coverage of original research results in both Human-Computer Interaction and Graphics. The conference took place in Calgary, Alberta, over 27-29 May 2002, and was held in conjunction with the Artificial Intelligence 2002 and Vision Interface 2002 conferences. GI 2002 is the 28th instance of the longest running conference series in human-computer interaction and computer graphics. This event has previously been held two times in Calgary: in 1977 and in 1991.
The program co-chairs received 96 submissions in all areas of human-computer interaction and computer graphics. The large number of submissions was a pleasant surprise; however, the number of submissions also necessitated an enlargement of the program committee on short notice. We are very grateful to all the additional program committee members who agreed to take time out of their busy schedules late in 2001. By agreeing to serve, these additional members reduced the workload on other committee members and permitted us to maintain our high reviewing standards.
The overall quality of the submissions was very high, which made the selection process difficult. After considerable deliberation, the program committee selected 25 papers for publication. The international program committee consisted of 20 people from around the world. Each paper received at least 4 reviews, two of which were from members of the program committee. The reviewing process was double-blind, and the identity of the authors was known only to program co-chairs and the program committee member responsible for choosing external reviewers for each submission. The program committee members were often able to solicit reviews from some of the topmost experts in a particular area of research. We greatly appreciate the effort of the members of the program committee. We would like to extend additional thanks to the 13 members of the program committee who attended the meeting at York University, Toronto, Canada on 16 February 2002 and funded their own travel.
Graphics Interface customarily has several invited speakers. This year three invited speakers were: Saul Greenberg, Professor at the University of Calgary; John Buchanan, Electronic Arts Canada and Adjunct Professor at the University of Alberta; and David Kirk, Chief Scientist at NVIDIA. We extend our gratitude to them for sharing their inspiration in their respective fields.
We would like to thanks James Stewart for his work on the PCS electronic submission and reviewing system. His help behind the scenes made our job a lot easier! We would also like to thank Pierre Poulin and Kelly Booth for handling the liaison with AI and VI conference organizers, and Kelly Booth again for additional valuable advice. We thank further all referees for their voluntary work, Ravin Balakrishnan for handling the posters, Sara Diamond for organizing the video show, and Fred Peet, treasurer of the Canadian Human-Computer Communication Society, for keeping the finances straight, and Graphics Services at the University of Waterloo for doing such an excellent job on the proceedings. Last but not least, we send a very big thanks to Camille Sinanan, Sheelagh Carpendale, Mario Costa-Sousa, and Joerg Denzinger for the local organization of the joint conferences at the University of Calgary. Without their work, this conference would simply not have been possible.
For further information about the conference series we invite you to visit our web site: http://www.graphicsinterface.org/},
keywords = {human-computer interaction, HCI, computer graphics},
}
@proceedings{stuerzlinger2002egveproceedings,
title = {Eurographics Workshop on Virtual Environments 2002},
author = {Stürzlinger, Wolfgang and Müller, Stefan},
publisher = {ACM SIGGRAPH},
series = {EGVE '02},
year = {2002},
month = {May},
url = {https://dl.acm.org/doi/proceedings/10.5555/509709},
teaser = {teasers/EGVE2002.png},
abstract = {This book contains the proceedings of the Eighth EUROGRAPHICS Workshop on Virtual Environments. The event was held in Barcelona from May 30 to May 31, 2002. The workshop brought together scientists, developers, and users from all over the world to present and discuss the latest scientific advances in the field of Virtual Environments. 60 papers were submitted for reviewing and 22 were selected to be presented at the workshop. Most of the top research institutions working in the area submitted papers and presented their latest results. The presentations were complemented by two keynote talks from Marc Mine (Walt Disney Imagineering - VR Studio) and Eric Badiqué (European Commission - IST program). The research presented at this workshop can be classified into the following aspects of Virtual Environments (VEs): Input and Output Devices, Interaction and Navigation, Evaluation, Collaboration, Systems, and Applications. Devices focus mainly on hardware issues to interface with a simulation, whereas Interaction and Navigation techniques investigate how the raw input is best interpreted so that the user can easily achieve his/her goals. Evaluations provide data about the usability of Virtual Environments, and the importance of objective and reproducible studies can only be stressed. Virtual Environments are often used to communicate and to co-operate and this focus is evident in the research on Collaboration. The area of Systems discusses the various tradeoffs in building complete solutions and last, but not least, applications report on the transfer of research results into the real world. However, the reader should note that many contributions cross these boundaries, which reflects the multidisciplinary nature of Virtual Environments.},
keywords = {virtual reality},
}
@proceedings{stuerzlinger2000giposterproceedings,
title = {Poster Proceedings Graphics Interface 2000},
author = {Stürzlinger, Wolfgang},
series = {GI '00},
year = {2000},
month = {May},
teaser = {teasers/GIposter2000.png},
abstract = {After the success of last year, I am happy to report that Graphics Interface was again able to attract a large number of posters. This year a significant part of the submissions is from all over the world, which underlines the international aspect of the conference. Furthermore, the topics nicely cover the range of research areas that are the focus of the conference: Graphics and Human-Computer Interaction.
Posters are an excellent medium for communicating new and emerging ideas. For many first-time authors it also enables them to meet future colleagues. I encourage all conference participants to go to the poster session and meet the authors in person. Please chat with the students and provide them with feedback!},
keywords = {human-computer interaction, HCI, computer graphics},
}
@comment{************************journal_articles************************}
@comment{c, c={not sure if this is best article or proceedings}}
@comment{barrera2027dagstuhl,
title = {Sketching Beyond 2D in Extended Reality (Dagstuhl Seminar 27022)},
author = {Barrera Machuca, Mayra Donaji and Jackson, Bret and Keefe, Daniel and Habakuk, Johann and Stuerzlinger, Wolfgang},
journal = {Dagstuhl Reports},
publisher = {Schloss Dagstuhl-Leibniz-Zentrum fuer Informatik},
commented-series = {Dagstuhl Seminar 27022},
commented-issn = {2192-5283},
year = {2027},
month = {Jun},
commented-volume = {0},
commented-number = {0},
commented-pages = {1-9},
commented-doi = {https://doi.org/10.4230/DagRep.0.0.1},
commented-pdf = {papers/dagstuhl_IA.pdf},
commented-teaser = {teasers/dagstuhl.png},
commented-abstract = {Advances in virtual, mixed, and augmented reality (VR, MR, AR) have enabled a new form of computer-mediated art expression called 3D sketching, also referred to as "3D painting", "3D drawing", or a variant of "immersive sketching", which allows artists, engineers, designers, and scientists to create 3D works in a body-centric space. One of the unique aspects of 3D sketching is that it requires a computer-based tracking system to record the artist's spatial movements, which create the digital marks, and computer graphics techniques to render these marks in space. Moreover, the resulting sketch is often displayed in this same 3D space, e.g., via the use of immersive computer displays.
This dependency on computer systems to create and display the creations makes 3D sketching a unique medium that requires the union of artists and computer scientists to develop tools that artists can then use to interact with the 3D "canvas". Thus, over the last 30 years, the computing research and digital arts communities have collaborated to study and exhibit 3D sketching techniques, applications, and artifacts.
This Dagstuhl Seminar invites participants to broaden these collaborations by combining computer scientists, cognitive scientists, artists, engineers, and practitioners from both academia and industry.
The seminar will provide the unique opportunity to foster intellectual exchange on three general themes: (1) Technology: the design and implementation of novel user interfaces and hardware that address the needs of artists and other practitioners, (2) Theory: understanding the role of spatial perception and cognition in the act of sketching, and (3) Creative Practice and Education: identifying novel ways to train the next generation of 3D sketching artists. The seminar’s goals include:
- Coalescing an international community of creative practitioners, educators, and researchers working with 3D drawing, including establishing a new online presence at http://3ddrawing.org/
- Mapping and disseminating a future research agenda for 3D sketching, including a position paper and tutorials at top conferences like IEEE VR and ACM CHI.
- Making work with 3D drawing more visible to the public by contributing, exhibiting, and supporting emerging venues for exhibiting 3D drawings in places like ARSElectronica, SIGGRAPH Art Show or the IEEE XR Gallery.
- Describing training and education methods for 3D sketching, including identifying best practices that artists and schools can apply.
By fulfilling these goals, this seminar aims to guide our ability to teach and use 3D sketching tools.},
commented-keywords = {},
}
@article{li2026selectrunning,
title = {Investigating 3D Selection Performance While Running in Extended Reality: an In-depth Study of the Effect of Speed},
author = {Li*, Ang and Knibbe, Jarrod and Tatsuzawa*, Kiichiro and Demartini, Gianluca and Viller, Stephen and Wallis, Guy and Stuerzlinger, Wolfgang and Cordeil, Maxime},
journal = {Transactions on Visualization and Computer Graphics},
publisher = {IEEE},
series = {TVCG},
year = {2026},
month = {Sep},
commented-volume = {32},
commented-number = {0},
numpages = {13},
commented-doi = {https://doi.org/10.1109/ISMAR0000.2026.00000},
commented-pdf = {papers/selectrunning.pdf},
commented-video = {videos/selectrunning.mp4},
commented-teaser = {teasers/selectrunning.png},
abstract = {We explore how running speed affects target selection in immersive environments. Through a Fitts' tapping task, we investigate direct touch selections while participants are standing or running (at speeds up to 9 km/h). We conduct a multifaceted controlled study (n=22) to understand the effect of speed, pointing phase, and foot-strike on selection performance. We find that speed dramatically increases movement time, error rate, perceived exertion, and task load. The increased movement time is driven by the correction phase, which doubles in duration at 9 km/h, while the ballistic phase remains stable. Our exploratory analysis further reveals that a higher cadence reduces the error rate at lower speeds (4.5 km/h), while this effect disappears at higher speeds (9 km/h), as participants' motor control in target selection is significantly disrupted by the movement oscillations. As the selection error rate quickly exceeds 30% when speed increases, even with accurate, fast external tracking, we argue that direct touch interaction is likely inappropriate for running. Further efforts are needed to facilitate selection interaction at higher running speeds.},
keywords = {3D pointing, running, jogging},
note = {To appear},
}
@article{rasoulifar2026dynamicvac,
title = {Dynamic Vergence–Accommodation Conflict: Effects on 3D Selection Performance When Target Depth Changes},
author = {Rasoulifar+, Zahra and Turkmen*, Rumeysa and Barrera Machuca, Mayra D. and Stuerzlinger, Wolfgang and Batmaz, Anil Ufuk},
journal = {Transactions on Visualization and Computer Graphics},
publisher = {IEEE},
series = {TVCG},
year = {2026},
month = {Oct},
commented-volume = {32},
commented-number = {11},
numpages = {11},
commented-doi = {https://doi.org/10.1109/ISMAR0000.2026.00000},
commented-pdf = {papers/dynamicvac.pdf},
commented-video = {videos/dynamicvac.mp4},
commented-teaser = {teasers/dynamicvac.png},
abstract = {The effect of the Vergence--Accommodation Conflict (VAC) in state-of-the-art head-mounted displays on 3D interaction performance is well-studied in scenarios where targets remain stationary at a fixed depth. Yet, many VR applications include targets moving continuously toward or away from the user, causing vergence demand to change over time while accommodation remains fixed at the display focal plane. We study this scenario using an ISO 9241-411 multidirectional target selection task with: \emph{No VAC} (targets at the display focal plane), \emph{Constant VAC} (targets further from the focal plane), \emph{Varying VAC} (targets appear at both No VAC and Constant VAC depths across selections), and \emph{Dynamic VAC} (target depth changes continuously during acquisition) conditions. In a within-subjects study with 24 participants, Dynamic VAC produced slower selections, higher error rates, lower accuracy, and reduced throughput compared with the No VAC condition. To account for target movements in depth, we propose an extension of Fitts’ law that models the additional performance costs introduced by continuously changing vergence demand. Our results provide guidance for modeling and designing interaction techniques in depth-varying 3D environments.},
keywords = {3D pointing},
note = {ISMAR '26, conditionally accepted, to appear},
}
@article{jeong2026throwmodel,
title = {Modeling Throwing Selection in Virtual Reality},
author = {Jeong*, Jae-Yeop and Stuerzlinger, Wolfgang and Jeong, Jin-Woo},
journal = {Transactions on Visualization and Computer Graphics},
publisher = {IEEE},
series = {TVCG},
year = {2026},
month = {Oct},
commented-volume = {32},
commented-number = {11},
numpages = {11},
commented-doi = {https://doi.org/10.1109/ISMAR0000.2026.00000},
commented-pdf = {papers/throwmodel.pdf},
commented-video = {videos/throwmodel.mp4},
commented-teaser = {teasers/throwmodel.png},
abstract = {Throwing is a natural and embodied interaction for selecting distant targets in virtual reality (VR). Unlike conventional pointing, throwing is ballistic: once released, the trajectory can no longer be corrected. Despite its practical importance, throwing-based target selection has received relatively little attention in human behavior and performance modeling, making systematic design and evaluation still difficult. In this paper, we investigate throwing-based target selection in VR and propose predictive models for its behavior and performance. Through a controlled user study manipulating target width ($W$) and movement amplitude ($A$), we measured planning time ($PT$) and endpoint distribution. Our results showed that $PT$ increased systematically with task difficulty, following a pattern similar to movement time in Fitts' law. Throwing endpoints were also generally well approximated by a bivariate Gaussian distribution, and target parameters significantly affected both endpoint bias and variability. Based on these findings, we derived a probabilistic accuracy model that predicts target acquisition performance. The proposed models showed high goodness-of-fit, and the accuracy model was robust under leave-one-condition-out cross-validation. Our findings provide a quantitative understanding of throwing-based target selection and support the design of throwing interactions in immersive environments.},
keywords = {selection, throwing},
note = {ISMAR '26, conditionally accepted, to appear},
}
@article{bashar2026vacgazeconflict,
title = {Evaluating the Vergence–Accommodation Conflict in Gaze-Based 3D Target Selection},
author = {Bashar*, Mohammad Raihanul and Amini*, Mohammadreza and Mutasim, Aunnoy K. and Barrera Machuca, Mayra D. and Stuerzlinger, Wolfgang and Batmaz, Anil Ufuk},
journal = {Transactions on Visualization and Computer Graphics},
publisher = {IEEE},
series = {TVCG},
year = {2026},
month = {Oct},
commented-volume = {32},
commented-number = {11},
numpages = {11},
commented-doi = {https://doi.org/10.1109/ISMAR0000.2026.00000},
commented-pdf = {papers/vacgazeconflict.pdf},
commented-video = {videos/vacganzeconflict.mp4},
commented-teaser = {teasers/vacgazeconflict.png},
abstract = {State-of-the-art head-mounted displays (HMDs) enable gaze-based selection in virtual environments. Yet, these HMDs suffer from the vergence–accommodation conflict (VAC), which is known to affect interaction performance. The VAC might influence gaze-based selection performance because it directly affects eye-movement behavior. Thus, in this paper, we investigate how the VAC influences \gaze-based 3D target selection across varying depth conditions. Our results show that as the (visual) depth increases, user performance significantly decreases with gaze-based selection. Moreover, a previously suggested ``\textit{Variation in Diopter}'' Fitts’ law model captured this performance change better relative to a linear model. These findings provide evidence that gaze-based pointing is negatively affected by the VAC and highlight the importance of accounting for depth-dependent factors when designing gaze-based interaction in 3D environments.},
keywords = {3D pointing, eye gaze},
note = {ISMAR '26, conditionally accepted, to appear},
}
@article{hu2025trackingaccuracysteering,
title = {Exploring and Modeling the Effects of Eye-Tracking Accuracy and Precision on Gaze-Based Steering in Virtual Environments},
author = {Hu*, Xuning and Zhang*, Yichuan and Wei*, Yushi and Zhang*, Liangyuting and Li, Yue and Stuerzlinger, Wolfgang and Liang, Hai-Ning},
journal = {Transactions on Visualization and Computer Graphics},
publisher = {IEEE},
series = {TVCG},
year = {2025},
month = {Oct},
volume = {31},
number = {11},
pages = {9559-9569},
doi = {https://doi.org/10.1109/TVCG.2025.3616824},
pdf = {papers/trackingaccuracysteering.pdf},
teaser = {teasers/trackingaccuracysteering.png},
abstract = {Recent advances in eye-tracking technology have positioned gaze as an efficient and intuitive input method for Virtual Reality (VR), offering a natural and immersive user experience. As a result, gaze input is now leveraged for fundamental interaction tasks such as selection, manipulation, crossing, and steering. Although several studies have modeled user steering performance across various path characteristics and input methods, our understanding of gaze-based steering in VR remains limited. This gap persists because the unique qualities of eye movements—involving rapid, continuous motions—and the variability in eye-tracking make findings from other input modalities nontransferable to a gaze-based context, underscoring the need for a dedicated investigation into gaze-based steering behaviors and performance. To bridge this gap, we present two user studies to explore and model gaze-based steering. In the first one, user behavior data are collected across various path characteristics and eye-tracking conditions. Based on this data, we propose four refined models that extend the classic Steering Law to predict users’ movement time in gaze-based steering tasks, explicitly incorporating the impact of tracking quality. The best-performing model achieves an adjusted R^2 of 0.956, corresponding to a 16% improvement in movement time prediction. This model also yields a substantial reduction in AIC (from 1550 to 1132) and BIC (from 1555 to 1142), highlighting improved model quality and better balance between goodness of fit and model complexity. Finally, data from a second study with varied settings, such as a different eye-tracking sampling rate, illustrate the strong robustness and predictability of our models. Finally, we present scenarios and applications that demonstrate how our models can be used to design enhanced gaze-based interactions in VR systems.},
keywords = {eye tracking, gaze steering},
award = {This work received an Honorable Mention Award},
note = {ISMAR '25},
}
@article{mostajeran2025biophilicsteering,
title = {The Effects of Biophilic Design on Steering Performance in Virtual Reality},
author = {Mostajeran, Fariba and Friedrich*, Moritz and Steinicke, Frank and Kühn, Simone and Stuerzlinger, Wolfgang},
journal = {Scientific Reports},
publisher = {Nature Portfolio},
series = {SciRep},
year = {2025},
month = {Sep},
volume = {15},
commented-number = {1},
articleno = {32485},
numpages = {12},
doi = {https://doi.org/10.1038/s41598-025-19113-4},
pdf = {papers/biophilicsteering.pdf},
teaser = {teasers/biophilicsteering.png},
abstract = {Biophilic design aims to connect people to nature by incorporating natural elements such as plants in built environments. In immersive virtual reality (VR) environments, experiments have shown that, for instance, the presence of virtual plants in VR leads to higher cognitive performance and psychological well-being. However, it has not been investigated so far whether such effects extend to the performance of spatial interaction tasks such as path steering. In this paper, we explore the effects of the presence of virtual plants in an immersive virtual office environment on path steering performance in VR. For this purpose, we combined and replicated two previous studies in this field. The results of our study did not find an effect of the presence of virtual plants on steering time, as our participants performed all steering tasks in a similar amount of time in both biophilic and non-biophilic environments. We could, however, replicate one of the original studies on path steering in VR by Liu et al. and show that the steering time in our study also follows the extension of the steering law proposed in their work. Accordingly, we found not only a significant effect of the length (p < .001, effect size: partial eta squared=.93) and width (p < .001, effect size=.96) of the steering path, but also a significant effect of the path curvature (p=.003, effect size=.64) on the time needed for steering through the path. We also found significant effects of path latitude (p < .001, effect size=.57) and longitude (p=.01, effect size=.18) on steering time. Our findings challenge the previous research, which demonstrated the positive effects of biophilic design in VR on cognitive processes, and therefore, pave the path for future work to better understand the effects of biophilic design on users’ performance in VR.},
keywords = {biophilic design, cognition, well-being},
}
@article{bashar2025depthvac,
title = {The Effect of Visual Depth on the Vergence-Accommodation Conflict on 3D Selection Performance within Virtual Reality Headsets},
author = {Bashar*, Mohammad Raihanul and Barrera Machuca, Mayra Donaji and Stuerzlinger, Wolfgang and Batmaz, Anil Ufuk},
journal = {Visual Computer},
publisher = {Springer},
commented-series = {VisComp},
year = {2025},
month = {May},
volume = {41},
commented-number = {},
pages = {9645-9661},
doi = {https://doi.org/10.1007/s00371-025-03990-x},
pdf = {papers/depthvac.pdf},
teaser = {teasers/depthvac.png},
abstract = {Prior studies have shown that the vergence-accommodation conflict (VAC) negatively affects the interaction performance in Virtual Reality (VR) and Augmented Reality (AR) systems, particularly as object depth increases. This paper examines user selection performance across six different visual depths. Through a study closely resembling prior research, eighteen participants participated in an ISO 9241:411 task with six different depth distances. We observed that with higher depth values, selection times increased while the throughput performance of the participants decreased. Based on this finding, we propose a Fitts' law model based on the focal distances, which models pointing times in VR and AR systems with substantially higher accuracy. We hope that our findings aid developers in creating 3D user interfaces for VR and AR that offer better performance and an improved user experience.},
keywords = {3D pointing, vergence-accomodation conflict},
}
@article{menin2025thematicmobility,
title = {What about thematic information? An analysis of the multidimensional visualization of individual mobility},
author = {Menin*, Aline and Quere*, Clément and Wagner*, Jorge and Chardonnel, Sonia and Davoine, Paule-Annick and Stuerzlinger, Wolfgang and Freitas, Carla Maria Dal Sasso and Nedel, Luciana and Winckler, Marco},
journal = {Visual Informatics},
publisher = {Elsevier},
commented-series = {VisInf},
year = {2025},
month = {Mar},
volume = {9},
number = {1},
pages = {99-115},
doi = {https://doi.org/10.1016/j.visinf.2025.02.002},
pdf = {papers/thematicmobility.pdf},
teaser = {teasers/thematicmobility.png},
abstract = {This paper reviews the literature on the visualization of individual mobility data, with a focus on thematic integration. It emphasizes the importance of visualization in understanding mobility patterns within a population and how it helps mobility experts to address domain-specific questions. We analyze 38 papers published between 2010 and 2024 in GIS and VIS venues that describe visualizations of multidimensional data related to individual movements in urban environments, concentrating on individual mobility rather than traffic data. Our primary aim is to report advances in interactive visualization for individual mobility analysis, particularly regarding the representation of thematic information about people’s motivations for mobility. Our findings indicate that the thematic dimension is only partially represented in the literature, despite its critical significance in transportation. This gap often stems from the challenge of identifying data sources that inherently provide this information, necessitating visualization designers and developers to navigate multiple, heterogeneous data sources. We identify the strengths and limitations of existing visualizations and suggest potential research directions for the field.},
keywords = {visual analytics, visualization, thematic information, individual mobility},
}
@article{mutasim2025gazegem,
title = {The Influence of Eye Gaze Interaction Technique Expertise and the Guided Evaluation Method on Text Entry Performance Evaluations},
author = {Mutasim*, Aunnoy K and Batmaz, Anil Ufuk and Hudhud Mughrabi*, Moaaz and Stuerzlinger, Wolfgang},
journal = {Proceedings of the ACM Human-Computer Interaction},
publisher = {ACM},
series = {PACM-HCI},
year = {2025},
month = {May},
volume = {9},
number = {3},
articleno = {ETRA17},
numpages = {19},
doi = {https://doi.org/10.1145/3725842},
pdf = {papers/gazegem.pdf},
teaser = {teasers/gazegem.png},
video = {videos/gazegem.mp4},
abstract = {Any investigation of learning unfamiliar text entry systems is affected by the need to train participants on multiple new components simultaneously, such as novel interaction techniques and layouts. The Guided Evaluation Method (GEM) addresses this challenge by bypassing the need to learn layout-specific skills for text entry. However, a gap remains as the GEM’s performance has not been assessed in situations where users are unfamiliar with the interaction technique involved, here eye-gaze-based dwell. To address this, we trained participants on only the eye-gaze-based interaction technique over eight days with QWERTY and then evaluated their performance on the OPTI layout with the GEM. Results showed that the unfamiliar OPTI layout outperformed QWERTY, with QWERTY's speed aligning with previous findings, suggesting that interaction technique expertise significantly impacts performance outcomes. Importantly, we also identified that for scenarios where the familiarity with the involved interaction technique(s) is the same, the GEM analyzes the performance of keyboard layouts effectively and quickly identifies the best option.},
keywords = {text entry, layout learning, eye tracking, gaze},
note = {ETRA '25},
}
@article{lee2025scalingtechniques,
title = {Scaling Techniques for Exocentric Navigation Interfaces in Multiscale Virtual Environments},
author = {Lee, Jong-In and Stuerzlinger, Wolfgang},
journal = {Transactions on Visualization and Computer Graphics},
publisher = {IEEE},
series = {TVCG},
year = {2025},
month = {Mar},
volume = {31},
number = {5},
pages = {2704-2714},
doi = {https://doi.org/10.1109/TVCG.2025.3549535},
pdf = {papers/scalingtechniques.pdf},
teaser = {teasers/scalingtechniques.png},
video = {videos/scalingtechniques.mp4},
abstract = {Navigating multiscale virtual environments necessitates an interaction method to travel across different levels of scale (LoS). Prior research has studied various techniques that enable users to seamlessly adjust their scale to navigate between different LoS based on specific user contexts. We introduce a scroll-based scale control method optimized for exocentric navigation, targeted at scenarios where speed and accuracy in continuous scaling are crucial. We pinpoint the challenges of scale control in settings with multiple LoS and evaluate how distinct designs of scaling techniques influence navigation performance and usability. Through a user study, we investigated two pivotal elements of a scaling technique: the input method and the scaling center. Our findings indicate that our scroll-based input method significantly reduces task completion time and error rate and enhances efficiency compared to the most frequently used bi-manual method. Moreover, we found that the choice of scaling center affects the ease of use of the scaling method, especially when paired with specific input methods.},
keywords = {3D navigation, multiscale virtual environment, 3D locomotion},
note = {VR '25},
}
@article{mutasim2024gem,
title = {The Guided Evaluation Method: An Easier Way to Empirically Estimate Trained User Performance for Unfamiliar Keyboard Layouts},
author = {Mutasim*, Aunnoy K and Batmaz, Anil Ufuk and Hudhud Mughrabi+, Moaaz and Stuerzlinger, Wolfgang},
journal = {International Journal of Human-Computer Studies},
publisher = {Elsevier},
series = {IJHCS},
year = {2024},
month = {Oct},
volume = {190},
articleno = {103317},
numpages = {19},
doi = {https://doi.org/10.1016/j.ijhcs.2024.103317},
pdf = {papers/gem.pdf},
teaser = {teasers/gem.png},
abstract = {To determine in a user study whether proposed keyboard layouts, such as OPTI, can surpass QWERTY in performance, extended training through longitudinal studies is crucial. However, addressing the challenge of creating trained users presents a logistical bottleneck. A common alternative involves having participants type the same word or phrase repeatedly. We conducted two separate studies to investigate this alternative. The findings reveal that both approaches, repeatedly typing words or phrases, have limitations in accurately estimating trained user performance. Thus, we propose the Guided Evaluation Method (GEM), a novel approach to quickly estimate trained user performance with novices. Our results reveal that in a matter of minutes, participants exhibited performance similar to an existing longitudinal study — OPTI outperforms QWERTY. As it eliminates the need for resource-intensive longitudinal studies, our new GEM thus enables much faster estimation of trained user performance. This outcome will potentially reignite research on better text entry methods.},
keywords = {text entry, touch typing, soft keyboards, layout learning},
}
@article{hoerantner2024vismet,
title = {Visual training in dry age-related macular degeneration},
author = {Hörantner, Robert and Wolfsgruber, Jürgen and Stürzlinger, Gerald and Stürzlinger, Wolfgang and Hörantner, Paul},
journal = {Spektrum der Augenheilkunde},
publisher = {Springer},
year = {2024},
month = {Aug},
volume = {39},
number = {1},
pages = {4-8},
doi = {https://doi.org/10.1007/s00717-024-00578-z},
pdf = {papers/vismet.pdf},
teaser = {teasers/vismet.png},
abstract = {Purpose: To investigate the efficacy of visual training with stimulation in patients with dry age-related macular degeneration (AMD).
Method: The Medical Eye Trainer (M.E.T.) was tested in 67 patients with dry AMD. By using the training system, the entire visual system is treated. A moving grid is displayed on a standard smartphone or tablet. The training was carried out once a day for 90 seconds over a total period of two months.
Results: The Medical Eye Trainer (M.E.T.) significantly improved visual function after two months. The results of a questionnaire, which was used after the therapy, also showed a satisfactory stabilization or improvement of the findings.
Conclusions: The M.E.T. represents an effective additional treatment option for patients with dry AMD without interfering with established treatment methods.},
keywords = {macular degeneration, dry AMD, visual training, visual perception},
note = {In German},
}
@article{rajabiseraji2024hybridaxes,
title = {Analyzing User Behaviour Patterns in a Cross-virtuality Immersive Analytics System},
author = {Rajabi Seraji*, Mohammad and Piray*, Parastoo and Zahednejad*, Vahid and Stuerzlinger, Wolfgang},
journal = {Transactions on Visualization and Computer Graphics},
publisher = {IEEE},
series = {TVCG},
year = {2024},
month = {Mar},
volume = {30},
number = {5},
pages = {2613-2623},
doi = {https://doi.org/10.1109/TVCG.2024.3372129},
pdf = {papers/hybridaxes2.pdf},
teaser = {teasers/hybridaxes2.png},
video = {videos/hybridaxes2.mp4},
abstract = {Recent work in immersive analytics suggests benefits for systems that support work across both 2D and 3D data visualizations, i.e., cross-virtuality analytics systems. Here, I introduce HybridAxes, an immersive visual analytics system that enables users to conduct their analysis either in 2D on desktop monitors or in 3D within an immersive AR environment - while enabling them to seamlessly switch and transfer their visualizations between the two modes. The results of my user study show that the cross-virtuality sub-systems in HybridAxes complement each other well in helping the users in their data-understanding journey. I show that users preferred using the AR component for exploring the data, while they used the desktop component to work on more detail-intensive tasks. Despite encountering some minor challenges in switching between the two virtuality modes, users consistently rated the whole system as highly engaging, user-friendly, and helpful in streamlining their analytics processes. Finally, I present suggestions for designers of cross-virtuality visual analytics systems and identify avenues for future work.},
keywords = {immersive analytics, cross-reality, augmented reality},
award = {This work received an Honorable Mention Award},
note = {VR '24}
}
@article{barrera2023immersivesketchingframework,
title = {Toward More Comprehensive Evaluations of 3D Immersive Sketching, Drawing, and Painting},
author = {Barrera Machuca, Mayra Donaji and Israel, Johann Habakuk and Keefe, Daniel F. and Stuerzlinger, Wolfgang},
journal = {Transactions on Visualization and Computer Graphics},
publisher = {IEEE},
series = {TVCG},
year = {2024},
month = {Aug},
volume = {30},
number = {8},
pages = {4648-4664},
doi = {https://doi.org/10.1109/TVCG.2023.3276291},
pdf = {papers/immersivesketchingframework.pdf},
teaser = {teasers/immersivesketchingframework.png},
abstract = {To understand current practice and explore the potential for more comprehensive evaluations of 3D immersive sketching, drawing, and painting, we present a survey of evaluation methodologies used in existing 3D sketching research, a breakdown and discussion of important phases (sub-tasks) in the 3D sketching process, and a framework that suggests how these factors can inform evaluation strategies in future 3D sketching research. Existing evaluations identified in the survey are organized and discussed within three high-level categories: 1) evaluating the 3D sketching activity, 2) evaluating 3D sketching tools, and 3) evaluating 3D sketching artifacts. The new framework suggests targeting evaluations to one or more of these categories and identifying relevant user populations. In addition, building upon the discussion of the different phases of the 3D sketching process, the framework suggests to evaluate relevant sketching tasks, which may range from low-level perception and hand movements to high-level conceptual design. Finally, we discuss limitations and challenges that arise when evaluating 3D sketching, including a lack of standardization of evaluation methods and multiple, potentially conflicting, ways to evaluate the same task and user interface usability; we also identify opportunities for more holistic evaluations. We hope the results can contribute to accelerating research in this domain and, ultimately, broad adoption of immersive sketching systems.},
keywords = {3D sketching, 3D drawing, 3D painting},
}
@article{mostajeran2023biophilic,
title = {Adding Virtual Plants Leads to Higher Cognitive Performance and Psychological Well-being in Virtual Reality},
author = {Mostajeran, Fariba and Steinicke, Frank and Reinhart*, Sarah and Stuerzlinger, Wolfgang and Riecke, Bernhard E. and Kühn, Simone},
journal = {Scientific Reports},
publisher = {Nature Portfolio},
series = {SciRep},
year = {2023},
month = {May},
volume = {13},
number = {1},
numpages = {12},
doi = {https://doi.org/10.1038/s41598-023-34718-3},
pdf = {papers/biophilic.pdf},
teaser = {teasers/biophilic.png},
abstract = {Previous research has shown the positive effects of exposure to real and virtual nature. To investigate how such benefits might generalize to ever-more-prevalent virtual workplaces, we examined the effects of the absence or presence of virtual plants in an office environment in Virtual Reality (VR) on users’ cognitive performance and psychological well-being. The results of our user study with 39 participants show that in the presence of virtual plants, participants performed significantly better in both short-term memory and creativity tasks. Furthermore, they reported higher psychological well-being scores, including positive affect and attentive coping, whilst reporting lower feelings of anger and aggression after exposure to virtual plants in VR. The virtual office with plants was also perceived as more restorative and induced a higher sense of presence. Overall, these results highlight how the presence of virtual plants in VR can have positive influences on users, and therefore, constitute important design considerations when developing future working and learning spaces.},
keywords = {biophilic design, cognition, well-being},
}
@article{kaya2023covidvis,
title = {Evaluation of an Immersive COVID-19 Data Visualization},
author = {Kaya+, Furkan and Celik+, Elif and Batmaz, Anil Ufuk and Mutasim*, Aunnoy K and Stuerzlinger, Wolfgang},
journal = {Computer Graphics & Applications},
publisher = {IEEE},
series = {CG&A},
year = {2023},
month = {Jan},
volume = {43},
number = {1},
pages = {76-83},
doi = {https://doi.org/10.1109/MCG.2022.3223535},
pdf = {papers/covidvis.pdf},
teaser = {teasers/covidvis.png},
abstract = {COVID-19 restrictions have detrimental effects on the population, both socially and economically. However, these restrictions are necessary as they help reduce the spread of the virus. For the public to comply, easily comprehensible communication between decision-makers and the public is thus crucial. To address this, we propose a novel 3D visualization of COVID-19 data which could increase the awareness of COVID-19 trends in the general population. We conducted a user study and compared a conventional 2D visualization with the proposed method in an immersive environment. Results showed that the our 3D visualization approach facilitated understanding of the complexity of COVID-19. A majority of participants preferred to see the COVID-19 data with the 3D method. Moreover, individual results revealed that our method increases the engagement of users with the data. We hope that our method will help governments to improve their communication with the public in the future.},
keywords = {visualization, 3D visualization, immersive analytics},
}
@article{villanueva2022advancedfatigue,
title = {Advanced Modeling Method for Quantifying Cumulative Subjective Fatigue in Mid-Air Interaction},
author = {Villanueva*, Ana Maria and Jang*, Sujin and Stuerzlinger, Wolfgang and Ambike, Satyajit and Ramani, Karthik},
journal = {International Journal of Human-Computer Studies},
publisher = {Elsevier},
series = {IJHCS},
year = {2023},
month = {Jan},
volume = {169},
commented-number = {0},
articleno = {102931},
numpages = {15},
doi = {https://doi.org/10.1016/j.ijhcs.2022.102931},
pdf = {papers/advancedfatigue.pdf},
teaser = {teasers/advancedfatigue.png},
abstract = {Interaction in mid-air can be fatiguing. A model-based method to quantify cumulative subjective fatigue for such interaction was recently introduced in HCI research. This model separates muscle units into three states: active (MA) fatigued (MF) or rested (MR) and defines transition rules between states. This method demonstrated promising accuracy in predicting subjective fatigue accumulated in mid-air pointing tasks. In this paper, we introduce an improved model that additionally captures the variations of the maximum arm strength based on arm postures and adds linearly-varying model parameters based on current muscle strength. To validate the applicability and capabilities of the new model, we tested its performance in various mid-air interaction conditions, including mid-air pointing/docking tasks, with shorter and longer rest and task periods, and a long-term evaluation with individual participants. We present results from multiple cross-validations and comparisons against the previous model and identify that our new model predicts fatigue more accurately. Our modeling approach showed a 42.5% reduction in fatigue estimation error when the longitudinal experiment data is used for an individual participant’s fatigue. Finally, we discuss the applicability and capabilities of our new approach.},
keywords = {fatigue, mid-air, model, docking, 3D manipulation},
}
@article{yamanaka2022pathsegmentation,
title = {The Effectiveness of Path-segmentation for Modeling Lasso Times in Width-varying Paths},
author = {Yamanaka, Shota and Usuba*, Hiroki and Stuerzlinger, Wolfgang and Miyashita, Homei},
journal = {Proceedings of the ACM Human-Computer Interaction},
publisher = {ACM},
series = {PACM-HCI},
year = {2022},
month = {Dec},
volume = {6},
number = {ISS},
articleno = {584},
pages = {640-659},
doi = {https://doi.org/10.1145/3567737},
pdf = {papers/pathsegmentation.pdf},
video = {videos/pathsegmentation.mp4},
teaser = {teasers/pathsegmentation.png},
abstract = {Models of lassoing time to select multiple square icons exist, but realistic lasso tasks also typically involve encircling non-rectangular objects. Thus, it is unclear if we can apply existing models to such conditions where, e.g., the width of the path that users want to steer through changes dynamically or step-wise. In this work, we conducted two experiments where the objects were non-rectangular with path widths that narrowed or widened, smoothly or step-wise. The results showed that the baseline models for pen-steering movements (the steering and crossing law models) fitted the timing data well, but also that segmenting width-changing areas led to significant improvements. Our work enables the modeling of novel UIs requiring continuous strokes, e.g., for grouping icons.},
keywords = {steering, crossing, lasso, group selection},
note = {ISS '22},
}
@article{batmaz2022throughput,
title = {Effective Throughput Analysis of Different Task Execution Strategies for Mid-Air Fitts' Tasks in Virtual Reality},
author = {Batmaz, Anil Ufuk and Stuerzlinger, Wolfgang},
journal = {Transactions on Visualization and Computer Graphics},
publisher = {IEEE},
series = {TVCG},
year = {2022},
month = {Oct},
volume = {28},
number = {11},
pages = {3939-3947},
doi = {https://doi.org/10.1109/TVCG.2022.3203105},
commented-url = {https://youtu.be/lMUSoiAdwWA},
pdf = {papers/throughputstrategies.pdf},
teaser = {teasers/throughputstrategies.png},
abstract = {Fitts’ law and throughput based on effective measures are two mathematical models frequently used to analyze human motor performance together with a standardized task, e.g., to compare the performance of input and output devices. Even though pointing has been deeply studied in 2D, it is not well understood how different task execution strategies affect throughput in 3D virtual environments. In this work, we examine MacKenzie’s effective throughput measure, claimed to be invariant to task execution strategies, in Virtual Reality (VR) systems with three such strategies, “as fast, as precise, and as fast and as precise as possible” for ray casting and virtual hand interaction, by re-analyzing data from a 3D pointing ISO 9241-411 study. Results show that effective throughput is not invariant for different task execution strategies in VR, which also matches a more recent 2D result. Normalized speed vs accuracy curves also did not fit the data. We suggest that practitioners, developers, and researchers who use MacKenzie’s effective throughput formulation should consider our findings when analyzing 3D user pointing performance in VR systems.},
keywords = {3D pointing, speed-accuracy tradeoff},
note = {ISMAR '22},
}
@article{nowak2021visualanalytics,
title = {Visual Analytics: A Method to Explore Natural Histories of Oral Epithelial Dysplasia},
author = {Nowak*, Stan and Rosin, Miriam and Stuerzlinger, Wolfgang and Bartram, Lyn},
journal = {Frontiers in Oral Health},
publisher = {Frontiers},
year = {2021},
month = {Aug},
volume = {2},
articleno = {703874},
numpages = {10},
doi = {https://doi.org/10.3389/froh.2021.703874},
pdf = {papers/va4oralcancerDRAFT.pdf},
teaser = {teasers/va4oralcancer.png},
abstract = {Risk assessment and follow-up of oral potentially malignant lesions in patients with mild or moderate oral epithelial dysplasia is an ongoing challenge for improved oral cancer prevention. Part of the challenge is a lack of understanding of how observable features of such dysplasia, gathered as data by clinicians during follow-up, relate to underlying biological processes driving progression. Current research is at an exploratory phase where the precise questions to ask are not known. While traditional statistical and the newer machine learning and artificial intelligence methods are effective in well-defined problem spaces with large datasets, these are not the circumstances we face currently. We argue that the field is in need of exploratory methods that can better integrate clinical and scientific knowledge into analysis to iteratively generate viable hypotheses. In this perspective, we propose that visual analytics presents a set of methods well-suited to these needs. We illustrate how visual analytics excels at generating viable research hypotheses by describing our experiences using visual analytics to explore temporal shifts in the clinical presentation of epithelial dysplasia. Visual analytics complements existing methods and fulfills a critical and at-present neglected need in the formative stages of inquiry we are facing.},
keywords = {visual analytics, oral health, visualization, oral cancer},
commented-note = {draft version},
}
@article{wagner2021interaction,
title = {Comparing and Combining Virtual Hand and Virtual Ray Pointer Interactions for Data Manipulation in Immersive Analytics},
author = {Wagner Filho*, Jorge and Stuerzlinger, Wolfgang and Nedel, Luciana},
journal = {Transactions on Visualization and Computer Graphics},
publisher = {IEEE},
series = {TVCG},
year = {2021},
month = {Mar},
volume = {27},
number = {5},
pages = {2513-2523},
doi = {https://doi.org/10.1109/TVCG.2021.3067759},
pdf = {papers/stcinteraction.pdf},
video = {videos/stcinteraction.mp4},
teaser = {teasers/stcinteraction.png},
abstract = {Displaying data visualizations in Virtual Reality environments enables analysts to explore large amounts of information more easily, supported by different perspectives and stereoscopic 3D display. Easy-to-use interaction affords additional benefits, such as more intuitively querying or filtering the data. Many Immersive Analytics systems employ either a virtual hands metaphor, with actions such as grabbing and stretching, or virtual ray pointers, with actions assigned to controller buttons. However, the effect of this choice in immersive visualization systems is unknown. Considering that each approach has different advantages, we implemented and evaluated both as well as a third option: seamlessly integrating both modes and allowing the user to alternate between them without explicit mode switches. We compared these three conditions through a controlled user study in the spatio-temporal data domain. We did not find significant differences between hands and ray-casting in task performance, workload, or interactivity patterns. Yet, 60% of the participants preferred the mixed mode and benefited from it by choosing the best alternative for each low-level task. This mode significantly reduced completion times by 23% for the most demanding task, at the cost of a 5% decrease in overall success rates.},
keywords = {visual analytics, immersive analytics, space-time cube, 3D visualization, 3D interaction},
note = {VR '21},
}
@article{wagner2021navigation,
title = {The Effect of Exploration Mode and Frame of Reference in Immersive Analytics},
author = {Wagner Filho*, Jorge and Stuerzlinger, Wolfgang and Nedel, Luciana},
journal = {Transactions on Visualization and Computer Graphics},
publisher = {IEEE},
series = {TVCG},
year = {2021},
month = {Feb},
volume = {28},
number = {9},
numpages = {3252-3264},
doi = {https://doi.org/10.1109/TVCG.2021.3060666},
pdf = {papers/stcnavigation.pdf},
video = {videos/stcnavigation.mp4},
teaser = {teasers/stcnavigation.png},
abstract = {The design space for user interfaces for Immersive Analytics applications is vast. Designers can combine navigation and manipulation to enable data exploration with ego- or exocentric views, have the user operate at different scales, or use different forms of navigation with varying levels of physical movement. This freedom results in a multitude of different viable approaches. Yet, there is no clear understanding of the advantages and disadvantages of each choice. Our goal is to investigate the affordances of several major design choices, to enable both application designers and users to make better decisions. In this work, we assess two main factors, exploration mode and frame of reference, consequently also varying visualization scale and physical movement demand. To isolate each factor, we implemented nine different conditions in a Space-Time Cube visualization use case and asked 36 participants to perform multiple tasks. We analyzed the results in terms of performance and qualitative measures and correlated them with participants' spatial abilities. While egocentric room-scale exploration significantly reduced mental workload, exocentric exploration improved performance in some tasks. Combining navigation and manipulation made tasks easier by reducing workload, temporal demand, and physical effort.},
keywords = {visual analytics, immersive analytics, space-time cube, 3D visualization, 3D navigation},
}
@comment{c, c={issue appeared in 2021}}
@article{gloumeau2020pinnpivot,
title = {{PinNPivot}: Object Manipulation Using Pins in Immersive Virtual Environments},
author = {Gloumeau*, Paul Christopher and Stuerzlinger, Wolfgang and Han, JungHyun},
journal = {Transactions on Visualization and Computer Graphics},
publisher = {IEEE},
series = {TVCG},
year = {2020},
month = {Apr},
volume = {27},
number = {4},
pages = {2488-2494},
doi = {https://doi.org/10.1109/TVCG.2020.2987834},
pdf = {papers/pinnpivot.pdf},
video = {videos/pinnpivot.mp4},
teaser = {teasers/pinnpivot.png},
abstract = {Object manipulation techniques in immersive virtual environments are either inaccurate or slow. We present a novel technique, PinNPivot, where pins are used to constrain 1DOF/2DOF/3DOF rotations. It also supports 6DOF manipulation and 3DOF translation. A comparison with three existing techniques shows that PinNPivot is significantly more accurate and faster.},
keywords = {3D manipulation, docking},
}
@article{batmaz2020beam,
title = {How Automatic Speed Control Based on Distance Affects User Behaviours in Telepresence Robot Navigation within Dense Conference-like Environments},
author = {Batmaz, Anil Ufuk and Maiero*, Jens and Kruijff, Ernst and Riecke, Bernhard E. and Neustaedter, Carman and Stuerzlinger, Wolfgang},
journal = {PLoS ONE},
publisher = {Public Library of Science},
year = {2020},
month = {Nov},
volume = {15},
number = {11},
articleno = {e0242078},
numpages = {47},
doi = {https://doi.org/10.1371/journal.pone.0242078},
pdf = {papers/beamspeed.pdf},
teaser = {teasers/beamspeed.png},
commented-series = {PLOS One},
abstract = {Telepresence robots allow users to be spatially and socially present in remote environments. Yet, it can be challenging to remotely operate telepresence robots, especially in dense environments such as academic conferences or workplaces. In this paper, we primarily focus on the effect that a speed control method, which automatically slows the telepresence robot down when getting closer to obstacles, has on user behaviors. In our first user study, participants drove the robot through a static obstacle course with narrow sections. Results indicate that the automatic speed control method significantly decreases the number of collisions. For the second study we designed a more naturalistic, conference-like experimental environment with tasks that require social interaction, and collected subjective responses from the participants when they were asked to navigate through the environment. While about half of the participants preferred automatic speed control because it allowed for smoother and safer navigation, others did not want to be influenced by an automatic mechanism. Overall, the results suggest that automatic speed control simplifies the user interface for telepresence robots in static dense environments, but should be considered as optionally available, especially in situations involving social interactions.},
keywords = {telepresence robot, automatic distance, 3D navigation, speed control},
}
@article{alharbi2020frustration,
title = {The Effects of Predictive Features of Mobile Keyboards on Text Entry Speed and Errors},
author = {Alharbi*, Ohoud and Stuerzlinger, Wolfgang and Putze, Felix},
journal = {Proceedings of the ACM Human-Computer Interaction},
publisher = {ACM},
series = {PACM-HCI},
year = {2020},
month = {Nov},
volume = {4},
number = {ISS},
articleno = {183},
numpages = {16},
doi = {https://doi.org/10.1145/3427311},
pdf = {papers/autocorrectfrustration.pdf},
teaser = {teasers/autocorrectfrustration.png},
abstract = {Mobile users rely on typing assistant mechanisms such as prediction and autocorrect. Previous studies on mobile keyboards showed decreased performance for heavy use of word prediction, which identifies a need for more research to better understand the effectiveness of predictive features for different users. Our work aims at such a better understanding of user interaction with autocorrections and the prediction panel while entering text, in particular when these approaches fail. We present a crowd-sourced mobile text entry study with 170 participants. Our mobile web application simulates autocorrection and word prediction to capture user behaviours around these features. We found that using word prediction saves an average of 3.43 characters per phrase but also adds an average of two seconds compared to actually typing the word, resulting in a negative effect on text entry speed. We also identified that the time to fix wrong autocorrections is on average 5.5 seconds but that autocorrection does not have a significant effect on typing speed.},
keywords = {text entry, autocorrect, prediction, errors},
note = {ISS '20},
}
@article{yamanaka2020obstacle,
title = {Necessary and Unnecessary Obstacle Avoidance Movements Affect User Behaviors in Crossing Operations},
author = {Yamanaka, Shota and Stuerzlinger, Wolfgang},
journal = {Transactions on Computer-Human Interaction},
publisher = {ACM},
series = {TOCHI},
year = {2020},
month = {Nov},
volume = {27},
number = {6},
articleno = {44},
numpages = {31},
doi = {https://doi.org/10.1145/3418413},
pdf = {papers/obstacleavoidance.pdf},
teaser = {teasers/obstacleavoidance.png},
abstract = {The "crossing time" to pass between objects in lassoing tasks is predicted by Fitts' law. When an unwanted object, or obstacle, intrudes into the user's path, users curve the stroke to avoid hitting that obstacle. We empirically show that, in the presence of an obstacle, modified Fitts models for pointing with obstacle avoidance can significantly improve the prediction accuracy of movement time compared with standard Fitts' law. Yet, we also found that when an object is (only) close to the crossing path, i.e., a distractor, users still curve their stroke, even though the object does not intrude. We tested the effects of distractor proximity and length. While the crossing motion is modified by a nearby distractor, our results also identify that overall its effect on crossing times was small, and thus Fitts' law can still be applied safely with distractors.},
keywords = {steering, crossing, lasso, group selection, obstacle},
}
@comment{c, c={could be re-classified as misc, see also the blog entry: steed2020covidblog}}
@article{steed2020covid,
title = {Evaluating Immersive Experiences during {COVID-19} and Beyond},
author = {Steed, Anthony and Ortega, Francisco R. and Williams, Adam S. and Kruijff, Ernst and Stuerzlinger, Wolfgang and Batmaz, Anil Ufuk and Stevenson Won, Andrea and Suma Rosenberg, Evan and Simeone, Adalberto L. and Hayes, Aleshia},
journal = {Interactions},
publisher = {ACM},
year = {2020},
month = {Jul},
volume = {27},
number = {4},
pages = {62–67},
doi = {https://doi.org/10.1145/3406098},
pdf = {papers/evaluatingimmersive.pdf},
abstract = {The COVID-19 pandemic has disrupted our daily lives. The safety and well-being of people are paramount, and there is no exception for the human-computer interaction (HCI) field. Most universities and research labs have closed non-critical research labs. With that closure and the student populations having left campus, in-person user studies have been suspended for the foreseeable future. Experiments that involve the usage of specialized technology, such as virtual and augmented reality headsets, create additional challenges. While some head-mounted displays (HMDs) have become more affordable for consumers (e.g., Oculus Quest), there are still multiple constraints for researchers, including the expense of high-end HMDs (e.g., Microsoft Hololens), high-end graphics hardware, and specialized sensors, as well as ethical concerns around reusing equipment that comes in close contact with each participant and may be difficult to sterilize. These difficulties have led the extended reality (XR) community (which includes the virtual reality (VR) and augmented reality (AR) research communities) to ask how we can continue to practically and ethically run experiments under these circumstances. Here, we summarize the status of a community discussion of short-term, medium-term, and long-term measures to deal with the current COVID-19 situation and its potential longer-term impacts. In particular, we outline steps we are taking toward community support of distributed experiments. There are a number of reasons to look at a more distributed model of participant recruitment, including the generalizability of the work and potential access to target-specific, hard-to-reach user groups. We hope that this article will inform the first steps toward addressing the practical and ethical concerns for such studies.},
keywords = {3D user interfaces, COVID-19, virtual reality, augmented reality, extended reality},
}
@article{maiero2019backofdevice,
title = {Back-of-Device Force Feedback Improves Touchscreen Interaction for Mobile Devices},
author = {Maiero*, Jens and Eibich*, David and Kruijff, Ernst and Hinkenjann, André and Stuerzlinger, Wolfgang and Benko, Hrvoje and Ghinea, George},
journal = {Transactions on Haptics},
publisher = {IEEE},
series = {TOH},
year = {2019},
month = {Oct},
volume = {12},
number = {4},
pages = {483-496},
doi = {https://doi.org/10.1109/TOH.2019.2911519},
pdf = {papers/hapticphone.pdf},
teaser = {teasers/hapticphone.png},
abstract = {Touchscreen interaction suffers from occlusion problems as fingers can cover small targets, which makes interacting with such targets challenging. To improve touchscreen interaction accuracy and consequently the selection of small or hidden objects, we introduce a back-of-device force feedback system for smartphones. We introduce a new solution that combines force feedback on the back to enhance touch input on the front screen. The interface includes three actuated pins at the back of a smartphone. All three pins are driven by microservos and can be actuated up to a frequency of 50 Hz and a maximum amplitude of 5 mm. In a first psychophysical user study, we explored the limits of the system. Thereafter, we demonstrate through a performance study that the proposed interface can enhance touchscreen interaction precision, compared to state-of-the-art methods. In particular, the selection of small targets performed remarkably well with force feedback. The study additionally shows that users subjectively felt significantly more accurate with force feedback. Based on the results, we discuss back-to-front feedback design issues and demonstrate potential applications through several prototypical concepts to illustrate where the back-of-device force feedback could be beneficial.},
keywords = {haptics, mobile device, touch},
}
@comment{c, c={issue appeared in 2021}}
@article{nguyenvo2019naviboard,
title = {{NaviBoard} and {NaviChair}: Limited Translation Combined with Full Rotation for Efficient Virtual Locomotion},
author = {Nguyen-Vo*, Thinh and Riecke, Bernhard E. and Stuerzlinger, Wolfgang and Pham*, Duc-Minh and Kruijff, Ernst},
journal = {Transactions on Visualization and Computer Graphics},
publisher = {IEEE},
series = {TVCG},
year = {2019},
month = {Aug},
volume = {27},
number = {1},
pages = {165-177},
doi = {https://doi.org/10.1109/TVCG.2019.2935730},
pdf = {papers/naviboard.pdf},
video = {https://www.youtube.com/watch?v=JCYL2qVFO6M},
teaser = {teasers/naviboard.png},
abstract = {Walking has always been considered as the gold standard for navigation in Virtual Reality research. Though full rotation is no longer a technical challenge, physical translation is still restricted through limited tracked areas. While rotational information has been shown to be important, the benefit of the translational component is still unclear with mixed results in previous work. To address this gap, we conducted a mixed-method experiment to compare four levels of translational cues and control: none (using the trackpad of the HTC Vive controller to translate), upper-body leaning (sitting on a "NaviChair", leaning the upper-body to locomote), whole-body leaning/stepping (standing on a platform called NaviBoard, leaning the whole body or stepping one foot off the center to navigate), and full translation (physically walking). Results showed that translational cues and control had significant effects on various measures including task performance, task load, and simulator sickness. While participants performed significantly worse when they used a controller with no embodied translational cues, there was no significant difference between the NaviChair, NaviBoard, and actual walking. These results suggest that translational body-based motion cues and control from a low-cost leaning/stepping interface might provide enough sensory information for supporting spatial updating, spatial awareness, and efficient locomotion in VR, although future work will need to investigate how these results might or might not generalize to other tasks and scenarios.},
keywords = {3D navigation, speed control},
}
@article{wagner2019evaluating,
title = {Evaluating an Immersive Space-Time Cube Geovisualization for Intuitive Trajectory Data Exploration},
author = {Wagner Filho*, Jorge and Stuerzlinger, Wolfgang and Nedel, Luciana},
journal = {Transactions on Visualization and Computer Graphics},
publisher = {IEEE},
series = {TVCG},
year = {2019},
month = {Oct},
volume = {26},
number = {1},
pages = {514-524},
doi = {https://doi.org/10.1109/TVCG.2019.2934415},
pdf = {papers/stcvirtualdesk.pdf},
video = {videos/stcvirtualdesk.mp4},
teaser = {teasers/stcvirtualdesk.png},
abstract = {A Space-Time Cube enables analysts to clearly observe spatio-temporal features in movement trajectory datasets in geovisualization. However, its general usability is impacted by a lack of depth cues, a reported steep learning curve, and the requirement for efficient 3D navigation. In this work, we investigate a Space-Time Cube in the Immersive Analytics domain. Based on a review of previous work and selecting an appropriate exploration metaphor, we built a prototype environment where the cube is coupled to a virtual representation of the analyst's real desk, and zooming and panning in space and time are intuitively controlled using mid-air gestures. We compared our immersive environment to a desktop-based implementation in a user study with 20 participants across 7 tasks of varying difficulty, which targeted different user interface features. To investigate how performance is affected in the presence of clutter, we explored two scenarios with different numbers of trajectories. While the quantitative performance was similar for the majority of tasks, large differences appear when we analyze the patterns of interaction and consider subjective metrics. The immersive version of the Space-Time Cube received higher usability scores, much higher user preference, and was rated to have a lower mental workload, without causing participants discomfort in 25-minute-long VR sessions.},
keywords = {visual analytics, immersive analytics, space-time cube, 3D visualization},
note = {VIS '19},
}
@article{yamanaka2018analysis,
title = {Analysis and Modeling the Steering Operations in Sequential Linear Path Segments},
author = {Yamanaka*, Shota and Stuerzlinger, Wolfgang and Miyashita, Homei},
journal = {IPSJ Journal},
publisher = {Information Processing Society of Japan},
issn = {1882-7764},
year = {2018},
month = {Feb},
volume = {59},
number = {2},
pages = {633-643},
commented-url = {http://id.nii.ac.jp/1001/00185782},
url = {https://ipsj.ixsq.nii.ac.jp/records/185870},
keywords = {steering, lasso, group selection},
note = {In Japanese},
}
@article{seim2017passivehaptic,
title = {Passive Haptic Training to Improve Speed and Performance on a Keypad},
author = {Seim*, Caitlyn and Doering+, Nick and Zhang+, Yang and Stuerzlinger, Wolfgang and Starner, Thad},
journal = {Proceedings on Interactive, Mobile, Wearable and Ubiquitous Technologies},
publisher = {ACM},
series = {IMWUT},
year = {2017},
month = {Sep},
volume = {1},
number = {3},
articleno = {100},
numpages = {13},
doi = {https://doi.org/10.1145/3132026},
pdf = {papers/passivehapticslearning.pdf},
teaser = {teasers/passivehapticslearning.png},
abstract = {Learning text entry systems is challenging, yet necessary. Many layouts and keyboards exist, but they rely on laborious learning techniques. Passive haptic learning (PHL) has already demonstrated some benefit for learning the Braille text entry system. Could this computing-enabled technique be used to improve desktop keyboard typing skills? It is unknown whether passive haptic training can improve speed on a motor task (as opposed to initial learning). We use a randomized numeric keypad to examine users' typing performance with or without passive haptic training. When users were prevented from looking at the keyboard, the PHL group demonstrated consistent accuracy (-0.011 KSPC) while those in the control group greatly increased their error (+1.26 KSPC on average). This result is consistent with the finding that PHL users looked significantly less at the keyboard. In a second, longer study, users exposed to PHL were found to significantly improve their typing speed (mean increase of 11 WPM) versus control (mean increase of 2.2 WPM).},
keywords = {haptics, learning, text entry},
note = {Ubicomp '17},
}
@article{waese2017eplant,
title = {{ePlant}: Visualizing and Exploring Multiple Levels of Data for Hypothesis Generation in Plant Biology},
author = {Waese*, Jamie and Fan+, Jim and Pasha+, Asher and Yu+, Hans and Fucile, Geoffrey and Shi+, Ian and Cumming+, Matthew and Kelley, Lawrence and Sternberg, Michael and Krishnakumar, Vivek and Ferlanti, Erik and Miller, Jason and Town, Chris and Stuerzlinger, Wolfgang and Provart, Nicholas},
journal = {The Plant Cell},
publisher = {American Society of Plant Biologists},
year = {2017},
month = {Aug},
volume = {29},
number = {8},
pages = {1806-1821},
doi = {https://doi.org/10.1105/tpc.17.00073},
url = {http://bar.utoronto.ca/eplant},
pdf = {papers/eplant.pdf},
teaser = {teasers/eplant.png},
abstract = {A big challenge in current systems biology research arises when different types of data must be accessed from separate sources and visualized using separate tools. The high cognitive load required to navigate such a workflow is detrimental to hypothesis generation. Accordingly, there is a need for a robust research platform that incorporates all data and provides integrated search, analysis, and visualization features through a single portal. Here, we present ePlant (http://bar.utoronto.ca/eplant), a visual analytic tool for exploring multiple levels of Arabidopsis thaliana data through a zoomable user interface. ePlant connects to several publicly available web services to download genome, proteome, interactome, transcriptome, and 3D molecular structure data for one or more genes or gene products of interest. Data are displayed with a set of visualization tools that are presented using a conceptual hierarchy from big to small, and many of the tools combine information from more than one data type. We describe the development of ePlant in this article and present several examples illustrating its integrative features for hypothesis generation. We also describe the process of deploying ePlant as an "app" on Araport. Building on readily available web services, the code for ePlant is freely available for any other biological species research.},
keywords = {visualization, visual analytics},
}
@comment{c, c={not sure if this is best article or proceedings}}
@article{dwyer2016dagstuhl,
title = {Immersive Analytics (Dagstuhl Seminar 16231)},
author = {Dwyer, Tim and Henry Riche, Nathalie and Klein, Karsten and Stuerzlinger, Wolfgang and Thomas, Bruce H.},
journal = {Dagstuhl Reports},
publisher = {Schloss Dagstuhl-Leibniz-Zentrum fuer Informatik},
commented-series = {Dagstuhl Seminar 16231},
issn = {2192-5283},
year = {2016},
month = {Nov},
volume = {6},
number = {6},
pages = {1-9},
doi = {https://doi.org/10.4230/DagRep.6.6.1},
pdf = {papers/dagstuhl_IA.pdf},
teaser = {teasers/dagstuhl.png},
abstract = {This report documents the program and the outcomes of Dagstuhl Seminar 16231 "Immersive Analytics". Close to 40 researchers and practitioners participated in this seminar to discuss and define the field of Immersive Analytics, to create a community around it, and to identify its research challenges. As the participants had a diverse background in a variety of disciplines, including Human-Computer-Interaction, Augmented and Virtual Reality, Information Visualization, and Visual Analytics, the seminar featured a couple of survey talks on the first days, followed by plenary and working group discussions that were meant to shape the field of Immersive Analytics. As an outcome, a book publication is planned with book chapters provided by the participants.},
keywords = {visual analytics, visualization, immersive analytics},
}
@article{liang2013investigation,
title = {An Investigation of Suitable Interactions for {3D} Manipulation of Distant Objects Through a Mobile Device},
author = {Liang, Hai-Ning and Williams*, Cary and Semegen, Myron and Stuerzlinger, Wolfgang and Irani, Pourang},
journal = {International Journal on Innovative Computing, Information and Control},
issn = {1349-4198},
year = {2013},
month = {Dec},
volume = {9},
number = {12},
pages = {4737-4752},
url = {http://www.ijicic.org/vol-9(12).htm},
pdf = {papers/dualsurface2.pdf},
teaser = {teasers/dualsurface2.png},
abstract = {In this paper, we present our research linking two types of technologies that are gaining importance: mobile devices and large displays. Mobile devices now come integrated with a variety of sophisticated sensors, including multi-touch displays, gyroscopes and accelerometers, which allow them to capture rich varieties of gestures and make them ideal to be used as input devices to interact with an external display. In this research we explore what types of sensors are easy and intuitive to use to support people's exploration of 3D objects shown in large displays located at a distance. To conduct our research we have developed a device with two multi-touch displays, one on its front and the other in the back, and motion sensors. We then conducted an exploratory study in which we asked participants to provide interactions that they believe are easy and natural to perform operations with 3D objects. We have aggregated the results and found some common patterns about users' preferred input sensors and common interactions. In this paper we report the findings of the study and describe a new interface whose design is informed by the results.},
keywords = {3D manipulation, docking, mobile device},
}
@article{pintilie2013evaluation,
title = {An Evaluation of Interactive and Automated Next-best View Methods in {3D} Scanning},
author = {Pintilie*, Grigori D. and Stuerzlinger, Wolfgang},
journal = {Computer-Aided Design and Applications},
year = {2013},
month = {Mar},
volume = {10},
number = {2},
pages = {279-291},
doi = {https://doi.org/10.3722/cadaps.2013.279-291},
pdf = {papers/scanUI.pdf},
teaser = {teasers/scanUI.png},
abstract = {Scanning of objects to produce 3D models is becoming more commonplace as the required hardware is becoming less expensive and more widely attainable. The process involves obtaining scans of multiple views so as to create a complete 3D model. This is typically a user-driven process, and an analysis of the difficulty of this task, use of automation, visualization methods, and their effect on the final result has not yet been thoroughly investigated. In this paper we report on a user study related to 3D scanning in which the user is asked to use a simulated, somewhat simplified 3D scanner with a simple user interface. Our investigation focuses on scanning the complete surface of an object with decent sampling density, but does not take all sampling issues, such as reflections, into account. We evaluate different visualization methods, which aim to help the user complete or improve scans, and compare the results obtained by participants to those obtained using an automated approach. The results show that users can easily obtain complete scans or improve existing scans using this simple interface, and that different visualization methods are more or less equally effective; moreover, user performance is on par with automated scanning methods.},
keywords = {3D scanning, next-best view},
}
@article{mcarthur2010examining,
title = {Comparing {3D} Content Creation Interfaces in Two Virtual Worlds: World of Warcraft and Second Life},
author = {{McArthur}*, Victoria and Teather*, Robert J. and Stuerzlinger, Wolfgang},
journal = {Journal of Gaming & Virtual Worlds},
year = {2010},
month = {Dec},
volume = {2},
number = {3},
pages = {239-258},
doi = {https://doi.org/10.1386/jgvw.2.3.239_1},
pdf = {papers/3dui4virtualworldcreation.pdf},
teaser = {teasers/3dui4virtualworldcreation.png},
abstract = {In this article we compare the content creation systems of two popular virtual worlds: World of Warcraft and Second Life. We then discuss recommendations for 3D content creation systems based on current trends in 3D user interface research. We hypothesize that by designing 3D content creation systems that follow these recommendations, virtual world economies based on custom content creation (e.g., Second Life) may be transformed, as more people will be able to create and modify content.},
keywords = {3D modeling},
}
@article{bowman20083dui,
title = {{3D} User Interfaces: New Directions and New Perspectives},
author = {Bowman, Doug and Coquillart, Sabine and Fröhlich, Bernd and Hirose, Michitaka and Kitamura, Yoshifumi and Kiyokawa, Kiyoshi and Stuerzlinger, Wolfgang},
journal = {Computer Graphics & Applications},
publisher = {IEEE},
series = {CG&A},
year = {2008},
month = {Nov},
volume = {28},
number = {6},
pages = {20-36},
doi = {https://doi.org/10.1109/MCG.2008.109},
pdf = {papers/newdirections3dui.pdf},
abstract = {Three-dimensional user interfaces (3D UIs) allow users to interact with virtual objects, environments, or information using direct 3D input in the physical and/or virtual space. With the advent of systems like the Nintendo Wii, 3D UIs have entered the mainstream. Thus, research on 3D UIs is more relevant than ever. In this article, the founders and organizers of the IEEE Symposium on 3D User Interfaces reflect on the current state-of-the-art in several key aspects of 3D UIs, and speculate on future research directions for 3D UIs as well.},
keywords = {3D user interfaces},
}
@article{stuerzlinger2006covid,
title = {The Design and Realization of {CoViD}: A System for Collaborative Virtual {3D} Design},
author = {Stuerzlinger, Wolfgang and Zaman*, Loutfouz and Pavlovych*, Andriy and Oh*, Ji-Young},
journal = {Virtual Reality},
publisher = {Springer},
year = {2006},
month = {Oct},
volume = {10},
number = {2},
pages = {135-147},
doi = {https://doi.org/10.1007/s10055-006-0048-0},
pdf = {papers/covid.pdf},
teaser = {teasers/covid.png},
abstract = {Many important decisions in the design process are made fairly early on, after designers have presented initial concepts. In many domains, these concepts are already realized as 3D digital models. Then, in a meeting, the stakeholders for the project get together and evaluate these potential solutions. Frequently, the participants in this meeting want to interactively modify the proposed 3D designs to explore the design space better. Today's systems and tools do not support this, as computer systems typically support only a single user and computer-aided design tools require significant training.
This paper presents the design of a new system to facilitate a collaborative 3D design process. First, we discuss a set of guidelines which have been introduced by others and that are relevant to collaborative 3D design systems. Then, we introduce the new system, which consists of two main parts. The first part is an easy-to-use conceptual 3D design tool that can be used productively even by naive users. The tool provides novel interaction techniques that support important properties of conceptual design. The user interface is non-obtrusive, easy-to-learn, and supports rapid creation and modification of 3D models. The second part is a novel infrastructure for collaborative work, which offers an interactive table and several large interactive displays in a semi-immersive setup. It is designed to support multiple users working together. This infrastructure also includes novel pointing devices that work both as a stylus and a remote pointing device. The combination of the (modified) design tool with the collaborative infrastructure forms a new platform for collaborative virtual 3D design. Then, we present an evaluation of the system against the guidelines for collaborative 3D design. Finally, we present results of a preliminary user study, which asked naive users to collaborate in a 3D design task on the new system.},
keywords = {3D modeling, collaboration, design},
}
@article{vorozcovs2006hedgehog,
title = {The Hedgehog: A Novel Optical Tracking Method for Spatially Immersive Displays},
author = {Vorozcovs*, Andrew and Stuerzlinger, Wolfgang and Hogue*, Andrew and Allison, Robert},
journal = {Presence: Teleoperators & Virtual Environments},
year = {2006},
month = {Feb},
volume = {15},
number = {1},
pages = {108-121},
doi = {https://doi.org/10.1162/pres.2006.15.1.108},
pdf = {papers/hedgehog2.pdf},
teaser = {teasers/hedgehog2.png},
abstract = {Existing commercial technologies do not adequately meet the requirements for tracking in fully-enclosed Virtual Reality displays. We present a novel six degree of freedom tracking system, the Hedgehog, which overcomes several limitations inherent in existing sensors and tracking technology. The system reliably estimates the pose of the user's head with high resolution and low spatial distortion. Light emitted from an arrangement of lasers projects onto the display walls. An arrangement of cameras images the walls and the two-dimensional centroids of the projections are tracked to estimate the pose of the device. The system is able to handle ambiguous laser projection configurations, static and dynamic occlusions of the lasers, and incorporates an auto-calibration mechanism due to the use of the SCAAT (Single Constraint At A Time) algorithm. A prototype system was evaluated relative to a state-of-the-art motion tracker and showed comparable positional accuracy (1-2 mm RMS) and significantly better absolute angular accuracy (0.1 deg RMS).},
keywords = {3D tracking},
}
@article{seetzen2004hdrdisplay,
title = {High Dynamic Range Display Systems},
author = {Seetzen*, Helge and Heidrich, Wolfgang and Stuerzlinger, Wolfgang and Ward, Greg and Whitehead, Lorne and Trentacoste*, Matthew and Ghosh*, Abhijeet and Vorozcovs*, Andrew},
journal = {Transactions on Graphics},
publisher = {ACM},
series = {TOG},
year = {2004},
month = {Aug},
volume = {23},
number = {3},
pages = {760-768},
doi = {https://doi.org/10.1145/1015706.1015797},
pdf = {papers/hdrdisplays.pdf},
teaser = {teasers/hdrdisplays.png},
abstract = {The dynamic range of many real-world environments exceeds the capabilities of current display technology by several orders of magnitude. In this paper we discuss the design of two different display systems that are capable of displaying images with a dynamic range much more similar to that encountered in the real world. The first display system is based on a combination of an LCD panel and a DLP projector, and can be built from off-the-shelf components. While this design is feasible in a lab setting, the second display system, which relies on a custom-built LED panel instead of the projector, is more suitable for usual office workspaces and commercial applications. We describe the design of both systems as well as the software issues that arise. We also discuss the advantages and disadvantages of the two designs and potential applications for both systems.},
keywords = {high dynamic range, display},
note = {SIGGRAPH '04},
}
@article{oh2004conceptual,
title = {A System for Desktop Conceptual {3D} Design},
author = {Oh*, Ji-Young and Stuerzlinger, Wolfgang},
journal = {Virtual Reality},
publisher = {Springer},
year = {2004},
month = {Jun},
volume = {7},
number = {3-4},
pages = {198-211},
doi = {https://doi.org/10.1007/s10055-004-0128-y},
pdf = {papers/virtuallegodraft.pdf},
teaser = {teasers/virtuallego.png},
abstract = {In the traditional design process for a 3D environment, people usually depict a rough prototype to verify their ideas, and iteratively modify its configuration until they are satisfied with the general layout. In this activity, one of the main operations is the rearrangement of single and composite parts of a scene. With current desktop virtual reality (VR) systems, the selection and manipulation of arbitrary objects in 3D is still difficult. In this work, we present new and efficient techniques that allow even novice users to perform meaningful rearrangement tasks with traditional input devices. The results of our work show that the presented techniques can be mastered quickly and enable users to perform complex tasks on composite objects. Moreover, the system is easy to learn, supports creativity, and is fun to use.},
keywords = {3D modeling, 3D manipulation, 3D positioning, content creation, design},
}
@article{parilov2002perpixel,
title = {Per-pixel divisions},
author = {Parilov*, Sergey and Stuerzlinger, Wolfgang},
journal = {Journal of Graphics Tools},
series = {JGT},
year = {2002},
month = {Jun},
volume = {7},
number = {4},
pages = {53-59},
doi = {https://doi.org/10.1080/10867651.2002.10487572},
pdf = {papers/divisions.pdf},
abstract = {We describe a method to perform per-pixel divisions using graphics hardware, with a simple iterative algorithm. In the worst case, the number of rendering passes is 17 for approximate divisions, and 18 for accurate divisions. The algorithm can be used for 3D vector normalization, evaluating complex lighting models, and image reconstruction.},
keywords = {rendering, real-time},
}
@article{parilov2002layered,
title = {Layered Relief Textures},
author = {Parilov*, Sergey and Stuerzlinger, Wolfgang},
journal = {Journal of WSCG},
issn = {1213-6972},
year = {2002},
month = {Feb},
volume = {10},
number = {2},
pages = {357-364},
url = {http://wscg.zcu.cz/wscg2002/Papers_2002/F87.pdf},
pdf = {papers/lrt.pdf},
teaser = {teasers/lrt.png},
abstract = {In this paper we present an Image-Based Rendering method for post-warping LDI's in real-time on existing systems. The algorithm performs accurate splatting at low computational costs, reduces memory-access bottlenecks, enables us to trade-off the quality for the speed, and is simple to implement.},
keywords = {rendering, real-time, image-based},
note = {WSCG '02},
}
@article{elinas2000realtime,
title = {Real-time Rendering of {3D} Clouds},
author = {Elinas*, Pantelis and Stuerzlinger, Wolfgang},
journal = {Journal of Graphics Tools},
series = {JGT},
year = {2000},
month = {Jul},
volume = {5},
number = {4},
pages = {33-45},
doi = {https://doi.org/10.1080/10867651.2000.10487531},
pdf = {papers/clouds.pdf},
teaser = {teasers/clouds.png},
abstract = {The visual realism of a computer graphics simulation of outdoor scenery is greatly enhanced by realistic display of clouds. In this paper, we present an algorithm based on Gardner's work that can render perspectively correct 3D clouds in real-time on current graphics hardware. The use of 3D ellipsoids as primitives permits even close-ups without the viewer noticing the approximation. We describe an implementation using OpenGL.},
keywords = {rendering, real-time, image-based},
}
@article{stuerzlinger1998raytracing,
title = {Ray-Tracing Triangular Trimmed Free-Form Surfaces},
author = {Stürzlinger, Wolfgang},
journal = {Transactions on Visualization and Computer Graphics},
publisher = {IEEE},
series = {TVCG},
year = {1998},
month = {Jul},
volume = {4},
number = {3},
pages = {202-214},
doi = {https://doi.org/10.1109/2945.722295},
pdf = {papers/rtttffs.pdf},
teaser = {teasers/rtttffs.png},
abstract = {This paper presents a new approach to rendering triangular algebraic free form surfaces. A hierarchical subdivision of the surface with associated tight bounding volumes provides for quick identification of the surface regions likely to be hit by a ray. For each leaf of the hierarchy an approximation to the corresponding surface region is stored. The approximation is used to compute a good starting point for the iteration, which ensures rapid convergence.
Trimming curves are described by a tree of trimming primitives such as squares, circles, polygons and free form curves combined with Boolean operations. For trimmed surfaces an irregular adaptive subdivision is constructed to quickly eliminate all parts outside the trimming curve from consideration during rendering. Cost heuristics are introduced to optimize the rendering time further.},
keywords = {rendering, ray tracing},
}
@comment{c, c={unfortunate-dup, because paper selected by conference for journal, but conference proceedings later also reclassified as journal by publisher}}
@article{stuerzlinger1998calculating,
title = {Calculating Global Illumination for Glossy Surfaces},
author = {Stürzlinger, Wolfgang},
journal = {Computers & Graphics},
publisher = {Elsevier},
series = {C&G},
year = {1998},
month = {Mar},
volume = {22},
number = {2-3},
pages = {175-180},
doi = {https://doi.org/10.1016/S0097-8493(98)00004-1},
pdf = {papers/calcglos.pdf},
teaser = {teasers/calcglos.png},
abstract = {Photorealistic rendering is used to generate views of computer stored scenes. Global illumination algorithms take all transfers of light in the scene into account thereby creating a realistic looking image. Previously several approaches have been presented which are able to deal with global illumination for diffuse surfaces. More general surfaces are handled only by few methods.
This work presents a new algorithm for the generation of photorealistic images for scenes with arbitrary surfaces. Initially particle tracing and a reconstruction phase are used to obtain a good approximation to the directionally dependent illumination in the scene. The illumination information is stored and can be used subsequently to generate images from different viewpoints directly from the stored solution. The whole system is structured into several independent phases and is designed to allow parallel processing and incremental refinement.},
keywords = {rendering, global illumination},
}
@comment{c, c={unfortunate-dup, because conference proceedings later reclassified as journal volume by WSCG}}
@article{stuerzlinger1997optimized,
title = {Global Illumination with Glossy Surfaces},
author = {Stürzlinger, Wolfgang},
journal = {Journal of WSCG},
issn = {1213-6972},
year = {1997},
month = {Feb},
volume = {5},
number = {3},
pages = {543-551},
url = {http://wscg.zcu.cz/wscg1997/papers97/Stuerzlinger_97.pdf},
pdf = {papers/glossyill.pdf},
teaser = {teasers/glossyill.png},
abstract = {Photorealistic rendering is used to generate views of computer stored scenes. Global illumination algorithms take all transfers of light in the scene into account thereby creating a realistic looking image. Previously several approaches have been presented which are able to deal with global illumination for diffuse surfaces. More general surfaces are handled only by few methods.
This work presents a new algorithm for the generation of photorealistic images for scenes with arbitrary surfaces. Initially particle tracing and a reconstruction phase are used to obtain a good approximation to the directionally dependent illumination in the scene. The illumination information is stored and can be used subsequently to generate images from different viewpoints directly from the stored solution. The whole system is structured into several independent phases and is designed to allow parallel processing and incremental refinement.},
keywords = {rendering, global illumination},
note = {WSCG '97},
footnote = {Conference proceedings later republished as journal volume by publisher},
}
@article{schaufler_stuerzlinger1996three,
title = {Three Dimensional Image Cache for Virtual Reality},
author = {Schaufler*, Gernot and Stürzlinger, Wolfgang},
journal = {Computer Graphics Forum},
year = {1996},
month = {Aug},
volume = {15},
number = {3},
pages = {227-235},
doi = {https://doi.org/10.1111/1467-8659.1530227},
commented-url = {http://www.gup.uni-linz.ac.at:8001/staff/schaufler/papers/octimp},
pdf = {papers/octimp.pdf},
teaser = {teasers/octimp.png},
abstract = {Despite recent advances in rendering hardware, large and complex virtual environments cannot be displayed with a sufficiently high frame rate, because of limitations in the available rendering performance. This paper presents a new approach of software accelerated rendering which draws from the concepts of impostors, hierarchical scene subdivision and levels of detail. So far software optimization in real-time rendering has merely considered individual objects. This work is actually optimizing the rendering of the whole virtual environment by implementing a three dimensional image cache. It speeds up rendering for large portions of the scene by exploiting the coherence inherent in any smooth frame sequence. The implementation of the three dimensional image cache is discussed and the savings in rendering load achievable on a suitable hardware platform are presented.},
keywords = {rendering, real-time},
award = {This work received a Günther Enderle award for Best Technical Paper},
note = {Eurographics '96},
footnote = {A co-evolution with "Hierarchical image caching for accelerated walkthroughs of complex environments", https://doi.org/10.1145/237170.237209},
}
@comment{c, c={conference proceedings later reclassified as journal volume by publisher}}
@article{stuerzlinger1996optimized,
title = {Optimized Local Pass Using Importance Sampling},
author = {Stürzlinger, Wolfgang},
journal = {Journal of WSCG},
issn = {1213-6972},
year = {1996},
month = {Feb},
volume = {4},
number = {2},
pages = {342-349},
url = {http://wscg.zcu.cz/wscg1996/papers96/Stuerzlinger_96.pdf},
pdf = {papers/localpass.pdf},
teaser = {teasers/localpass.png},
abstract = {Recent approaches to realistic image synthesis split the rendering process into two passes. The first pass calculates an approximate global illumination solution, the second produces an image of high quality (from a user selected view point) using the solution obtained in the first pass by applying the local illumination model to each surface point visible through each pixel.
This paper presents two new methods to compute the local illumination quickly. Instead of recalculating form factors and visibilities the information computed by a hierarchical radiosity solution algorithm is reused. The image generation time is reduced significantly by using stochastic methods.},
keywords = {rendering, global illumination},
note = {WSCG '96},
footnote = {Conference proceedings later republished as journal volume by publisher},
}
@comment{c, c={conference proceedings later reclassified as journal volume by publisher}}
@article{stuerzlinger1994parallel,
title = {Parallel Progressive Radiosity with Parallel Visibility Computations},
author = {Stürzlinger, Wolfgang and Wild*, Christoph},
journal = {Journal of WSCG},
issn = {1213-6972},
year = {1994},
month = {Feb},
volume = {2},
number = {1},
pages = {66-74},
url = {http://wscg.zcu.cz/wscg1994/papers94/Stuerzlinger_Wild_94.pdf},
pdf = {papers/parrad.pdf},
teaser = {teasers/parrad.png},
abstract = {The radiosity method models the interaction of light between diffuse reflecting surfaces, thereby accurately predicting global illumination effects. Due to the high computational effort to calculate the transfer of light between surfaces and the memory requirements for the scene description, a distributed, parallelized version of the algorithm is needed for scenes consisting of thousands of surfaces. We present a distributed, parallel radiosity algorithm, which can subdivide the surfaces adaptively. Additionally we present a scheme for parallel visibility calculations. Adaptive load redistribution is also discussed.},
keywords = {rendering, global illumination, parallel, visibility},
note = {WSCG '94},
footnote = {Conference proceedings later republished as journal volume by publisher},
}
@comment{c, c={leave the "_stuerzlinger" in the ID to enable umlaut-free search!}}
@article{barth_stuerzlinger1993efficient,
title = {Efficient Ray Tracing for Bezier and B-Spline Surfaces},
author = {Barth, Wilhem and Stürzlinger, Wolfgang},
journal = {Computers & Graphics},
publisher = {Elsevier},
series = {C&G},
year = {1993},
month = {Jul},
volume = {17},
number = {4},
pages = {423-430},
doi = {https://doi.org/10.1016/0097-8493(93)90031-4},
pdf = {papers/rtbez.pdf},
teaser = {teasers/rtbez.png},
abstract = {Generating realistic pictures by raytracing requires intersecting the objects with many rays (1~ million or more). With Bezier or B-Spline surfaces as objects the intersections must be calculated by an iterative method. This paper describes an algorithm which performs these calculations efficiently. In a preprocessing step the surface is subdivided adaptively into parts and a tight enclosure is calculated for each part. We selected parallelepipeds (first order approximations) as enclosures, their orientation and the angles between their edges are chosen in such a way that they enclose the respective part as tightly as possible, they are not rectangular in general. A binary tree built with these enclosures allows to test very fast which parts of the surface may be hit by a given ray. The leaves of the tree contain small, almost plane parts of the surface. For each part a linear approximation is calculated, this is a parallelogram, in general not rectangular. For each ray which hits the enclosure the intersection with this approximation is calculated first, yielding an accurate starting point for the following iteration.},
keywords = {rendering, ray tracing},
}
@comment{************************articles_in_books************************}
@inbook{seetzen2023hdrdisplay,
title = {High Dynamic Range Display Systems},
author = {Seetzen*, Helge and Heidrich, Wolfgang and Stuerzlinger, Wolfgang and Ward, Greg and Whitehead, Lorne and Trentacoste*, Matthew and Ghosh*, Abhijeet and Vorozcovs*, Andrew},
booktitle = {Seminal Graphics Papers: Pushing the Boundaries},
publisher = {ACM},
year = {2023},
month = {Aug},
volume = {2},
articleno = {5},
numpages = {9},
edition = {1},
doi = {https://doi.org/10.1145/3596711.3596717},
pdf = {papers/hdrdisplays2.pdf},
teaser = {teasers/hdrdisplays.png},
abstract = {The dynamic range of many real-world environments exceeds the capabilities of current display technology by several orders of magnitude. In this paper we discuss the design of two different display systems that are capable of displaying images with a dynamic range much more similar to that encountered in the real world. The first display system is based on a combination of an LCD panel and a DLP projector, and can be built from off-the-shelf components. While this design is feasible in a lab setting, the second display system, which relies on a custom-built LED panel instead of the projector, is more suitable for usual office workspaces and commercial applications. We describe the design of both systems as well as the software issues that arise. We also discuss the advantages and disadvantages of the two designs and potential applications for both systems.},
keywords = {high dynamic range, display},
note = {Republished by ACM},
}
@inbook{batmaz2022rotposjitter,
title = {Rotational and Positional Jitter in Virtual Reality Interaction},
author = {Batmaz, Anil Ufuk and Stuerzlinger, Wolfgang},
booktitle = {Everyday Virtual Reality},
publisher = {Springer},
year = {2022},
month = {May},
pages = {89–118},
doi = {https://doi.org/10.1007/978-3-031-05804-2_4},
pdf = {papers/rotposjitter.pdf},
teaser = {teasers/rotposjitter.png},
abstract = {One of the elements that affect 3D tracking performance in Virtual Reality (VR) systems is fluctuations in the signal, called jitter, which occurs regardless of the sensor technology used. In real-life VR systems, positional and rotational jitter can be found in all tracked objects, including the headset, controllers, or other trackers. Previous work had identified that ±0.5° rotational jitter negatively affects user performance for distal pointing. Yet, they also found that even using a second controller to reduce the “Heisenberg effect” introduced by the button press does not address the problem completely. Moreover, with jitter on the position of a virtual object, user performance significantly decreases with jitter above one fourth of the size of that virtual object. Still, users preferred to have positional jitter on a virtual target rather than rotational jitter on a VR controller. In this paper, we extended the previous literature by conducting a user study on angular jitter with controllers held with two different grip styles and targets at two different depth distances. The results revealed that user performance decreases (already) with ±0.25° jitter. Thus, we suggest that practitioners/developers who design 3D user interfaces, controllers, and interaction techniques for daily 3D VR usage should focus on reducing jitter. Decreasing jitter not only improves user performance, but also decreases frustration, which improves the user experience.},
keywords = {3D pointing, mid-air, jitter},
}
@inbook{dwyer2018immersive,
title = {Immersive analytics: An Introduction},
author = {Dwyer, Tim and Marriott, Kim and Isenberg, Tobias and Klein, Karsten and Riche, Nathalie and Schreiber, Falk and Stuerzlinger, Wolfgang and Thomas, Bruce H.},
booktitle = {Immersive Analytics},
publisher = {Springer},
year = {2018},
month = {Oct},
volume = {LNCS 11190},
pages = {1-23},
doi = {https://doi.org/10.1007/978-3-030-01388-2_1},
pdf = {papers/IAchapter1_Intro.pdf},
teaser = {teasers/iabook.png},
abstract = {Immersive Analytics is a new research initiative that aims to remove barriers between people, their data and the tools they use for analysis and decision making. Here we clarify the aims of immersive analytics research, its opportunities and historical context, as well as providing a broad research agenda for the field. In addition, we review how the term immersion has been used to refer to both technological and psychological immersion, both of which are central to immersive analytics research.},
keywords = {immersive analytics, visualization, visual analytics},
}
@inbook{marriott2018immersive,
title = {Immersive Analytics: Time to Reconsider the Value of {3D} for Information Visualisation},
author = {Marriott, Kim and Chen, Jian and Hlawatsch, Marcel and Itoh, Takayuki and Nacenta, Miguel A. and Reina, Guido and Stuerzlinger, Wolfgang},
booktitle = {Immersive Analytics},
publisher = {Springer},
year = {2018},
month = {Oct},
volume = {LNCS 11190},
pages = {25-55},
doi = {https://doi.org/10.1007/978-3-030-01388-2_2},
pdf = {papers/IAchapter2_3DVis.pdf},
teaser = {teasers/iabook.png},
abstract = {Modern virtual reality display technologies engender spatial immersion by using a variety of depth cues such as perspective and head-tracked binocular presentation to create visually realistic 3D worlds. While 3D visualisations are common in scientific visualisation, they are much less common in information visualisation. In this chapter we explore whether immersive analytic applications should continue to use traditional 2D information visualisations or whether there are situations when 3D may offer benefits. We identify a number of potential applications of 3D depth cues for abstract data visualisation: using depth to show an additional data dimension, such as in 2.5D network layouts, views on non-flat surfaces and egocentric views in which the data is placed around the viewer, and visualising abstract data with a spatial embedding. Another important potential benefit is the ability to arrange multiple views in the 3D space around the user and to attach abstract visualisations to objects in the real world.},
keywords = {immersive analytics, visual analytics, 3D visualization},
}
@inbook{bueschel2018interaction,
title = {Interaction for Immersive Analytics},
author = {Büschel, Wolfgang and Chen, Jian and Dachselt, Raimund and Drucker, Steven and Dwyer, Tim and Görg, Carsten and Isenberg, Tobias and Kerren, Andreas and North, Chris and Stuerzlinger, Wolfgang},
booktitle = {Immersive Analytics},
publisher = {Springer},
year = {2018},
month = {Oct},
volume = {LNCS 11190},
pages = {95-138},
doi = {https://doi.org/10.1007/978-3-030-01388-2_4},
pdf = {papers/IAchapter4_Interaction.pdf},
teaser = {teasers/iabook.png},
abstract = {In this chapter, we briefly review the development of natural user interfaces and discuss their role in providing human-computer interaction that is immersive in various ways. Then we examine some opportunities for how these technologies might be used to better support data analysis tasks. Specifically, we review and suggest some interaction design guidelines for immersive analytics. We also review some hardware setups for data visualization that are already archetypal. Finally, we look at some emerging system designs that suggest future directions.},
keywords = {immersive analytics, visualization, visual analytics},
}
@inbook{stuerzlinger2018immersive,
title = {Immersive human-centered computational analytics},
author = {Stuerzlinger, Wolfgang and Dwyer, Tim and Drucker, Steven and Görg, Carsten and North, Chris and Scheuermann, Gerik},
booktitle = {Immersive Analytics},
publisher = {Springer},
year = {2018},
month = {Oct},
volume = {LNCS 11190},
pages = {139-163},
doi = {https://doi.org/10.1007/978-3-030-01388-2_5},
pdf = {papers/IAchapter5_humancentered.pdf},
teaser = {teasers/iabook.png},
abstract = {In this chapter we seek to elevate the role of the human in human-machine cooperative analysis through a careful consideration of immersive design principles. We consider both strategic immersion through more accessible systems as well as enhanced understanding and control through immersive interfaces that enable rapid workflows. We extend the classic sensemaking loop from visual analytics to incorporate multiple views, scenarios, people, and computational agents. We consider both sides of machine/human collaboration: allowing the human to more fluidly control the machine process; and also allowing the human to understand the results, derive insights and continue the analytic cycle. We also consider system and algorithmic implications of enabling real-time control and feedback in immersive human-centered computational analytics.},
keywords = {immersive analytics, visualization, visual analytics, collaboration},
}
@inbook{marriott2018just,
title = {Just 5 Questions: Toward a Design Framework for Immersive Analytics},
author = {Marriott, Kim and Chen, Jian and Hlawatsch, Marcel and Itoh, Takayuki and Nacenta, Miguel A. and Reina, Guido and Stuerzlinger, Wolfgang},
booktitle = {Immersive Analytics},
publisher = {Springer},
year = {2018},
month = {Oct},
volume = {LNCS 11190},
pages = {259-288},
doi = {https://doi.org/10.1007/978-3-030-01388-2_9},
pdf = {papers/IAchapter9_5Questions.pdf},
teaser = {teasers/iabook.png},
abstract = {We present an initial design framework for immersive analytics based on Brehmer and Munzner's "What-Why-How" data visualisation framework. We extend their framework to take into account Who are the people or teams of people who are going to use the system, and Where is the system to be used and what are the available devices and technology. In addition, the How component is extended to cater for collaboration, multisensory presentation, interaction with an underlying computational model, degree of fidelity and organisation of the workspace around the user. By doing so we provide a framework for understanding immersive analytics research and applications as well as clarifying how immersive analytics differs from traditional data visualisation and visual analytics.},
keywords = {immersive analytics, visualization, visual analytics},
}
@inbook{stuerzlinger2014considerations,
title = {Considerations for Targets in {3D} Pointing Experiments},
author = {Stuerzlinger, Wolfgang and Teather*, Robert J.},
booktitle = {{HCI} Korea},
series = {HCIK '15},
year = {2014},
commented-year = {2015},
month = {Dec},
commented-month = {Jan},
pages = {162–168},
url = {https://dl.acm.org/doi/abs/10.5555/2729485.2729510},
pdf = {papers/considerations.pdf},
teaser = {teasers/considerations.png},
abstract = {We identify various tradeoffs in the design of 3D pointing experiments based on Fitts' law and the ISO9241-9 methodology. The advantages and disadvantages of several approaches for such experiments are analyzed and compared against each other. Results of an experiment that investigates various visual aids are presented as evidence. We conclude with recommendations for 3D pointing experiments and avenues of future work.},
keywords = {3D pointing},
}
@inbook{stuerzlinger2011value,
title = {The Value of Constraints for {3D} User Interfaces},
author = {Stuerzlinger, Wolfgang and Wingrave*, Chad},
booktitle = {Virtual Realities},
publisher = {Springer},
year = {2011},
month = {Jan},
pages = {203-224},
doi = {https://doi.org/10.1007/978-3-211-99178-7_11},
pdf = {papers/valueconstraints.pdf},
abstract = {User interfaces to three-dimensional environments are becoming more and more popular. Today this trend is fuelled through the introduction of social communication via virtual worlds, console and computer games, as well as 3D televisions.
We present a synopsis of the relevant abilities and restrictions introduced by both input and output technologies, as well as an overview of related human capabilities and limitations, including perceptual and cognitive issues. Partially based on this, we present a set of guidelines for 3D user interfaces. These guidelines are intended for developers of interactive 3D systems, such as computer and console games, 3D modeling packages, augmented reality systems, computer aided design systems, and virtual environments. The guidelines promote techniques, such as using appropriate constraints, that have been shown to work well in these types of environments.},
keywords = {3D user interfaces, constraints},
}
@comment{************************conference_articles************************}
@inproceedings{gemici2026crossingrealities,
title = {Crossing Realities Has a Cost: Evaluating AR Second Screens for AI-Assisted Desktop Authoring},
author = {Gemici*, Mucahit and Bashar*, Mohammad Raihanul and Stuerzlinger, Wolfgang and Phadnis, Vrushank and Batmaz, Anil Ufuk},
booktitle = {Symposium on Spatial User Interaction},
publisher = {ACM},
series = {SUI '26},
year = {2026},
month = {Oct},
commented-articleno = {2},
numpages = {12},
commented-doi = {https://doi.org/10.1145/00000.00000},
commented-pdf = {papers/crossingrealities.pdf},
commented-teaser = {teasers/crossingrealities.png},
abstract = {AI-assisted authoring requires users to frequently exchange user-generated and AI-generated content between a primary workspace and a Large Language Model (LLM) assistant. Such repetitive actions can fragment attention and compete for limited display space. While Augmented Reality (AR) has been proposed as a way to extend desktop workspaces with virtual displays, just adding a spatial display area does not address the repeated attention shifts, input-focus changes, and content-transfer steps required in LLM-assisted workflows. This creates a gap in understanding whether AR second screens support such workflows or introduce cross-reality transition costs that limit their effectiveness. To investigate this gap, we designed an AR-Second-Screen system around a unified keyboard-and-mouse interaction model and evaluated it against Single-Screen and Dual-Screen desktop setups. Results show that Dual-Screen remained more efficient than AR-Second-Screen, with significantly lower task completion time and switching cost. AR-Second-Screen also produced higher task and LLM idle ratios, indicating re-engagement costs when users crossed between physical and virtual workspaces. At the same time, participants rated AR positively and preferred it significantly over Single-Screen, with no significant difference in preference compared to Dual-Screen. These findings show that spatially extending AI-assisted workflows into AR can be appealing, yet effective cross-reality interfaces must minimize transition costs rather than just simply adding a virtual display space.},
keywords = {extended reality, LLM, crossing realities},
note = {Conditionally accepted, to appear},
}
@inproceedings{noh2026drattention,
title = {Exploring Diminished Reality for Attention Support: A Co-Design Study with Students with ADHD},
author = {Noh+, Alex and Safikhani+, Audrey and Zhu*, Anjun and Stuerzlinger, Wolfgang and Kim, Lawrence},
booktitle = {Designing Interactive Systems},
publisher = {ACM},
series = {DIS '26},
year = {2026},
month = {Jun},
pages = {891-903},
doi = {https://doi.org/10.1145/3800645.3813095},
pdf = {papers/drattention.pdf},
commented-video = {videos/drattention.mp4},
teaser = {teasers/drattention.png},
abstract = {Diminished Reality (DR) modifies or removes elements of the perceived environment. We explored DR for attention support through diary studies, interviews, and speculative co-design with 15 university students with ADHD. Participants described a persistent gap between intention and attention, and the use of externalization strategies that encounter fundamental limits in physical reality. In co-design, rather than reasoning from visual operations, participants articulated which properties of stimuli they needed to perceive versus filter, revealing cases where visual diminishment does not reliably map to attentional diminishment. We contribute rich descriptive data on the attentional challenges and DR preferences of students with ADHD, and propose Attentional Diminishment, a sensitizing concept that reframes DR for attention support from visual outcomes to attentional effects.},
keywords = {diminished reality, filtered reality, adhd, attention deficit hyperactivity disorder},
}
@inproceedings{amini2026steeringthroughput3d,
title = {Improving Steering Law Throughput Calculation by Defining Effective Parameters in 3D Virtual Environments},
author = {Amini*, Mohammadreza and Stuerzlinger, Wolfgang and Yamanaka, Shota and Liang, Hai-Ning and Batmaz, Anil Ufuk},
booktitle = {Conference on Human Factors in Computing Systems},
publisher = {ACM},
series = {CHI '26},
year = {2026},
month = {Apr},
articleno = {1141},
numpages = {20},
doi = {https://doi.org/10.1145/3772318.3790579},
pdf = {papers/steeringthroughput3d.pdf},
video = {videos/steeringthroughput3d.mp4},
teaser = {teasers/steeringthroughput3d.png},
abstract = {Throughput is a widely used performance metric, combining speed and accuracy into a single measure, while reducing the effect of subjective speed–accuracy trade-offs. Despite its wide application in 2D steering tasks, its direct extension to 3D presents unique challenges since 3D trajectories exhibit higher variability, and perceptual–motor factors undermine existing formulations. Consequently, throughput has not been systematically adopted for evaluating steering in 3D virtual environments. In this paper, using a controlled virtual reality user study with a ring-and-wire task, we introduce and validate a novel throughput formulation for 3D steering based on the bivariate standard deviation of the trajectory for the effective width calculation. Our results show that this formulation provides smoother throughput values across subjective speed–accuracy differences and improves model fit compared to traditional approaches. This work advances our theoretical understanding of the Steering law in 3D contexts, provides researchers and practitioners with a robust evaluation method, and establishes a foundation for future studies of complex 3D trajectory interactions.},
keywords = {3D steering, 3D user interface, 3D interaction, trajectory-based interaction, behavior modeling},
}
@inproceedings{turkmen2026handvis,
title = {Investigating Adaptive Hand Visibilities for Accurate 3D User Interactions in Augmented Reality},
author = {Turkmen*, Rumeysa and Hatira*, Nour and Teather, Robert J and Kersten-Oertel, Marta and Stuerzlinger, Wolfgang and Batmaz, Anil Ufuk},
booktitle = {Conference on Virtual Reality and {3D} User Interfaces Abstracts and Workshops, Workshop on Novel Input Devices and Interaction Techniques at {VR}},
publisher = {IEEE},
series = {NIDIT '26},
year = {2026},
month = {Mar},
pages = {338-343},
doi = {https://doi.org/10.1109/VRW70859.2026.00067},
pdf = {papers/handvis.pdf},
teaser = {teasers/handvis.png},
commented-video = {videos/handvis.mp4},
abstract = {Augmented Reality (AR) tasks that require fine motor control often rely on visual hand representations, yet fully visible hands can introduce occlusion and reduce accuracy. In this work, we investigate adaptive hand visualization techniques that dynamically adjust hand visibility based on the current interaction phase to improve accuracy in AR. We designed an AR-based pedicle screw placement task, in which users insert virtual screws into a physical spine model. To evaluate how hand visualization affects task performance, we conducted a user study with 15 participants who performed the task under five hand visualization conditions: Opaque, Transparent, Invisible, Speed-based and Position-based visibility. Our results show that adaptive visualization techniques significantly improve screw placement accuracy compared to the commonly used opaque hand representation. These findings demonstrate the benefits of dynamically adapting hand visibility can support accuracy-critical interactions.},
keywords = {hand visibility, 3D docking},
}
@inproceedings{zhao2026hybridsthfp,
title = {A User-Friendly Accurate Bare-Handed Manipulation Technique for Distant Objects in Virtual Reality},
author = {Zhao*, Di Bill and Stuerzlinger, Wolfgang},
booktitle = {Conference on Virtual Reality and {3D} User Interfaces Abstracts and Workshops, Workshop on Novel Input Devices and Interaction Techniques at {VR}},
publisher = {IEEE},
series = {NIDIT '26},
year = {2026},
month = {Mar},
pages = {373-378},
doi = {https://doi.org/10.1109/VRW70859.2026.00073},
pdf = {papers/hybridsthfp.pdf},
teaser = {teasers/hybridsthfp.png},
video = {videos/hybridsthfp.mp4},
abstract = {Bare-hand interaction is now common in virtual reality, but does not afford accurate manipulation of distant objects. Prior approaches rely on ray-casting, motion scaling, proxies, or near-field widgets, often trading precision for speed or increasing cognitive and physical demand. We present two bare-hand techniques for distant object manipulation: Scaled Two-Hand Finger-Palm (STHFP), which uses the non-dominant hand as a control surface for precise manipulation, and HYBRID, which combines fast ray-based positioning with two-handed refinement.
Results from our user study comparing STHFP and HYBRID against scaled bare-hand HOMER show that both new techniques significantly improve positional and rotational accuracy while reducing physical workload. While STHFP requires more interaction time, HYBRID achieves a balanced trade-off between speed and precision. Qualitative findings further reveal how constraint-based control and staged workflows shape user strategies and perceived effort. Together, our results demonstrate that leveraging the hand as a control surface can enable accurate, usable, and controller-free manipulation of distant objects in VR.},
keywords = {hand interaction, bare-hand, 3D manipulation, 3D positioning, 3D rotation, 3D pose},
}
@inproceedings{liu2026scaledmouse,
title = {Scaled Mouse: An Efficient and Accurate Interaction Technique for 3D Docking in Seated VR},
author = {Liu*, Xinpeng and Zhao*, Di Bill and Stuerzlinger, Wolfgang},
booktitle = {Conference on Virtual Reality and {3D} User Interfaces},
publisher = {IEEE},
series = {VR '26},
year = {2026},
month = {Mar},
pages = {718-728},
doi = {https://doi.org/10.1109/VR67842.2026.00091},
pdf = {papers/scaledmouse.pdf},
video = {videos/scaledmouse.mp4},
teaser = {teasers/scaledmouse.png},
abstract = {This paper presents an empirical evaluation of mouse-based interaction in seated Virtual Reality (VR) scenarios as an alternative to traditional VR controllers. We introduce Scaled Mouse, an interaction technique that shows the position of the real mouse in VR and maps standard mouse actions to 3D object manipulation using velocity-based scaling. We present two user studies assessing this method. In the first study, we compared a VR controller against our mouse-based method for manipulation tasks. Results show that the mouse consistently achieved higher rotation accuracy in 3D rotation and docking tasks than the controller, while maintaining comparable task completion times. Building on prior scaled interaction techniques, our second study investigated mouse interaction in a productivity-oriented scenario where users could combine 3D manipulation with a 2D adjustment panel. Scaled Mouse interaction was significantly faster and more accurate than the controller for 3D docking tasks and was rated significantly higher in usability and workload measures. Together, these findings establish the mouse as a viable and effective input device for seated VR contexts, offering both familiarity and accuracy advantages over controllers, particularly for professional and productivity-focused applications.},
keywords = {3D pointing, 3D selection, 3D manipulation},
}
@inproceedings{amini2025tunnelsvswires,
title = {Tunnels vs. Wires: A Comparative Analysis of Two 3D Steering Tasks in Virtual Environments},
author = {Amini*, Mohammadreza and Stuerzlinger, Wolfgang and Yamanaka, Shota and Liang, Hai-Ning and Batmaz, Anil Ufuk},
booktitle = {31st Symposium on Virtual Reality Software and Technology},
publisher = {ACM},
series = {VRST '25},
year = {2025},
month = {Nov},
articleno = {15},
numpages = {11},
doi = {https://doi.org/10.1145/3756884.3766023},
pdf = {papers/tunnelsvswires.pdf},
video = {videos/tunnelsvswires.mp4},
teaser = {teasers/tunnelsvswires.png},
abstract = {Steering involves continuous movement along constrained paths, well-studied in 2D. The extensions to 3D using the Ring-and-Wire and Ball-and-Tunnel tasks were often treated as interchangeable in previous work. In this paper, we directly compare these two tasks through a within-subjects user study (n = 18) with varying 3D path orientations. The results show that Ring-and-Wire significantly outperformed Ball-and-Tunnel, with 17.17% lower task time, 21.65% higher throughput, and 21.52% faster average speed. Participants also preferred Ring-and-Wire and reported lower workload. Visual ambiguity, especially near the tunnel's rear surface, complicated spatial perception in the Ball-and-Tunnel task. We thus recommend that future studies choose 3D steering tasks carefully for experiments, as the two tasks are not interchangeable.},
keywords = {3D steering},
award = {This work was nominated for a Best Paper Award},
}
@inproceedings{panda2025evaluatingdyndash,
title = {Evaluating the Utility of Multiple Workspaces and Easy Chart Creation for Visual Analytics},
author = {Panda, Swaroop and Stuerzlinger, Wolfgang},
booktitle = {Human-Computer Interaction},
commented-publisher = {Springer},
series = {HCI International '25},
year = {2025},
month = {May},
volume = {LNCS 15766},
pages = {103-122},
doi = {https://doi.org/10.1007/978-3-031-93835-1_7},
pdf = {papers/evaluatingdyndash.pdf},
teaser = {teasers/evaluatingdyndash.png},
abstract = {Visual Analytics involves interactive visual exploration of data sets. Interaction methods allow data analysts to explore different aspects and investigate various hypotheses. This work investigates if chart creation and multiple tabs enable analysts to pursue multiple hypotheses or analysis paths better than other approaches. To evaluate this, new features were added to an existing Visual Analytics prototype with a multi-tab design. Two user studies with professional data analysts confirmed the utility of our approach within the Visual Analytics process. Analysts can easily work within multiple workspaces, enabling them to frame and track multiple hypotheses about the data and pursue different exploratory analysis paths, ultimately yielding more comprehensive analysis outcomes.},
keywords = {visual analytics},
}
@inproceedings{le2025redirectedstepper,
title = {RedirectedStepper: Exploring Walking-In-Place Locomotion in VR Using a Mini Stepper for Ascents},
author = {Le*, Quang-Tri and Nham*, Huynh-Duc and Tran, Tanh Quang and Fjeld, Morten and Stuerzlinger, Wolfgang and Zank, Markus and Tran, Minh-Triet and Le, Khanh-Duy},
booktitle = {Conference on Human Factors in Computing Systems},
publisher = {ACM},
series = {CHI '25},
year = {2025},
month = {Apr},
articleno = {614},
numpages = {17},
doi = {https://doi.org/10.1145/3706598.3713313},
pdf = {papers/redirectedstepper.pdf},
video = {videos/redirectedstepper.mp4},
teaser = {teasers/redirectedstepper.png},
abstract = {Walking on inclined surfaces is common in some Virtual Reality (VR) scenarios, for instance when moving between floors of a building, climbing a tower, or ascending a virtual mountain. Existing approaches enabling realistic walking experiences in such settings typically require the user to use bulky walking-in-place hardware or to walk in a physical area. Addressing this challenge, we present RedirectedStepper, a locomotion technique leveraging a novel device based on a mini exercise stepper to provide realistic VR staircase walking experiences by alternating the tilt of the two stepper pedals. RedirectedStepper employs a new exponential mapping function to visually morph the user’s real foot motion to a corresponding curved path in the virtual environment (VE). Combining this stepper and the visual mapping function provides an in-place locomotion technique allowing users to virtually ascend an infinite staircase or slope while walking-in-place (WIP). We conducted three within-subject user studies (n=36) comparing RedirectedStepper with a WIP locomotion technique using the Kinect. Our studies indicate that RedirectedStepper improves the users’ sense of realism in walking on staircases in VR. Based on a set of design implications derived from the user studies, we developed SnowRun, a VR exergame application, demonstrating the use of the RedirectedStepper concept.},
keywords = {locomotion, 3d navigation},
}
@inproceedings{amini2025review3dfitts,
title = {A Systematic Review of Fitts' Law in 3D Extended Reality},
author = {Amini*, Mohammadreza and Stuerzlinger, Wolfgang and Teather, Robert J and Batmaz, Anil Ufuk},
booktitle = {Conference on Human Factors in Computing Systems},
publisher = {ACM},
series = {CHI '25},
year = {2025},
month = {Apr},
articleno = {625},
numpages = {25},
doi = {https://doi.org/10.1145/3706598.3713623},
pdf = {papers/review3dfitts.pdf},
teaser = {teasers/review3dfitts.png},
abstract = {Fitts' law is widely used as an evaluation tool for pointing or selection tasks, evolving into diverse applications, including 3D extended reality (XR) environments like virtual, augmented, and mixed reality. Despite standards like ISO 9241:411, the application of Fitts' law varies significantly across studies, complicating comparisons and undermining the reliability of findings in 3D XR research. To address this, we conducted a systematic review of 1957 papers, focusing on 122 studies that used Fitts' law in 3D XR user experiments. Our analysis shows that over half of these studies referenced Fitts' law without thoroughly investigating throughput, movement time, or error rate. We performed an in-depth meta-analysis to examine how Fitts' law is incorporated into research. By highlighting trends and inconsistencies, and making recommendations this review aims to guide researchers in designing and performing more effective and consistent Fitts-based studies in 3D XR, enhancing the quality and impact of future research.},
keywords = {3d pointing, 3d selection},
}
@inproceedings{srabonee2025hexacotext,
title = {Exploring the Impacts of HEXACO Personality Traits on Text Composition and Transcription},
author = {Srabonee*, Jannatul Ferdous and Alharbi, Ohoud and Stuerzlinger, Wolfgang and Arif, Ahmed Sabbir},
booktitle = {Conference on Human Factors in Computing Systems},
publisher = {ACM},
series = {CHI '25},
year = {2025},
month = {Apr},
articleno = {577},
numpages = {24},
doi = {https://doi.org/10.1145/3706598.3714149},
pdf = {papers/hexacotext.pdf},
teaser = {teasers/hexacotext.png},
abstract = {This study investigates the relationship between the HEXACO personality traits and text entry behaviors in composition and transcription tasks. By analyzing metrics such as entry speed, accuracy, editing efforts, and readability, we identified correlations between specific traits and text entry performance. In composition, honesty-humility and agreeableness were the strongest predictors, correlating significantly with composition time, text length, and editing efforts. In transcription, openness, honesty-humility, and agreeableness influenced performance, though no single trait consistently predicted all metrics. Interestingly, extraversion did not show strong correlations in either task, despite its established link to composition performance in academic contexts. These findings suggest that personality traits affect text entry behavior differently depending on the task, with creative tasks like composition being shaped by distinct traits compared to repetitive tasks like transcription. This research provides valuable insights into the relationship between personality and text entry, opening avenues for personalizing interaction systems based on individual traits.},
keywords = {text entry, personality, text composition, transcription},
}
@inproceedings{mutasim2025gazemtd,
title = {There Is More to Dwell Than Meets the Eye: Toward Better Gaze-Based Text Entry Systems With Multi-Threshold Dwell},
author = {Mutasim*, Aunnoy K and Bashar*, Mohammad Raihanul and Lutteroth, Christof and Batmaz, Anil Ufuk and Stuerzlinger, Wolfgang},
booktitle = {Conference on Human Factors in Computing Systems},
publisher = {ACM},
series = {CHI '25},
year = {2025},
month = {Apr},
articleno = {1088},
numpages = {18},
doi = {https://doi.org/10.1145/3706598.3713781},
pdf = {papers/gazemtd.pdf},
video = {videos/gazemtd.mp4},
teaser = {teasers/gazemtd.png},
abstract = {Dwell-based text entry seems to peak at 20 words per minute (WPM). Yet, little is known about the factors contributing to this limit, except that it requires extensive training. Thus, we conducted a longitudinal study, broke the overall dwell-based selection time into six different components, and identified several design challenges and opportunities. Subsequently, we designed two novel dwell keyboards that use multiple yet much shorter dwell thresholds: Dual-Threshold Dwell (DTD) and Multi-Threshold Dwell (MTD). The performance analysis showed that MTD (18.3 WPM) outperformed both DTD (15.3 WPM) and the conventional Constant-Threshold Dwell (12.9 WPM). Notably, absolute novices achieved these speeds within just 30 phrases. Moreover, MTD’s performance is also the fastest-ever reported average text entry speed for gaze-based keyboards. Finally, we discuss how our chosen parameters can be further optimized to pave the way toward more efficient dwell-based text entry.},
keywords = {gaze, eye tracking, text entry},
}
@inproceedings{zhao2025thfp,
title = {A Novel Bare-Handed Manipulation Technique for Distant Objects in Virtual Reality},
author = {Zhao*, Di Bill and Stuerzlinger, Wolfgang},
booktitle = {Conference on Virtual Reality and {3D} User Interfaces Abstracts and Workshops, Workshop on Novel Input Devices and Interaction Techniques at {VR}},
publisher = {IEEE},
series = {NIDIT '25},
year = {2025},
month = {Mar},
pages = {353-360},
doi = {https://doi.org/10.1109/VRW66409.2025.00083},
pdf = {papers/thfp.pdf},
teaser = {teasers/thfp.png},
video = {videos/thfp.mp4},
abstract = {Advancements in bare-hand tracking technology, featured in many modern virtual reality (VR) headsets, have enabled intuitive hand interaction for proximate 3D object manipulation. However, manipulating distant 3D objects in VR with bare hands remains a challenge, and our work explores the potential of two-handed interaction in this context. Previous work highlighted the ease of using the non-dominant wrist as an interactive surface for interaction, by pointing at it with the dominant hand's index finger. Our research expands this paradigm by extending the interactive zone to the entire non-dominant hand so that the user can interact with their index finger on the non-dominant hand’s fingers and palm to adeptly and precisely manipulate a distant 3D object's position and rotation. Through a user study, we compared our Two-Hand Fingertip-Palm technique (THFP) with a bare-hand variant of HOMER (BHOMER) on efficiency, accuracy, and usability. The results demonstrate a notable accuracy improvement (at least 75% better), especially in complex tasks, such as hanging a painting on a slanted wall, albeit at the expense of efficiency (about 47% slower) compared to BHOMER. While BHOMER is faster, it also exhibits more variation in time, and at the average BHOMER end time, our new technique is still substantially more accurate than BHOMER. Further, our method received a more favorable rating on the System Usability Scale (SUS), underscoring our approach's user-centric and intuitive design. Further, the NASA Task Load Index (NASA-TLX) indicates that THFP not only improves the task completion rate and user satisfaction but also reduces the cognitive, physical, and temporal demand for users. In addition, we discuss insights into the integration of constraints, error prevention, and the facilitation of consistent interaction. Our findings lay a solid foundation for using our new method in the quickly advancing VR field.},
keywords = {hand interaction, bare-hand, 3D manipulation, 3D positioning, 3D rotation, 3D pose},
}
@inproceedings{xu2025predictingray,
title = {Predicting Ray Pointer Landing Poses in VR Using Multimodal LSTM-Based Neural Networks},
author = {Xu*, Wenxuan and Wei*, Yushi and Hu*, Xuning and Stuerzlinger, Wolfgang and Wang, Yuntao and Liang, Hai-Ning},
booktitle = {Conference on Virtual Reality and {3D} User Interfaces},
publisher = {IEEE},
series = {VR '25},
year = {2025},
month = {Mar},
pages = {93-103},
doi = {https://doi.org/10.1109/VR59515.2025.00034},
pdf = {papers/predictingray.pdf},
teaser = {teasers/predictingray.png},
abstract = {Target selection is one of the most fundamental tasks in VR interaction systems. Prediction heuristics can provide users with a smoother interaction experience in this process. Our work aims to predict the ray landing pose for hand-based raycasting selection in Virtual Reality (VR) using a Long Short-Term Memory (LSTM)-based neural network with time-series data input of speed and distance over time from three different pose channels: hand, Head-Mounted Display (HMD), and eye. We first conducted a study to collect motion data from these three input channels and analyzed these movement behaviors. Additionally, we evaluated which combination of input modalities yields the optimal result. A second study validates raycasting across a continuous range of distances, angles, and target sizes. On average, our technique's predictions were within 4.6° of the true landing pose when 50% of the way through the movement. We compared our LSTM neural network model to a kinematic information model and further validated its generalizability in two ways: by training the model on one user's data and testing on other users (cross-user) and by training on a group of users and testing on entirely new users (unseen users). Compared to the baseline and a previous kinematic method, our model increased prediction accuracy by a factor of 3.5 and 1.9, respectively, when 40% of the way through the movement.},
keywords = {3D pointing, 3D selection, ray pointing},
}
@inproceedings{gemici2024speedcontrol,
title = {Object Speed Control Based on Signed Distance Field for Mid-Air Object Manipulation in Virtual Reality},
author = {Gemici*, Mucahit and Stuerzlinger, Wolfgang and Batmaz, Anil Ufuk},
booktitle = {International Symposium on Mixed and Augmented Reality},
publisher = {IEEE},
series = {ISMAR '24},
year = {2024},
month = {Oct},
pages = {465-474},
doi = {https://doi.org/10.1109/ISMAR62088.2024.00061},
pdf = {papers/speedcontrol.pdf},
video = {videos/speedcontrol.mp4},
teaser = {teasers/speedcontrol.png},
abstract = {In Virtual Reality (VR) applications, interacting with distant objects relies heavily on mid-air object manipulation. However, the inherent distance between the user and the object often restricts precise movement capabilities. This paper introduces the Signed Distance Field (SDF) algorithm as a method for mid-air object manipulation, and combines it with the ray casting interaction technique to investigate its effect on user performance and user experience. To increase the accuracy of the movements, we leverage the speed-accuracy trade-off to dynamically adjust object manipulation speed based on the SDF algorithm's output. Our study, involving 18 participants, examines the effects of SDF across three different tasks with different complexities. Our results showed that ray casting with SDF reduces the number of errors in complex tasks without slowing down the participants. Further, our proposed method significantly improved the user experience for complex tasks. We hope that our proposed assistive system, designed for tasks and applications, can be used as an interaction technique to enable more accurate manipulation of distant objects in the fields like surgical planning, architecture, and games.},
keywords = {3D manipulation, 3D posing, wire task},
}
@inproceedings{jiang2024flexdoc,
title = {FlexDoc: Flexible Document Adaptation through Optimizing both Content and Layout},
author = {Jiang*, Yue and Lutteroth, Christof and Jain, Rajiv and Tensmeyer, Christopher and Manjunatha, Varun and Stuerzlinger, Wolfgang and Morariu, Vlad},
booktitle = {Symposium on Visual Languages and Human-Centric Computing},
publisher = {IEEE},
series = {VL/HCC '24},
year = {2024},
month = {Sep},
pages={217-222},
doi = {https://doi.org/10.1109/VL/HCC60511.2024.00032},
pdf = {papers/flexdoc.pdf},
video = {videos/flexdoc.mp4},
teaser = {teasers/flexdoc.png},
abstract = {Designing adaptive documents that are visually appealing across various devices and for diverse viewers is a challenging task. This is due to the wide variety of devices and different viewer requirements and preferences. Alterations to a document’s content, style, or layout often necessitate numerous adjustments, potentially leading to a complete layout redesign. We introduce FLEXDOC, a framework for creating and consuming documents that seamlessly adapt to different devices, author, and viewer preferences and interactions. It eliminates the need for manually creating multiple document layouts, as FLEXDOC enables authors to define desired document properties using templates and employs both discrete and continuous optimization in a novel comprehensive optimization process, which leverages automatic text summarization and image carving techniques to adapt both layout and content during consumption dynamically. Further, we demonstrate FLEXDOC in real-world scenarios.},
keywords = {document layout, flexible documents, adaptive documents, responsive documents},
}
@inproceedings{kasahara2024steeringthroughput,
title = {Better Definition and Calculation of Throughput and Effective Parameters for Steering to Account for Subjective Speed-accuracy Tradeoffs},
author = {Kasahara*, Nobuhito and Oba*, Yosuke and Yamanaka, Shota and Batmaz, Anil Ufuk and Stuerzlinger, Wolfgang and Miyashita, Homei},
booktitle = {Conference on Human Factors in Computing Systems},
publisher = {ACM},
series = {CHI '24},
year = {2024},
month = {May},
articleno = {722},
pages = {1-18},
doi = {https://doi.org/10.1145/3613904.3642084},
pdf = {papers/steeringthroughput.pdf},
video = {videos/steeringthroughput.mp4},
teaser = {teasers/steeringthroughput.png},
abstract = {In Fitts' law studies to investigate pointing, throughput is used to characterize the performance of input devices and users, which is claimed to be independent of task difficulty or the user's subjective speed-accuracy bias.
While throughput has been recognized as a useful metric for target-pointing tasks, the corresponding formulation for path-steering tasks and its evaluation have not been thoroughly examined in the past. In this paper, we conducted three experiments using linear, circular, and sine-wave path shapes to propose and investigate a novel formulation for the effective parameters and the throughput of steering tasks. Our results show that the effective width substantially improves the fit to data with mixed speed-accuracy biases for all task shapes. Effective width also smoothed out the throughput across all biases, while the usefulness of the effective amplitude depended on the task shape. Our study thus advances the understanding of user performance in trajectory-based tasks.},
keywords = {steering, throughput},
}
@inproceedings{dash2024me911,
title = {Multimedia-Enabled 911: Exploring 911 Callers’ Experience of Call Taker Controlled Video Calling in Simulated Emergencies},
author = {Dash*, Punyashlok and Axtell, Benett and Geiskkovitch, Denise Y. and Neustaedter, Carman and Stuerzlinger, Wolfgang},
booktitle = {Conference on Human Factors in Computing Systems},
publisher = {ACM},
series = {CHI '24},
year = {2024},
month = {May},
articleno = {500},
pages = {1-15},
doi = {https://doi.org/10.1145/3613904.3643055},
pdf = {papers/me911.pdf},
video = {videos/me911.mp4},
teaser = {teasers/me911.png},
abstract = {Emergency response to large-scale disasters is often supported with multimedia from social media. However, while these features are common in everyday video calls, the complex needs of 911 and other systems make it difficult to directly incorporate these features. We assess an ME911 (Multimedia-Enabled 911) app to understand how the design will need to deviate from common norms and how callers will respond to those non-standard choices. We expand the role of 911 call taker control over emergency situations to the calling interface while incorporating key features like map-based location finding. Participants’ experiences in mock emergencies show the non-standard design helps callers in the unfamiliar setting of emergency calling yet it also causes confusion and delays. We find the need for emergency-specific deviations from design norms is supported by participant feedback. We discuss how broader system changes will support callers to use these non-standard designs during emergencies.},
keywords = {emergency, 911, video calling, teleconference, V4Space},
}
@inproceedings{yamanaka2024latencysteering,
title = {The Effect of Latency on Movement Time in Path-steering},
author = {Yamanaka, Shota and Stuerzlinger, Wolfgang},
booktitle = {Conference on Human Factors in Computing Systems},
publisher = {ACM},
series = {CHI '24},
year = {2024},
month = {May},
articleno = {622},
pages = {1-19},
doi = {https://doi.org/10.1145/3613904.3642316},
pdf = {papers/latencysteering.pdf},
video = {videos/latencysteering_application.mp4},
teaser = {teasers/latencysteering.png},
abstract = {In current graphical user interfaces, there exists a (typically unavoidable) end-to-end latency from each pointing-device movement to its corresponding cursor response on the screen, which is known to affect user performance in target selection, e.g., in terms of movement time (MTs). Previous work also reported that a long latency increases MTs in path-steering tasks, but the quantitative relationship between latency and MT had not been previously investigated for path-steering. In this work, we derive models to predict MTs for path-steering and evaluate them with five tasks: goal crossing as a preliminary task for model derivation, linear-path steering, circular-path steering, narrowing-path steering, and steering with target pointing. The results show that the proposed models yielded an adjusted R^2 > 0.94, with lower AICs and smaller cross-validation RMSEs than the baseline models, enabling more accurate prediction of MTs.},
keywords = {steering, latency},
}
@inproceedings{turkmen2024eyeconguide,
title = {EyeGuide & EyeConGuide: Gaze-based Visual Guides to Improve 3D Sketching Systems},
author = {Turkmen+, Rumeysa and Gelmez+, Zeynep Ecem and Batmaz, Anil Ufuk and Stuerzlinger, Wolfgang and Asente, Paul and Sarac, Mine and Pfeuffer, Ken and Barrera Machuca, Mayra Donaji},
booktitle = {Conference on Human Factors in Computing Systems},
publisher = {ACM},
series = {CHI '24},
year = {2024},
month = {May},
articleno = {178},
pages = {1-14},
doi = {https://doi.org/10.1145/3613904.3641947},
pdf = {papers/eyeconguide.pdf},
video = {videos/eyeconguide.mp4},
teaser = {teasers/eyeconguide.png},
abstract = {Visual guides in Virtual Reality sketching systems help to align strokes and raise accuracy. Guides that appear dynamically where one wants to draw have the potential to both lower the reliance on manual guide activation and improve the sketching experience. We propose novel guide techniques for sketching that exploit eye-tracking to modulate where a grid fragment appears. EyeGuide and EyeConGuide cause this grid fragment to appear spatially close to the user's intended sketches, with one relying on the user's eyes and the other on both the eyes and the hand location. In two user studies, we evaluated the techniques in basic and complex sketching tasks. The results show that gaze-based guides increased sketching accuracy compared to no guides, improved the system usability over manual activation, and were preferred by most users. Our research contributes highly usable techniques to assist accurate sketching and insights into multimodal gaze-contingent sketching.},
keywords = {eye tracking, gaze tracking, 3D sketching, 3D drawing},
}
@inproceedings{rind2024longitudinalehct,
title = {Eye-Hand Coordination Training: A Systematic Comparison of 2D, VR, and AR Screen Technologies and Task Motives},
author = {Rind*, Aliza and Zaugg+, Irene and Celik+, Elif and Stuerzlinger, Wolfgang and Ortega, Francisco and Batmaz, Anil Ufuk and Sarac, Mine},
booktitle = {Conference on Virtual Reality and {3D} User Interfaces},
publisher = {IEEE},
series = {VR '24},
year = {2024},
month = {Mar},
pages = {200-210},
doi = {https://doi.org/10.1109/VR58804.2024.00043},
pdf = {papers/longitudinalehct.pdf},
teaser = {teasers/longitudinalehct.png},
video = {videos/longitudinalehct.mp4},
abstract = {This study compares Augmented Reality (AR), Virtual Reality (VR), and 2D touchscreen approaches for eye-hand coordination training. We thoroughly analyze the motor performance of twenty participants throughout the course of a ten-session longitudinal study. Our study includes five different assessment criteria: speed, error rate, accuracy, precision, and none. We also analyze the participants' performance in terms of effective throughput as a novel evaluation criterion. The results showed that each task execution strategy has a different effect on one or more psychomotor characteristics of the trainee, which highlights the importance of the training program. We also showed that effective throughput is a candidate for monitoring the overall motor performance progress in eye-hand coordination training systems.},
keywords = {3D pointing, vergence-accomodation conflict, virtual hand},
}
@inproceedings{wagner2024taxivis,
title = {Reimagining TaxiVis through an Immersive Space-Time Cube Metaphor and Reflecting on Potential Benefits of Immersive Analytics for Urban Data Exploration},
author = {Wagner Filho*, Jorge and Silva, Claudio and Stuerzlinger, Wolfgang and Nedel, Luciana},
booktitle = {Conference on Virtual Reality and {3D} User Interfaces},
publisher = {IEEE},
series = {VR '24},
year = {2024},
month = {Mar},
pages = {827-838},
doi = {https://doi.org/10.1109/VR58804.2024.00102},
pdf = {papers/immersivetaxivis.pdf},
teaser = {teasers/immersivetaxivis.png},
video = {videos/immersivetaxivis.mp4},
url = {https://arxiv.org/abs/2402.00344},
abstract = {Recent studies suggest that immersion into 3D environments could increase the usability of 3D visualizations by facilitating 3D perception and easier interaction, and also better support collaboration between local or remote analysts. This is particularly relevant for domains with an obvious three-dimensional mapping, such as urban space-time data. To explore how a traditional visualization system could be adapted into an immersive framework, and how it could benefit from this, we decided to revisit a landmark paper presented ten years ago at IEEE VIS. TaxiVis, by Ferreira et al., enabled interactive spatial-temporal querying of a large dataset of taxi trips in New York City. Here, we reimagine how TaxiVis’ functionalities could be implemented and extended in a 3D immersive environment. Among the unique features we identify as being enabled by the Immersive TaxiVis prototype are alternative uses of the additional visual dimension, a fully-visual 3D spatio-temporal query framework, and the opportunity to explore the data at different scales and frames of reference. The intent behind our work is to complement and enhance established forms of visualization, not to replace them. Through reporting on our findings, and on the vision and reasoning behind our design decisions, we hope to contribute to the debate on how conventional and immersive visualization paradigms can help each other and also how the exploration of urban datasets can be facilitated in the coming years.},
keywords = {visual analytics, immersive analytics, space-time cube, 3D visualization, 3D interaction},
}
@inproceedings{batmaz2023gripstyle,
title = {Effect of Grip Style on Pointing in Head Mounted Displays},
author = {Batmaz, Anil Ufuk and Turkmen+, Rumeysa and Sarac, Mine and Barrera Machuca, Mayra Donaji and Stuerzlinger, Wolfgang},
booktitle = {International Symposium on Mixed and Augmented Reality},
publisher = {IEEE},
series = {ISMAR '23},
year = {2023},
month = {Oct},
pages = {425-433},
doi = {https://doi.org/10.1109/ISMAR59233.2023.00057},
pdf = {papers/gripstyle.pdf},
teaser = {teasers/gripstyle.png},
abstract = {When working in Virtual Reality (VR), the user's performance is affected by how the user holds the input device (e.g., controller), typically using either a precision or a power grip. Previous work examined these grip styles for 3D pointing at targets at different depths in peripersonal space. They found that participants had a lower error rate with the precision grip but no difference in movement speed, throughput, or interaction with target depth, but their experiment was potentially affected by tracking differences between devices. This paper reports an experiment that partially replicates and extends this study by evaluating the effect of grip style on the 3D selection of nearby targets with the same device. Furthermore, our experiment investigates the effect of the vergence-accommodation conflict (VAC) present in current stereo displays on 3D pointing in peripersonal space. Our results show that grip style significantly affects user performance. We hope that our results can guide developers, researchers, and designers when creating virtual environments.},
keywords = {3D pointing, vergence-accomodation conflict},
}
@inproceedings{batmaz2023reinvestigatingvac,
title = {Re-investigating the Effect of the Vergence-Accommodation Conflict on 3D Pointing},
author = {Batmaz, Anil Ufuk and Turkmen+, Rumeysa and Sarac, Mine and Barrera Machuca, Mayra Donaji and Stuerzlinger, Wolfgang},
booktitle = {29th Symposium on Virtual Reality Software and Technology},
publisher = {ACM},
series = {VRST '23},
year = {2023},
month = {Oct},
articleno = {8},
numpages = {10},
doi = {https://doi.org/10.1145/3611659.3615686},
pdf = {papers/reinvestigatingvac.pdf},
teaser = {teasers/reinvestigatingvac.png},
abstract = {The vergence-accommodation conflict (VAC) limits user performance in current Virtual Reality (VR) systems. In this paper, we investigate the effects of the VAC in a single focal VR system using three experimental conditions: with no VAC, with a constant VAC, and with a varying VAC. Previous work had yielded conflicting results, so we decided to re-investigate this issue. Eighteen participants performed an ISO 9241:411 task in a study that closely replicates previous work, except that the angle of the task space was rotated 20 degrees downward, to make the task less fatiguing to perform, which addresses a potential confound in previous work. We found that the varying VAC condition had worse performance than the other conditions, which indicates that the contrasting results in previous work were very likely due to biomechanical factors. We hope that our work contributes to the understanding of the influence of the VAC in VR systems and potential strategies for improving user experience and performance in immersive virtual environments.},
keywords = {3D pointing, vergence-accomodation conflict},
}
@inproceedings{han2023drseye,
title = {Dr.’s Eye: The Design and Evaluation of a Video Conferencing System to Support Doctor Appointments in Home Settings},
author = {Han*, Dongqi and Geiskkovitch, Denise Y. and Yuan, Ye and Mills*, Chelsea and Zhong*, Ce and Chen*, Amy Yo Sue and Stuerzlinger, Wolfgang and Neustaedter, Carman},
booktitle = {Conference on Human Factors in Computing Systems},
publisher = {ACM},
series = {CHI '23},
year = {2023},
month = {Apr},
articleno = {343},
numpages = {18},
doi = {https://doi.org/10.1145/3544548.3581350},
pdf = {papers/drseye.pdf},
video = {videos/drseye.mp4},
teaser = {teasers/drseye.png},
abstract = {The spread of COVID-19 has encouraged the practice of using video conferencing for family doctor appointments. Existing applications and devices face challenges in capturing the correct view of patients' bodies and supporting ease of use. We created Dr.’s Eye, a video conferencing prototype to support varying types of body exams in home settings. An exploratory study was conducted with patients in mock appointments to explore the use of our video system. Results show the benefits of providing more flexibility with a decoupled camera and display, and privacy protection by limiting the camera view. Yet, challenges remain in maneuvering two devices, presenting feedback of the camera view, coordinating camera work between the doctor and patient, and coping with discomfort in showing private body regions. This inspires future research on how to design a video system for doctor appointments.},
keywords = {teleconference, doctor},
}
@inproceedings{lee2023multiscaletransitions,
title = {Designing Viewpoint Transition Techniques in Multiscale Virtual Environments},
author = {Lee*, Jong-In and Asente, Paul and Stuerzlinger, Wolfgang},
booktitle = {Conference on Virtual Reality and {3D} User Interfaces},
publisher = {IEEE},
series = {VR '23},
year = {2023},
month = {Mar},
pages = {680-690},
doi = {https://doi.org/10.1109/VR55154.2023.00083},
pdf = {papers/multiscaletransitions.pdf},
video = {videos/multiscaletransitions.mp4},
teaser = {teasers/multiscaletransitions.png},
abstract = {Viewpoint transitions have been shown to improve users' spatial orientation and help them build a cognitive map when they are navigating an unfamiliar virtual environment. Previous work has investigated transitions in single-scale virtual environments, focusing on trajectories and continuity. We extend this work with an in-depth investigation of transition techniques in multiscale virtual environments (MVEs). We identify challenges in navigating MVEs with nested structures and assess how different transition techniques affect spatial understanding and usability. Through two user studies, we investigated transition trajectories, interactive control of transition movement, and speed modulation in a nested MVE. We show that some types of viewpoint transitions enhance users' spatial awareness and confidence in their spatial orientation and reduce the need to revisit a target point of interest multiple times.},
keywords = {3D navigation, multiscale virtual environment, transitions, speed control},
}
@inproceedings{batmaz2023virtualhandvac,
title = {Measuring the Effect of Stereo Deficiencies on Peripersonal Space Pointing},
author = {Batmaz, Anil Ufuk and Hudhud Mughrabi+, Moaaz and Sarac, Mine and Barrera Machuca, Mayra Donaji and Stuerzlinger, Wolfgang},
booktitle = {Conference on Virtual Reality and {3D} User Interfaces},
publisher = {IEEE},
series = {VR '23},
year = {2023},
month = {Mar},
pages = {1-11},
doi = {https://doi.org/10.1109/VR55154.2023.00063},
pdf = {papers/virtualhandvac.pdf},
teaser = {teasers/virtualhandvac.png},
abstract = {State-of-the-art Virtual Reality (VR) and Augmented Reality (AR) headsets rely on singlefocal stereo displays. For objects away from the focal plane, such displays create a vergence-accommodation conflict (VAC), potentially degrading user interaction performance. In this paper, we study how the VAC affects pointing at targets within arm's reach with virtual hand and raycasting interaction in current stereo display systems. We use a previously proposed experimental methodology that extends the ISO 9241-411:2015 multi-directional selection task to enable fair comparisons between selecting targets in different display conditions. We conducted a user study with eighteen participants and the results indicate that participants were faster and had higher throughput in the constant VAC condition with the virtual hand. We hope that our results enable designers to choose more efficient interaction methods in virtual environments.},
keywords = {3D pointing, vergence-accomodation conflict, virtual hand},
}
@inproceedings{shi2022groupalignment,
title = {Group-based Object Alignment in Virtual Reality Environments},
author = {Shi*, Rongkai and Zhang*, Jialin and Stuerzlinger, Wolfgang and Liang, Hai-Ning},
booktitle = {Symposium on Spatial User Interaction},
publisher = {ACM},
series = {SUI '22},
year = {2022},
month = {Dec},
articleno = {2},
numpages = {11},
doi = {https://doi.org/10.1145/3565970.3567682},
pdf = {papers/groupalign3D.pdf},
teaser = {teasers/groupalign3D.png},
abstract = {Group-based object alignment is an essential manipulation task, particularly for complex scenes. In conventional 2D user interfaces, such alignment tasks are generally achieved via a command/menu-based interface. Virtual reality (VR) head-mounted displays (HMDs) provide a rich immersive interaction experience, which opens more design options for group-based object alignment interaction techniques. However, object alignment techniques in immersive environments are underexplored. In this paper, we present four interaction techniques for 3 degrees-of-freedom translational alignments: AlignPanel, AlignWidget, AlignPin, and AlignGesture. We evaluated their performance, workload, and usability in a user study with 20 participants. Our results indicate different benefits and drawbacks of these techniques for group-based alignment in immersive systems. Based on the findings, we distill a set of design choices and recommendations for these techniques in various application scenarios.},
keywords = {3D positioning, 3D manipulation, alignment, 3D user interfaces},
}
@inproceedings{batmaz2022improvingperformance,
title = {Improving Effective Throughput Performance using Auditory Feedback in Virtual Reality Training Systems},
author = {Batmaz, Anil Ufuk and Yu*, Kangyou and Liang, Hai-Ning and Stuerzlinger, Wolfgang},
booktitle = {Symposium on Spatial User Interaction},
publisher = {ACM},
series = {SUI '22},
year = {2022},
month = {Dec},
articleno = {18},
numpages = {11},
doi = {https://doi.org/10.1145/3565970.3567702},
pdf = {papers/audiothroughput.pdf},
teaser = {teasers/audiothroughput.png},
abstract = {During the complex process of motor skill acquisition, novices might focus on different criteria, such as speed or accuracy, in their training. Previous research on virtual reality (VR) training systems has shown that effective throughput could also be used as such an assessment criterion. Effective throughput combines speed, accuracy, and precision into one measure, and can be influenced by auditory feedback. This paper investigates through a user study how to improve participants' effective throughput performance using auditory feedback. In the study, we mapped the speed and accuracy of the participants to the pitch of the auditory error feedback in an ISO 9241-411 multidirectional pointing task and evaluated participants' performance. The results showed it is possible to regulate the time or accuracy performance of the participants and thus the effective throughput. Based on the findings of our work, we also identify that effective throughput is an appropriate assessment criterion for VR training systems. We hope that our results can be used for VR training applications.},
keywords = {3D pointing, auditory feedback, training},
}
@inproceedings{batmaz2022stereodistal,
title = {Effect of Stereo Deficiencies on Virtual Distal Pointing},
author = {Batmaz, Anil Ufuk and Hudhud Mughrabi+, Moaaz and Barrera Machuca, Mayra Donaji and Stuerzlinger, Wolfgang},
booktitle = {28th Symposium on Virtual Reality Software and Technology},
publisher = {ACM},
series = {VRST '22},
year = {2022},
month = {Nov},
articleno = {12},
numpages = {8},
doi = {https://doi.org/10.1145/3562939.3565621},
pdf = {papers/vac_distal.pdf},
teaser = {teasers/vac_distal.png},
abstract = {Previous work has shown that the mismatch between disparity and optical focus cues, i.e., the vergence and accommodation conflict (VAC), affects virtual hand selection in immersive systems. To investigate if the VAC also affects distal pointing with ray casting, we ran a user study with an ISO 9241:411 multidirectional selection task where participants selected 3D targets with three different VAC conditions, no VAC, i.e., targets placed roughly at 75 cm, which matches the focal plane of the VR headset, constant VAC, i.e., at 400 cm from the user, and varying VAC, where the depth distance of targets changed between 75 cm and 400 cm. According to our results, the varying VAC condition requires the most time and decreases the throughput performance of the participants. It also takes longer for users to select targets in the constant VAC condition than without the VAC. Our results show that in distal pointing placing objects at different depth planes has detrimental effect on the user performance.},
keywords = {3D pointing, vergence-accomodation conflict, ray casting},
}
@inproceedings{mutasim2022performance,
title = {Performance Analysis of Saccades for Primary and Confirmatory Target Selection},
author = {Mutasim*, Aunnoy K and Batmaz, Anil Ufuk and Hudhud Mughrabi+, Moaaz and Stuerzlinger, Wolfgang},
booktitle = {28th Symposium on Virtual Reality Software and Technology},
publisher = {ACM},
series = {VRST '22},
year = {2022},
month = {Nov},
articleno = {18},
numpages = {12},
doi = {https://doi.org/10.1145/3562939.3565619},
pdf = {papers/saccadeconfirm.pdf},
video = {videos/saccadeconfirm.mp4},
teaser = {teasers/saccadeconfirm.png},
abstract = {In eye-gaze-based selection, dwell suffers from several issues, e.g., the Midas Touch problem. Here we investigate saccade-based selection techniques as an alternative to dwell. First, we designed a novel user interface (UI) for Actigaze and used it with (goal-crossing) saccades for confirming the selection of small targets (i.e., < 1.5-2°). We compared it with three other variants of Actigaze (with button press, dwell, and target reverse crossing) and two variants of target magnification (with button press and dwell). Magnification-dwell exhibited the most promising performance. Among Actigaze, goal-crossing was the fastest and achieved the highest throughput but suffered the most errors. We then evaluated goal-crossing as a primary selection technique for targets ≥ 2° and implemented a novel UI for such interaction. Results revealed that dwell achieved the best performance. Yet, we identified goal-crossing as a good compromise between dwell and button press. Our findings thus identify novel options for gaze-only interaction.},
keywords = {eye tracking, pointing, saccades},
}
@inproceedings{chidambaram2022editar,
title = {EditAR: A Digital Twin Authoring and Editing Environment for Creation of AR/VR and Video Instructions from a Single Demonstration},
author = {Chidambaram*, Subramanian and Reddy*, Sai Swarup and Rumple*, Matthew David and Ipsita*, Ananya and Villanueva*, Ana M and Redick, Thomas S and Stuerzlinger, Wolfgang and Ramani, Karthik},
booktitle = {International Symposium on Mixed and Augmented Reality},
publisher = {IEEE},
series = {ISMAR '22},
year = {2022},
month = {Oct},
pages = {326-335},
doi = {https://doi.org/10.1109/ISMAR55827.2022.00048},
pdf = {papers/editar.pdf},
video = {videos/editar.mp4},
teaser = {teasers/editar.png},
abstract = {Augmented/Virtual reality and video-based media play a vital role in the digital learning revolution to train novices in spatial tasks. However, creating content for these different media requires expertise in several fields. We present EditAR, a unified authoring and editing workflow to create content for AR, VR, and video with a single demonstration. EditAR captures the user’s interaction within an environment and creates a digital twin enabling users with no prior programming background to develop content. We conducted formative interviews with both subject and media experts to design the system. The prototype then developed was reviewed by experts. We also performed a comparative study on 2D video creation from 3D recordings, via a 3D editor, which uses freehand interaction for in-headset editing vs. traditional video creation. Users took 5x less time to record instructions and preferred EditAR in a qualitative survey, along with giving significantly higher usability scores.},
keywords = {augmented reality, 3d user interfaces, authoring, digital twin},
}
@inproceedings{alharbi2022autocucumber,
title = {Auto-Cucumber: The Impact of Autocorrection Failures on Users' Frustration},
author = {Alharbi*, Ohoud and Stuerzlinger, Wolfgang},
booktitle = {Graphics Interface},
series = {GI '22},
year = {2022},
month = {May},
articleno = {16},
pages = {148-160},
doi = {https://doi.org/10.20380/GI2022.16},
pdf = {papers/autocucumber.pdf},
commented-url = {https://openreview.net/forum?id=dcbsb4qTmnt},
teaser = {teasers/autocucumber.png},
abstract = {Many mobile users rely on autocorrection mechanisms during text entry on their smartphone. Previous studies investigated the effects of autocorrection mechanisms on typing speed and accuracy but did not explore the level of frustration and perceived mental workload often associated with autocorrection. In this paper, we investigate the effect of autocorrection failures on the user’s frustration, mental and physical demand, performance, and effort using a mixed-methods user study. We identified that perceived mental and physical demand, and frustration are directly affected by autocorrection.},
keywords = {text entry, autocorrect, errors, frustration},
}
@inproceedings{batmaz2022vacpointing,
title = {The Effect of the Vergence-Accommodation Conflict on Virtual Hand Pointing in Immersive Displays},
author = {Batmaz, Anil Ufuk and Barrera Machuca, Mayra D. and Sun, Junwei and Stuerzlinger, Wolfgang},
booktitle = {Conference on Human Factors in Computing Systems},
publisher = {ACM},
series = {CHI '22},
year = {2022},
month = {May},
articleno = {633},
numpages = {15},
doi = {https://doi.org/10.1145/3491102.3502067},
pdf = {papers/vacpointing.pdf},
video = {videos/vacpointing.mp4},
teaser = {teasers/vacpointing.png},
abstract = {Previous work hypothesized that for Virtual Reality (VR) and Augmented Reality (AR) displays a mismatch between disparities and optical focus cues, known as the vergence and accommodation conflict (VAC), affects depth perception and thus limits user performance in 3D selection tasks within arm’s reach (peri-personal space). To investigate this question, we built a multifocal stereo display, which can eliminate the influence of the VAC for pointing within the investigated distances. In a user study, participants performed a virtual hand 3D selection task with targets arranged laterally or along the line of sight, with and without a change in visual depth, in display conditions with and without the VAC. Our results show that the VAC influences 3D selection performance in common VR and AR stereo displays and that multifocal displays have a positive effect on 3D selection performance with a virtual hand.},
keywords = {3D pointing, vergence-accomodation conflict, immersive display system, multifocal display},
}
@inproceedings{hudhud2022jitter,
title = {My Eyes Hurt: Effects of Jitter in 3D Gaze Tracking},
author = {Hudhud Mughrabi+, Moaaz and Mutasim*, Aunnoy K and Stuerzlinger, Wolfgang and Batmaz, Anil Ufuk},
booktitle = {Conference on Virtual Reality and {3D} User Interfaces Abstracts and Workshops, Workshop on Novel Input Devices and Interaction Techniques at {VR}},
publisher = {IEEE},
series = {NIDIT '22},
year = {2022},
month = {Mar},
pages = {310-315},
doi = {https://doi.org/10.1109/VRW55335.2022.00070},
pdf = {papers/gazejitter.pdf},
abstract = {Jitter, small fluctuations in the signal, is one of the major sources for a decrease of motor performance and a negative user experience in virtual reality (VR) systems. Current technologies still cannot eliminate jitter in VR systems, especially in the eye-gaze tracking systems embedded in many head-mounted displays. In this work, we used an HTC Vive Pro Eye, artificially added 0.5°, 1°, and 1.5° jitter to the eye-tracking data, and analyzed user performance in a ISO 9241:411 pointing task with targets at 1 or 2 meters visual distance using angular Fitts’ law. The results showed that the user’s error rate significantly increases with increased jitter levels. No significant difference was observed for time and throughput. Additionally, we observed a significant decrease in terms of time, error rate, and throughput for the more distant targets. We hope that our results guide researcher, practitioners, and developers towards better gaze-tracking-based VR applications.},
keywords = {3D pointing, jitter, virtual reality},
}
@inproceedings{batmaz2021anchoring,
title = {When Anchoring Fails: Interactive Alignment of Large Virtual Objects in Occasionally Failing AR Systems},
author = {Batmaz, Anil Ufuk and Stuerzlinger, Wolfgang},
booktitle = {Future Technologies Conference},
publisher = {Springer},
series = {FTC '21},
year = {2021},
month = {Oct},
volume = {LNNS 358},
numpages = {13},
doi = {https://doi.org/10.1007/978-3-030-89906-6_4},
pdf = {papers/aranchoring.pdf},
teaser = {teasers/aranchoring.png},
abstract = {Augmented reality systems show virtual object models overlaid over real ones, which is helpful in many contexts, e.g., during maintenance. Assuming all geometry is known, misalignments in 3D poses will still occur without perfectly robust viewer and object 3D tracking. Such misalignments can impact the user experience and reduce the potential benefits associated with AR systems. In this paper, we implemented several interactive algorithms to make manual virtual object alignment easier, based on previously presented methods, such as HoverCam, SHOCam, and a Signed Distance Field. Our approach also simplifies the user interface for manual 3D pose alignment. The results of our work indicate that our approach can reduce the time needed for interactive 3D pose alignment, which improves the user experience.},
keywords = {augmented reality, 3D navigation, 3D orbiting, 3D tracking, anchoring},
}
@inproceedings{chakraborty2021vizinteract,
title = {VizInteract: Rapid Data Exploration through Multi-Touch Interaction with Multi-Dimensional Visualizations},
author = {Chakraborty*, Supratim and Stuerzlinger, Wolfgang},
booktitle = {Human-Computer Interaction},
publisher = {Springer},
series = {INTERACT '21},
year = {2021},
month = {Aug},
volume = {LNCS 12934},
pages = {610–632},
doi = {https://doi.org/10.1007/978-3-030-85613-7_39},
pdf = {papers/vizinteract.pdf},
url = {https://heysupratim.com/projects/vizinteract},
video = {videos/vizinteract.mp4},
teaser = {teasers/vizinteract.png},
abstract = {Creating and editing multi-dimensional data visualizations with current tools typically involves complex interactions. We present VizInteract, an interactive data visualization tool for touch-enabled displays. VizInteract supports efficient multi-touch data exploration through rapid construction of and interaction with multi-dimensional data visualizations. Building on primitive visualization idioms like histograms, VizInteract addresses the need for easy data exploration by facilitating the construction of multi-dimensional visualizations, such as scatter plots, parallel coordinate plots, radar charts, and scatter plot matrices, through simple multi-touch actions. Touch-based brushing-and-linking as well as attribute-based filter bubbles support “diving into the data” during analysis. We present the results of two explorative studies, one on a tablet and another on a large touchscreen and analyze the usage patterns that emerge while participants conducted visual analytics data exploration tasks in both conditions.},
keywords = {visual analytics, visualization, touch},
}
@inproceedings{chidambaram2021processar,
title = {ProcessAR: An augmented reality-based tool to create in-situ procedural 2D/3D AR Instructions},
author = {Chidambaram*, Subramanian and Huang*, Hank and He*, Fengming and Qian*, Xun and Villanueva*, Ana M and Redick, Thomas S and Stuerzlinger, Wolfgang and Ramani, Karthik},
booktitle = {Designing Interactive Systems},
publisher = {ACM},
series = {DIS '21},
year = {2021},
month = {Jun},
pages = {234-249},
doi = {https://doi.org/10.1145/3461778.3462126},
pdf = {papers/processar.pdf},
video = {videos/processar.mp4},
teaser = {teasers/processar.png},
abstract = {Augmented reality (AR) is an efficient form of delivering spatial information and has great potential for training workers. However, AR is still not widely used due to the technical skills, expertise, required to develop appropriate and interactive AR content. We developed ProcessAR, an AR-based system to develop 2D/3D content by capturing subject matter expert (SME) environment-object interactions, in situ. To enable smooth workflows, ProcessAR locates and identifies different tools/objects in the workspace where the author looks at them, by utilizing a computer vision algorithm. We explored additional features such as embedding 2D videos to detected objects and user-adaptive triggers. The design space for ProcessAR was identified from formative interviews with AR programming experts and SMEs, alongside a comparative design study with SMEs and novice users. A final user evaluation comparing ProcessAR and a baseline AR authoring environment studied, users rated ProcessAR as the better form on qualitative perceptional surveys.},
keywords = {augmented reality, mixed reality, AR authoring},
}
@inproceedings{mutasim2021pinchclickdwell,
title = {Pinch, Click, or Dwell: Comparing Different Selection Techniques for Eye-Gaze-Based Pointing in Virtual Reality},
author = {Mutasim*, Aunnoy K. and Batmaz, Anil Ufuk and Stuerzlinger, Wolfgang},
booktitle = {Symposium on Eye Tracking Research and Applications},
publisher = {ACM},
series = {ETRA '21},
year = {2021},
month = {May},
articleno = {15},
numpages = {7},
doi = {https://doi.org/10.1145/3448018.3457998},
pdf = {papers/pinchclickdwell.pdf},
teaser = {teasers/pinchclickdwell.png},
abstract = {While a pinch action is gaining popularity for selection/activation of virtual objects in eye-gaze-based systems, it is still unknown how well it performs compared to other popular alternatives, e.g., a button click or a dwell action. To determine pinch's performance in terms of execution time, error rate, and throughput, we implemented a Fitts' law task in Virtual Reality (VR) where the subjects pointed with their eye-gaze and selected/activated the targets by either pinch, clicking a button, or dwell. Results revealed that although pinch was slower, resulted in more errors, and had less throughput compared to button clicks, none of these differences between the two conditions were significant. Dwell exhibited the least errors but was significantly slower and achieved less throughput compared to the other conditions. Based on these findings, we conclude that the pinch gesture is a reasonable alternative to button clicks for eye-gaze-based VR systems.},
keywords = {eye tracking, selection, pointing},
}
@inproceedings{jiang2021reverseorc,
title = {{ReverseORC}: Reverse Engineering of Resizable User Interface Layouts with {OR}-Constraints},
author = {Jiang*, Yue and Stuerzlinger, Wolfgang and Lutteroth, Christof},
booktitle = {Conference on Human Factors in Computing Systems},
publisher = {ACM},
series = {CHI '21},
year = {2021},
month = {May},
articleno = {316},
numpages = {18},
doi = {https://doi.org/10.1145/3411764.3445043},
pdf = {papers/reverseorc.pdf},
url = {https://github.com/YueJiang-nj/ReverseORC-CHI2021},
video = {https://youtu.be/uBVRtUvLFSk},
teaser = {teasers/reverseorc.png},
abstract = {Reverse engineering (RE) of user interfaces (UIs) plays an important role in software evolution. However, the large diversity of UI technologies and the need for UIs to be resizable make this challenging.
We propose ReverseORC, a novel RE approach able to discover diverse layout types and their dynamic resizing behaviours independently of their implementation, and to specify them by using OR constraints. Unlike previous RE approaches, ReverseORC infers flexible layout constraint specifications by sampling UIs at different sizes and analyzing the differences between them. It can create specifications that replicate even some non-standard layout managers with complex dynamic layout behaviours. We demonstrate that ReverseORC works across different platforms with very different layout approaches, e.g., for GUIs as well as for the Web. Furthermore, it can be used to detect and fix problems in legacy UIs, extend UIs with enhanced layout behaviours, and support the creation of flexible UI layouts.},
keywords = {GUI, layout, constraints},
}
@inproceedings{batmaz2021pitch,
title = {The Effect of Pitch in Auditory Error Feedback for Fitts' Tasks in Virtual Reality Training Systems},
author = {Batmaz, Anil Ufuk and Stuerzlinger, Wolfgang},
booktitle = {Conference on Virtual Reality and {3D} User Interfaces},
publisher = {IEEE},
series = {VR '21},
year = {2021},
month = {Mar},
pages = {85-94},
doi = {https://doi.org/10.1109/VR50410.2021.00029},
pdf = {papers/pitchfeedback.pdf},
teaser = {teasers/pitchfeedback.png},
abstract = {Fitts' law and the associated throughput measure characterize user pointing performance in virtual reality (VR) training systems and simulators well. Yet, pointing performance can be affected by the feedback users receive from a VR application. This work examines the effect of the pitch of auditory error feedback on user performance in a Fitts' task through a distributed experiment. In our first study, we used middle- and high-frequency sound feedback and demonstrated that high-pitch error feedback significantly decreases user performance in terms of time and throughput. In the second study, we used adaptive sound feedback, where we increased the frequency with the error rate, while asking subjects to execute the task "as fast/as precise/as fast and precise as possible". Results showed that adaptive sound feedback decreases the error rate for "as fast as possible" task execution without affecting the time. The results can be used to enhance and design various VR systems.},
keywords = {3D pointing, feedback, augmented reality, touch},
}
@inproceedings{batmaz2021auditory,
title = {Effects of Different Auditory Feedback Frequencies in Virtual Reality {3D} Pointing Tasks},
author = {Batmaz, Anil Ufuk and Stuerzlinger, Wolfgang},
booktitle = {Conference on Virtual Reality and {3D} User Interfaces, Abstracts and Workshops, Workshop on Novel Input Devices and Interaction Techniques at {VR}},
publisher = {IEEE},
series = {NIDIT '21},
year = {2021},
month = {Mar},
pages = {189-194},
doi = {https://doi.org/10.1109/VRW52623.2021.00042},
pdf = {papers/auditoryfeedback.pdf},
abstract = {Auditory error feedback is commonly used in 3D Virtual Reality (VR) pointing experiments to increase participants' awareness of their misses. However, few papers describe the parameters of the auditory feedback, such as the frequency. In this study, we asked 15 participants to perform an ISO 9241-411 pointing task in a distributed remote experiment. In our study, we used three forms of auditory feedback, i.e., C4 (262 Hz), C8 (4186 Hz) and none. According to the results, we observed a speed-accuracy trade-off for the C8 tones compared to C4 ones: subjects were slower, and their throughput performance decreased with the C8 while their error rate decreased. Still, for larger targets there was no speed-accuracy trade-off, and subjects were only slower with C8 tones. Overall, the frequency of the feedback had a significant impact on the user's performance. We thus suggest that practitioners, developers, and designers report the frequency they used in their VR applications.},
keywords = {3D pointing, feedback, virtual reality},
}
@inproceedings{batmaz2020nojitter,
title = {No Jitter Please: Effects of Rotational and Positional Jitter on {3D} Mid-Air Interaction},
author = {Batmaz, Anil Ufuk and Rajabi Seraji*, Mohammad and Kneifel*, Johanna and Stuerzlinger, Wolfgang},
booktitle = {Future Technologies Conference},
publisher = {Springer},
series = {FTC '20},
year = {2020},
month = {Nov},
volume = {AISC 1289},
commented-volume = {2},
numpages = {16},
doi = {https://doi.org/10.1007/978-3-030-63089-8_52},
pdf = {papers/nojitter.pdf},
teaser = {teasers/nojitter.png},
abstract = {Virtual Reality (VR) 3D tracking systems are susceptible to minor fluctuations in signal (jitter). In this study, we explored how different levels of jitter affect user performance for 3D pointing. We designed a Fitts' Law experiment investigating target positional jitter and cursor rotational jitter at 3 different depth distances. Performance was negatively affected when up to ± 0.5° rotational jitter was applied to the controller and up to ± 0.375 cm positional jitter was applied to the target. At 2.25 m distance, user performance did not improve with decreasing positional jitter or rotational jitter compared to the no jitter condition. Our results can inform the design of 3D user interfaces, controllers, and interaction techniques in VR. Specifically, we suggest a focus on counteracting controller rotational jitter as this would globally increase performance for ray-based selection tasks.},
keywords = {3D pointing, mid-air, jitter},
}
@inproceedings{lee2020automatic,
title = {Evaluating Automatic Parameter Control Methods for Locomotion in Multiscale Virtual Environments},
author = {Lee*, Jong-In and Asente, Paul and Kim, Byungmoon and Kim, Yeojin and Stuerzlinger, Wolfgang},
booktitle = {26th Symposium on Virtual Reality Software and Technology},
publisher = {ACM},
series = {VRST '20},
year = {2020},
month = {Nov},
articleno = {11},
numpages = {10},
doi = {https://doi.org/10.1145/3385956.3418961},
pdf = {papers/navmultiscaleve.pdf},
video = {videos/navmultiscaleve.mp4},
teaser = {teasers/navmultiscaleve.png},
abstract = {Virtual environments with a wide range of scales are becoming commonplace in Virtual Reality applications. Methods to control locomotion parameters can help users explore such environments more easily. For multi-scale virtual environments, point-and-teleport locomotion with a well-designed distance control method can enable mid-air teleportation, which makes it competitive to flying interfaces. Yet, automatic distance control for point-and-teleport has not been studied in such environments. We present a new method to automatically control the distance for point-and-teleport. In our first user study, we used a solar system environment to compare three methods: automatic distance control for point-and-teleport, manual distance control for point-and-teleport, and automatic speed control for flying. Results showed that automatic control significantly reduces overshoot compared with manual control for point-and-teleport, but the discontinuous nature of teleportation made users prefer flying with automatic speed control. We conducted a second study to compare automatic-speed-controlled flying and two versions of our teleportation method with automatic distance control, one incorporating optical flow cues. We found that point-and-teleport with optical flow cues and automatic distance control was more accurate than flying with automatic speed control, and both were equally preferred to point-and-teleport without the cues.},
keywords = {3D navigation, multiscale virtual environment, teleportation, automatic distance, speed control},
}
@inproceedings{batmaz2020eyehand,
title = {Eye-Hand Coordination Training for Sports with Mid-air {VR}},
author = {Batmaz, Anil Ufuk and Sun*, Xintian and Taskiran, Dogu and Stuerzlinger, Wolfgang},
booktitle = {26th Symposium on Virtual Reality Software and Technology},
publisher = {ACM},
series = {VRST '20},
year = {2020},
month = {Nov},
articleno = {19},
numpages = {10},
doi = {https://doi.org/10.1145/3385956.3418971},
pdf = {papers/eyehandsports.pdf},
video = {videos/eyehandsports.mp4},
teaser = {teasers/eyehandsports.png},
abstract = {A relatively recent application area for Virtual Reality (VR) systems is sports training and user performance assessment. One of these applications is eye-hand coordination training systems (EHCTSs). Previous research identified that VR-based training systems have great potential for EHCTSs. While previous work investigated 3D targets on a 2D plane, here we aim to study full 3D movements and extend the application of throughput analysis to EHCTSs. We conducted two user studies to investigate how user performance is affected by different target arrangements, feedback conditions, and handedness in VR-based EHCTSs. In the first study, we explored handedness as well as vertical and horizontal target arrangements, and showed that user performance increases with the dominant hand and a vertical target plane. In the second study, we investigated different combinations of visual and haptic feedback and how they affect user performance with different target and cursor sizes. Results illustrate that haptic feedback did not increase user performance when it is added to visual feedback. Our results inform the creation of better EHCTSs with mid-air VR systems.},
keywords = {3D pointing, eye-hand coordination, sports training},
}
@inproceedings{jiang2020orcsolver,
title = {{ORCSolver}: An Efficient Solver for Adaptive {GUI} Layout with {OR}-Constraints},
author = {Jiang*, Yue and Stuerzlinger, Wolfgang and Zwicker, Matthias and Lutteroth, Christof},
booktitle = {Conference on Human Factors in Computing Systems},
publisher = {ACM},
series = {CHI '20},
year = {2020},
month = {Apr},
articleno = {483},
numpages = {14},
doi = {https://doi.org/10.1145/3313831.3376610},
url = {https://yuejiang-nj.github.io/papers/CHI2020_ORCSolver/project_page.html},
pdf = {papers/orcsolver.pdf},
video = {https://youtu.be/0S77vVG8btE},
teaser = {teasers/orcsolver.png},
abstract = {OR-constrained (ORC) graphical user interface layouts unify conventional constraint-based layouts with flow layouts, which enables the definition of flexible layouts that adapt to screens with different sizes, orientations, or aspect ratios with only a single layout specification. Unfortunately, solving ORC layouts with current solvers is time-consuming and the needed time increases exponentially with the number of widgets and constraints. To address this challenge, we propose ORCSolver, a novel solving technique for adaptive ORC layouts, based on a branch-and-bound approach with heuristic preprocessing. We demonstrate that ORCSolver simplifies ORC specifications at runtime and our approach can solve ORC layout specifications efficiently at near-interactive rates.},
keywords = {GUI, layout, constraints},
}
@inproceedings{putze2020eegautocorrect,
title = {Platform for Studying Self-Repairing Auto-Corrections in Mobile Text Entry Based on Brain Activity, Gaze, and Context},
author = {Putze, Felix and Ihrig*, Tilman and Schultz, Tanja and Stuerzlinger, Wolfgang},
booktitle = {Conference on Human Factors in Computing Systems},
publisher = {ACM},
series = {CHI '20},
year = {2020},
month = {Apr},
numpages = {13},
doi = {https://doi.org/10.1145/3313831.3376815},
pdf = {papers/eegautocorrect.pdf},
teaser = {teasers/eegautocorrect.png},
abstract = {Auto-correction is a standard feature of mobile text entry. While the performance of state-of-the-art auto-correct methods is usually relatively high, any errors that occur are cumbersome to repair, interrupt the flow of text entry, and challenge the user's agency over the process. In this paper, we describe a system that aims to automatically identify and repair auto-correction errors. This system comprises a multi-modal classifier for detecting auto-correction errors from brain activity, eye gaze, and context information, as well as a strategy to repair such errors by replacing the erroneous correction or suggesting alternatives. We integrated both parts in a generic Android component and thus present a research platform for studying self-repairing end-to-end systems. To demonstrate its feasibility, we performed a user study to evaluate the classification performance and usability of our approach.},
keywords = {autocorrect, EEG, errors, text entry},
}
@inproceedings{batmaz2020grip,
title = {Precision vs. Power Grip: A Comparison of Pen Grip Styles for Selection in Virtual Reality},
author = {Batmaz, Anil Ufuk and Mutasim*, Aunnoy K. and Stuerzlinger, Wolfgang},
booktitle = {Conference on Virtual Reality and {3D} User Interfaces, Abstracts and Workshops, Workshop on Novel Input Devices and Interaction Techniques at {VR}},
publisher = {IEEE},
series = {NIDIT '20},
year = {2020},
month = {Mar},
pages = {23-28},
doi = {https://doi.org/10.1109/VRW50115.2020.00012},
pdf = {papers/precisiongrip.pdf},
abstract = {While commercial Virtual Reality (VR) controllers are mostly designed to be held in a power grip, previous research showed that using pen-like devices with a precision grip can improve user performance for selection in VR, potentially even matching that achievable with a mouse. However, it is not known if the improvement is due to the grip style. In this work, 12 subjects performed a Fitts' task at 3 different depth conditions with a pen-like input device used in both a precision and power grip. Our results identify that the precision grip significantly improves user performance in VR through a significant reduction in error rate, but we did not observe a significant effect of the distance of targets from the user. We believe that our results are useful for designers and researchers to improve the usability of and user performance in VR systems.},
keywords = {3D pointing, grip},
}
@inproceedings{batmaz2020touch,
title = {Touch the Wall: Comparison of Virtual and Augmented Reality with Conventional {2D} Screen Eye-hand Coordination Training Systems},
author = {Batmaz, Anil Ufuk and Mutasim*, Aunnoy K. and Malekmakan*, Morteza and Sadr*, Elham and Stuerzlinger, Wolfgang},
booktitle = {Conference on Virtual Reality and {3D} User Interfaces},
publisher = {IEEE},
series = {VR '20},
year = {2020},
month = {Mar},
pages = {184-193},
doi = {https://doi.org/10.1109/VR46266.2020.1581205539914},
pdf = {papers/touchthewall.pdf},
teaser = {teasers/touchthewall.png},
abstract = {Previous research on eye-hand coordination training systems has investigated user performance on a wall, 2D touchscreens, and in Virtual Reality (VR). In this paper, we designed an eye-hand coordination reaction test to investigate and compare user performance in three different virtual environments (VEs) – VR, Augmented Reality (AR), and a 2D touchscreen. VR and AR conditions also included two feedback conditions – mid-air and passive haptics. Results showed that compared to AR, participants were significantly faster and made fewer errors both in 2D and VR. However, compared to VR and AR, throughput performance of the participants was significantly higher in the 2D touchscreen condition. No significant differences were found between the two feedback conditions. The results show the importance of assessing precision and accuracy in eye-hand coordination training and suggest that it is currently not advisable to use AR headsets in such systems.},
keywords = {3D pointing, eye-hand coordination, mid-air, passive haptics, augmented reality, touch},
}
@inproceedings{pham2019mightypen,
title = {Is the Pen Mightier than the Controller? A Comparison of Input Devices for Selection in Virtual and Augmented Reality},
author = {Pham*, Duc-Minh and Stuerzlinger, Wolfgang},
booktitle = {25th Symposium on Virtual Reality Software and Technology},
publisher = {ACM},
series = {VRST '19},
year = {2019},
month = {Nov},
articleno = {35},
numpages = {11},
doi = {https://doi.org/10.1145/3359996.3364264},
pdf = {papers/mightypen.pdf},
teaser = {teasers/mightypen.png},
abstract = {Controllers are currently the typical input device for commercial Virtual Reality (VR) systems. Yet, such controllers are not as efficient as other devices, including the mouse. This motivates us to investigate devices that substantially exceed the controller's performance, for both VR and Augmented Reality (AR) systems. We performed a user study to compare several input devices, including a mouse, controller, and a 3D pen-like device on a VR and AR pointing task. Our results show that the 3D pen significantly outperforms modern VR controllers in all evaluated measures and that it is comparable to the mouse. Participants also liked the 3D pen more than the controller. Finally, we show how 3D pen devices could be integrated into today's VR and AR systems.},
keywords = {3D pointing, input device},
}
@inproceedings{batmaz2019hittingwall,
title = {Hitting the Wall: Mid-Air Interaction for Eye-Hand Coordination},
author = {Batmaz, Anil Ufuk and Sun*, Xintian and Taskiran, Dogu and Stuerzlinger, Wolfgang},
booktitle = {25th Symposium on Virtual Reality Software and Technology},
publisher = {ACM},
series = {VRST '19},
year = {2019},
month = {Nov},
articleno = {30},
numpages = {5},
doi = {https://doi.org/10.1145/3359996.3364249},
pdf = {papers/hittingthewall.pdf},
video = {videos/hittingthewall.mp4},
teaser = {teasers/hittingthewall.png},
abstract = {Reaction time training systems are used to improve user performance. Until now, such setups use physical 2D flat surfaces, e.g., a 2D touch screen or buttons mounted on a wall. We designed and investigated a mid-air reaction time training system with an immersive virtual reality (VR) headset. 12 participants performed an eye-hand coordination reaction test in three conditions: both in mid-air with or without VR controller as well as with passive haptic feedback through hitting a soft-surface wall. We also altered target and cursor sizes and used a Fitts' law task to analyze user performance. According to the results, subjects were slower and their throughput was lower when they hit a solid surface to interact with virtual targets. Our results show that Fitts's model can be applied to these systems to measure and assess participant training.},
keywords = {3D pointing, mid-air, passive haptics, eye-hand coordination, augmented reality},
}
@inproceedings{machuca2019smart3dguides,
title = {{Smart3DGuides}: Making Unconstrained Immersive {3D} Drawing More Accurate},
author = {Barrera Machuca*, Mayra D. and Stuerzlinger, Wolfgang and Asente, Paul},
booktitle = {25th Symposium on Virtual Reality Software and Technology},
publisher = {ACM},
series = {VRST '19},
year = {2019},
month = {Nov},
articleno = {37},
numpages = {13},
doi = {https://doi.org/10.1145/3359996.3364254},
pdf = {papers/smart3dguides.pdf},
video = {videos/smart3dguides.mp4},
teaser = {teasers/smart3dguides.png},
abstract = {Most current commercial Virtual Reality (VR) drawing applications for creativity rely on freehand 3D drawing as their main interaction paradigm. However, the presence of the additional third dimension makes accurate freehand drawing challenging. Some systems address this problem by constraining or beautifying user strokes, which can be intrusive and can limit the expressivity of freehand drawing. In this paper, we evaluate the effectiveness of relying solely on visual guidance to increase overall drawing shape-likeness. We identified a set of common mistakes that users make while creating freehand strokes in VR and then designed a set of visual guides, the Smart3DGuides, which help users avoid these mistakes. We evaluated Smart3DGuides in two user studies, and our results show that non-constraining visual guides help users draw more accurately.},
keywords = {3D drawing, 3D sketching, 3D user interfaces, 3D modeling},
}
@inproceedings{pham2019hawkey,
title = {{HawKEY}: Efficient and Versatile Text Entry for Virtual Reality},
author = {Pham*, Duc-Minh and Stuerzlinger, Wolfgang},
booktitle = {25th Symposium on Virtual Reality Software and Technology},
publisher = {ACM},
series = {VRST '19},
year = {2019},
month = {Nov},
articleno = {21},
numpages = {11},
doi = {https://doi.org/10.1145/3359996.3364265},
pdf = {papers/hawkey.pdf},
teaser = {teasers/hawkey.png},
abstract = {Text entry is still a challenging task in modern Virtual Reality (VR) systems. The lack of efficient text entry methods limits the applications that can be used productively in VR. Previous work has addressed this issue through virtual keyboards or showing the physical keyboard in VR. While physical keyboards afford faster text entry, they usually require a seated user and an instrumented environment. We introduce a new keyboard, worn on a hawker's tray in front of the user, which affords a compact, simple, flexible, and efficient text entry solution for VR, without restricting physical movement. In our new video condition, we also show the keyboard only when the user is looking down at it. To evaluate our novel solution and to identify good keyboard visualizations, we ran a user study where we asked participants to enter both lowercase sentences as well as complex text while standing. The results show that text entry rates are affected negatively by simplistic keyboard visualization conditions and that our solution affords desktop text entry rates, even when standing.},
keywords = {3D user interfaces, text entry, augmented reality},
}
@inproceedings{sun2019sliding,
title = {Extended Sliding in Virtual Reality},
author = {Sun*, Junwei and Stuerzlinger, Wolfgang},
booktitle = {25th Symposium on Virtual Reality Software and Technology},
publisher = {ACM},
series = {VRST '19},
year = {2019},
month = {Nov},
articleno = {38},
numpages = {5},
doi = {https://doi.org/10.1145/3359996.3364251},
pdf = {papers/extendedsliding.pdf},
video = {videos/extendedsliding.mp4},
teaser = {teasers/extendedsliding.png},
abstract = {Although precise 3D positioning is not always necessary in virtual environments, it is still an important task for current and future applications of Virtual Reality (VR), including 3D modelling, engineering, and scientific applications. We focus on 3D positioning techniques in immersive environments that use a 6DOF controller as input device and present a new technique that improves 3D positioning performance in VR, in both speed and accuracy. Towards this goal, we adapted an extended sliding technique to VR systems with a controller as input device and compared it with previously presented 3DOF positioning techniques. The results showed that our new Extended VR Sliding technique significantly improved the accuracy for 3D positioning tasks, especially for targets in contact with the scene.},
keywords = {3D manipulation, 3D positioning, sliding},
}
@inproceedings{hayatpur2019planeraypoint,
title = {Plane, Ray, and Point: Enabling Precise Spatial Manipulations with Shape Constraints},
author = {Hayatpur+, Devamardeep and Heo, Seongkook and Xia, Haijun and Stuerzlinger, Wolfgang and Wigdor, Daniel},
booktitle = {32nd Annual Symposium on User Interface Software and Technology},
publisher = {ACM},
series = {UIST '19},
year = {2019},
month = {Oct},
pages = {1185–1195},
doi = {https://doi.org/10.1145/3332165.3347916},
pdf = {papers/planeraypoint.pdf},
video = {videos/planeraypoint.mp4},
teaser = {teasers/planeraypoint.png},
abstract = {We present Plane, Ray, and Point, a set of interaction techniques that utilizes shape constraints to enable quick and precise object alignment and manipulation in virtual reality. Users create the three types of shape constraints, Plane, Ray, and Point, by using symbolic gestures. The shape constraints are used like scaffoldings and limit and guide the movement of virtual objects that collide or intersect with them. The same set of gestures can be performed with the other hand, which allow users to further control the degrees of freedom for precise and constrained manipulation. The combination of shape constraints and bimanual gestures yield a rich set of interaction techniques to support object transformation. An exploratory study conducted with 3D design experts and novice users found the techniques to be useful in 3D scene design workflows and easy to learn and use.},
keywords = {3D manipulation},
}
@inproceedings{machuca2019spatial,
title = {The Effect of Spatial Ability on Immersive {3D} Drawing},
author = {Barrera Machuca*, Mayra D. and Stuerzlinger, Wolfgang and Asente, Paul},
booktitle = {Conference on Creativity and Cognition},
publisher = {ACM},
series = {C&C '19},
year = {2019},
month = {Jun},
pages = {173–186},
doi = {https://doi.org/10.1145/3325480.3325489},
pdf = {papers/drawingspatialability.pdf},
teaser = {teasers/drawingspatialability.png},
abstract = {Virtual Reality (VR) headsets have made immersive 3D drawing available to the general public. However, compared to 2D drawing, the presence of an additional dimension makes sketching in VR challenging, since creating precise strokes that are positioned as intended in all three dimensions imposes higher demands on the users' perception, motor and spatial skills. Another challenge users face is creating accurate shapes in which strokes are positioned correctly relative to previous ones, as they may need to use different views to plan their next hand movement. In this paper, we analyze the behaviours of users with different spatial abilities while drawing in VR. Our results indicate that there are different types of behaviours that affect different aspects of the sketches. We also found that the user's spatial ability affects the shape of the drawing, but not the line precision. Finally, we give recommendations for designing 3D drawing interfaces.},
keywords = {virtual reality, 3D sketching, 3D drawing, 3D modeling, spatial cognition},
}
@inproceedings{papoi20193dspeedcontrol,
title = {Improved Automatic Speed Control for {3D} Navigation},
author = {Papoi*, Domi and Stuerzlinger, Wolfgang},
booktitle = {Advances in Computer Graphics},
publisher = {Springer},
series = {CGI '19},
year = {2019},
month = {Jun},
volume = {LNCS 11542},
pages = {278-290},
doi = {https://doi.org/10.1007/978-3-030-22514-8_23},
pdf = {papers/navspeed.pdf},
video = {videos/navspeed.mp4},
teaser = {teasers/navspeed.png},
abstract = {As technology progresses, it is possible to increase the size and complexity of 3D virtual environments. Thus, we need deal with multiscale virtual environments today. Ideally, the user should be able to navigate such environments efficiently and robustly, which requires control of the user speed during navigation. Manual speed control across multiple scales of magnitude suffers from issues such as overshooting behaviors and introduces additional complexity. Most previously presented methods to automatically control the speed of navigation do not generalize well to environments with varying scales. We present an improved method to automatically control the speed of the user in 3D virtual environment navigation. The main benefit of our approach is that it automatically adapts the navigation speed in a manner that enables efficient navigation with maximum freedom, while still avoiding collisions. The results of a usability test show a significant reduction in completion time for a multi-scale navigation task.},
keywords = {3D navigation, speed control},
note = {Computer Graphics International},
}
@inproceedings{blum2019immersiveanalytics,
title = {Immersive Analytics Sensemaking on Different Platforms},
author = {Blum*, Sebastian and Cetin*, Gokhan and Stuerzlinger, Wolfgang},
booktitle = {Winter School of Computer Graphics},
series = {WSCG '19, CSRN 2902},
issn = {2464-4617},
year = {2019},
month = {Jan},
pages = {69-80},
url = {http://wscg.zcu.cz/DL/wscg_DL.htm},
doi = {https://doi.org/10.24132/CSRN.2019.2902.2.9},
pdf = {papers/VAonLHRD+VR.pdf},
teaser = {teasers/VAonLHRD+VR.png},
abstract = {In this work we investigated sensemaking activities on different immersive platforms. We observed user behaviours during a classification task on a very large wall-display system (experiment I) and in a modern Virtual Reality headset (experiment II). In experiment II, we also evaluated a condition with a VR headset with an extended field of view, through a sparse peripheral display. We evaluated the results across the two studies by analyzing quantitative and qualitative data, such as task completion time, number of classifications, followed strategies, and shape of clusters. The results showed differences in user behaviours between the different immersive platforms, i.e., the very large display wall and the VR headset. Even though quantitative data showed no significant differences, qualitatively, users used additional strategies on the wall-display, which hints at a deeper level of sensemaking compared to a VR Headset. The qualitative and quantitative results of the comparison between VR Headsets do not indicate that users perform differently with a VR Headset with an extended field of view.},
keywords = {immersive analytics, virtual reality, large display system, immersive display system, large display interaction, V4Space},
}
@inproceedings{alharbi2019wisetype,
title = {{WiseType}: A Tablet Keyboard with Color-Coded Visualization and Various Editing Options for Error Correction},
author = {Alharbi*, Ohoud and Arif, Ahmed Sabbir and Stuerzlinger, Wolfgang and Dunlop, Mark D. and Komninos, Andreas},
booktitle = {Graphics Interface},
series = {GI '19},
year = {2019},
month = {May},
articleno = {4},
numpages = {10},
doi = {https://doi.org/10.20380/GI2019.04},
pdf = {papers/wisetype.pdf},
video = {videos/wisetype.mp4},
teaser = {teasers/wisetype.png},
abstract = {To address the problem of improving text entry accuracy in mobile devices, we present a new tablet keyboard that offers both immediate and delayed feedback on language quality through auto-correction, prediction, and grammar checking. We combine different visual representations for grammar and spelling errors, accepted predictions, and auto-corrections. and also support interactive swiping/tapping features and improved interaction with previous errors, predictions, and auto-corrections. Additionally, we added smart error correction features to the system to decrease the overhead of correcting errors and to decrease the number of operations. We designed our new input method with an iterative user-centered approach through multiple pilots. We conducted a lab-based study with a refined experimental methodology and found that WiseType outperforms a standard keyboard in terms of text entry speed and error rate. The study shows that color-coded text background highlighting and underlining of potential mistakes in combination with fast correction methods can improve both writing speed and accuracy.},
keywords = {text entry, autocorrect, errors},
award = {This work received a Michael J Sweeney Best HCI Student Paper Award},
}
@inproceedings{sun2019selecting,
title = {Selecting and Sliding Hidden Objects in {3D} Desktop Environments},
author = {Sun*, Junwei and Stuerzlinger, Wolfgang},
booktitle = {Graphics Interface},
series = {GI '19},
year = {2019},
month = {May},
articleno = {8},
numpages = {8},
doi = {https://doi.org/10.20380/GI2019.08},
pdf = {papers/transparency.pdf},
video = {videos/transparency.mp4},
teaser = {teasers/transparency.png},
abstract = {Selecting and positioning objects in 3D space are fundamental tasks in 3D user interfaces. We present two new techniques to improve 3D selection and positioning. We first augment 3D user interfaces with a new technique that enables users to select objects that are hidden from the current viewpoint. This layer-based technique for selecting hidden objects works for arbitrary objects and scenes. We then also extend a mouse-based sliding technique to work even if the manipulated object is hidden behind other objects, by making the manipulated object always fully visible through a transparency mask during drag-and-drop positioning. Our user study shows that with the new techniques, users can easily select hidden objects and that sliding with transparency performs faster than the common 3D widgets technique.},
keywords = {3D manipulation, 3D positioning, sliding, transparency},
}
@inproceedings{machuca2019stereo,
title = {The Effect of Stereo Display Deficiencies on Virtual Hand Pointing},
author = {Barrera Machuca*, Mayra D. and Stuerzlinger, Wolfgang},
booktitle = {Conference on Human Factors in Computing Systems},
publisher = {ACM},
series = {CHI '19},
year = {2019},
month = {May},
articleno = {207},
numpages = {14},
doi = {https://doi.org/10.1145/3290605.3300437},
pdf = {papers/virtualhandfitts.pdf},
video = {videos/virtualhandfitts.mp4},
teaser = {teasers/virtualhandfitts.png},
abstract = {The limitations of stereo display systems affect depth perception, e.g., due to the vergence-accommodation conflict or diplopia. We performed three studies to understand how stereo display deficiencies impact 3D pointing for targets in front of a screen and close to the user, i.e., in peripersonal space. Our first two experiments compare movements with and without a change in visual depth for virtual respectively physical targets. Results indicate that selecting targets along the depth axis is slower and has less throughput for virtual targets, while physical pointing demonstrates the opposite result. We then propose a new 3D extension for Fitts' law that models the effect of stereo display deficiencies. Next, our third experiment verifies the model and measures more broadly how the change in visual depth between targets affects pointing performance in peripersonal space and confirms significant effects on time and throughput. Finally, we discuss implications for 3D user interface design.},
keywords = {3D pointing, mid-air, stereo},
}
@inproceedings{yamanaka2019lassomodel,
title = {Modeling Fully and Partially Constrained Lasso Movements in a Grid of Icons},
author = {Yamanaka, Shota and Stuerzlinger, Wolfgang},
booktitle = {Conference on Human Factors in Computing Systems},
publisher = {ACM},
series = {CHI '19},
year = {2019},
month = {May},
articleno = {120},
numpages = {12},
doi = {https://doi.org/10.1145/3290605.3300350},
pdf = {papers/gridlassomodel.pdf},
teaser = {teasers/gridlassomodel.png},
abstract = {Lassoing objects is a basic function in illustration software and presentation tools. Yet, for many common object arrangements lassoing is sometimes time-consuming to perform and requires precise pen operation. In this work, we studied lassoing movements in a grid of objects similar to icons. We propose a quantitative model to predict the time to lasso such objects depending on the margins between icons, their sizes, and layout, which all affect the number of stopping and crossing movements. Results of two experiments showed that our models predict fully and partially constrained movements with high accuracy. We also analyzed the speed profiles and pen stroke trajectories and identified deeper insights into user behaviors, such as that an unconstrained area can induce higher movement speeds even in preceding path segments.},
keywords = {lasso, steering, group selection},
}
@inproceedings{jiang2019orclayout,
title = {{ORC} Layout: Adaptive {GUI} Layout with {OR}-Constraints},
author = {Jiang*, Yue and Du*, Ruofei and Lutteroth, Christof and Stuerzlinger, Wolfgang},
booktitle = {Conference on Human Factors in Computing Systems},
publisher = {ACM},
series = {CHI '19},
year = {2019},
month = {May},
articleno = {413},
numpages = {12},
doi = {https://doi.org/10.1145/3290605.3300643},
pdf = {papers/orclayout.pdf},
video = {videos/orclayout.mp4},
teaser = {teasers/orclayout.png},
abstract = {We propose a novel approach for constraint-based graphical user interface (GUI) layout based on OR-constraints (ORC) in standard soft/hard linear constraint systems. ORC layout unifies grid layout and flow layout, supporting both their features as well as cases where grid and flow layouts individually fail. We describe ORC design patterns that enable designers to safely create flexible layouts that work across different screen sizes and orientations. We also present the ORC Editor, a GUI editor that enables designers to apply ORC in a safe and effective manner, mixing grid, flow and new ORC layout features as appropriate. We demonstrate that our prototype can adapt layouts to screens with different aspect ratios with only a single layout specification, easing the burden of GUI maintenance. Finally, we show that ORC specifications can be modified interactively and solved efficiently at runtime.},
keywords = {GUI, layout, constraints},
}
@inproceedings{kruijff2019flexurface,
title = {Multilayer Haptic Feedback for Pen-Based Tablet Interaction},
author = {Kruijff, Ernst and Biswas*, Saugata and Trepkowski*, Christina and Maiero*, Jens and Ghinea, George and Stuerzlinger, Wolfgang},
booktitle = {Conference on Human Factors in Computing Systems},
publisher = {ACM},
series = {CHI '19},
year = {2019},
month = {May},
articleno = {143},
numpages = {14},
doi = {https://doi.org/10.1145/3290605.3300373},
pdf = {papers/flexurface.pdf},
video = {videos/flexurface.mp4},
teaser = {teasers/flexurface.png},
abstract = {We present a novel, multilayer interaction approach that enables state transitions between spatially above-screen and 2D on-screen feedback layers. This approach supports the exploration of haptic features that are hard to simulate using rigid 2D screens. We accomplish this by adding a haptic layer above the screen that can be actuated and interacted with (pressed on) while the user interacts with on-screen content using pen input. The haptic layer provides variable firmness and contour feedback, while its membrane functionality affords additional tactile cues like texture feedback. Through two user studies, we look at how users can use the layer in haptic exploration tasks, showing that users can discriminate well between different firmness levels, and can perceive object contour characteristics. Demonstrated also through an art application, the results show the potential of multilayer feedback to extend on-screen feedback with additional widget, tool and surface properties, and for user guidance.},
keywords = {haptics, multilayer, pen},
}
@inproceedings{batmaz2019nidit,
title = {Effects of {3D} Rotational Jitter and Selection Methods on {3D} Pointing Tasks},
author = {Batmaz, Anil Ufuk and Stuerzlinger, Wolfgang},
booktitle = {Workshop on Novel Input Devices and Interaction Techniques at {VR}},
publisher = {IEEE},
series = {NIDIT '19},
year = {2019},
month = {Mar},
pages = {1687-1692},
doi = {https://doi.org/10.1109/VR.2019.8798038},
pdf = {papers/rotjitterselection.pdf},
abstract = {3D pointing is an integral part of Virtual Reality interaction. Typical pointing devices rely on 3D trackers and are thus subject to fluctuations in the reported pose, i.e., jitter. In this work, we explored how different levels of rotational jitter affect pointing performance and if different selection methods can mitigate the effects of jitter. Towards this, we designed a Fitts' Law experiment with three selection methods. In the first method, subjects used a single controller to position and select the object. In the second method, subjects used the controller in their dominant hand to point at objects and the trigger button of a second controller, held in their non-dominant hand, to select objects. Finally, subjects used the controller in their dominant hand to point the objects and pressed the space bar on a keyboard to select the object in the third condition. During the pointing task we added five different levels of jitter: no jitter, ±0.5°, ±1°, and ±2° uniform noise, as well as White Gaussian noise with 1° standard deviation. Results showed that the Gaussian noise and ±2° of jitters significantly reduced the throughput of the participants. Moreover, subjects made fewer errors when they performed the experiment with two controllers. Our results inform the design of 3D user interfaces, input devices and interaction techniques.},
keywords = {3D pointing, jitter},
}
@inproceedings{batmaz2019stereo,
title = {Do Head-Mounted Display Stereo Deficiencies Affect {3D} Pointing Tasks in {AR} and {VR}?},
author = {Batmaz, Anil Ufuk and Barrera Machuca*, Mayra D. and Pham*, Duc-Minh and Stuerzlinger, Wolfgang},
booktitle = {Conference on Virtual Reality and {3D} User Interfaces},
publisher = {IEEE},
series = {VR '19},
year = {2019},
month = {Mar},
pages = {585-592},
doi = {https://doi.org/10.1109/VR.2019.8797975},
pdf = {papers/virtualhandARVR.pdf},
video = {videos/virtualhandARVR.mp4},
teaser = {teasers/virtualhandARVR.png},
abstract = {Most AR and VR headsets use stereoscopic displays to show virtual objects in 3D. However, the limitations of current stereo display systems affect depth perception through conflicting depth cues, which then also affect virtual hand interaction in peri-personal space, i.e., within arm's reach. We performed a Fitts' law experiment to better understand the impact of stereo display deficiencies of AR and VR headsets on pointing at close-by targets arranged laterally or along the line of sight. According to our results, the movement direction and the corresponding change in target depth affect pointing time and throughput; subjects' movements towards/away from their head were slower and less accurate than their lateral movements (left/right). However, even though subjects moved faster in AR, we did not observe a significant difference for pointing performance between AR and VR headsets, which means that previously identified differences in depth perception between these platforms seem to have no strong effect on interaction. Our results also help 3D user interface designers understand how changes in target depth affect users' performance in different movement directions in AR and VR.},
keywords = {3D pointing, mid-air, stereo},
}
@inproceedings{marquardt2018audiotactile,
title = {Audio-Tactile Proximity Feedback for Enhancing {3D} Manipulation},
author = {Marquardt*, Alexander and Kruijff, Ernst and Trepkowski*, Christina and Maiero*, Jens and Schwandt, Andrea and Hinkenjann, André and Stuerzlinger, Wolfgang and Schöning, Johannes},
booktitle = {24th Symposium on Virtual Reality Software and Technology},
publisher = {ACM},
series = {VRST '18},
year = {2018},
month = {Nov},
articleno = {2},
numpages = {10},
doi = {https://doi.org/10.1145/3281505.3281525},
pdf = {papers/tactaproximity.pdf},
teaser = {teasers/tactaproximity.png},
abstract = {In presence of conflicting or ambiguous visual cues in complex scenes, performing 3D selection and manipulation tasks can be challenging. To improve motor planning and coordination, we explore audio-tactile cues to inform the user about the presence of objects in hand proximity, e.g., to avoid unwanted object penetrations. We do so through a novel glove-based tactile interface, enhanced by audio cues. Through two user studies, we illustrate that proximity guidance cues improve spatial awareness, hand motions, and collision avoidance behaviors, and show how proximity cues in combination with collision and friction cues can significantly improve performance.},
keywords = {haptics, tactile feedback, 3D manipulation},
}
@inproceedings{marquardt2018guidance,
title = {Tactile Hand Motion and Pose Guidance for {3D} Interaction},
author = {Marquardt*, Alexander and Maiero*, Jens and Kruijff, Ernst and Trepkowski*, Christina and Schwandt, Andrea and Hinkenjann, André and Schöning, Johannes and Stuerzlinger, Wolfgang},
booktitle = {24th Symposium on Virtual Reality Software and Technology},
publisher = {ACM},
series = {VRST '18},
year = {2018},
month = {Nov},
articleno = {3},
numpages = {10},
doi = {https://doi.org/10.1145/3281505.3281526},
pdf = {papers/tactaguide.pdf},
video = {videos/tactaguide.mp4},
teaser = {teasers/tactaguide.png},
abstract = {We present a novel forearm-and-glove tactile interface that can enhance 3D interaction by guiding hand motor planning and coordination. In particular, we aim to improve hand motion and pose actions related to selection and manipulation tasks. Through our user studies, we illustrate how tactile patterns can guide the user, by triggering hand pose and motion changes, for example to grasp (select) and manipulate (move) an object. We discuss the potential and limitations of the interface, and outline future work.},
keywords = {haptics, guidance, tactile feedback, 3D manipulation},
}
@inproceedings{cetin2018valarge,
title = {Visual Analytics on Large Displays: Exploring User Spatialization and How Size and Resolution Affect Task Performance},
author = {Cetin*, Gokhan and Stuerzlinger, Wolfgang and Dill, John},
booktitle = {Symposium on Big Data Visual Analytics},
publisher = {IEEE},
series = {BDVA '18},
year = {2018},
month = {Oct},
pages = {21-30},
doi = {https://doi.org/10.1109/BDVA.2018.8534027},
pdf = {papers/space2VA.pdf},
teaser = {teasers/space2VA.png},
abstract = {Large, high-resolution displays (LHRDs) have been shown to enable increased productivity over conventional monitors. Previous work has identified the benefits of LHRDs for Visual Analytics tasks, where the user is analyzing complex data sets. However, LHRDs are fundamentally different from desktop and mobile computing environments, presenting some unique usability challenges and opportunities, and need to be better understood. There is thus a need for additional studies to analyze the impact of LHRD size and display resolution on content spatialization strategies and Visual Analytics task performance. We present the results of two studies of the effects of physical display size and resolution on analytical task successes and also analyze how participants spatially cluster visual content in different display conditions. Overall, we found that navigation technique preferences differ significantly among users, that the wide range of observed spatialization types suggest several different analysis techniques are adopted, and that display size affects clustering task performance whereas display resolution does not.},
keywords = {visual analytics, visualization, large display system, large display interaction, V4Space},
}
@inproceedings{elmeseery2018dynspace,
title = {Multiple Workspaces in Visual Analytics},
author = {El Meseery*, Maha and Wu*, Yuyao and Stuerzlinger, Wolfgang},
booktitle = {Symposium on Big Data Visual Analytics},
publisher = {IEEE},
series = {BDVA '18},
year = {2018},
month = {Oct},
pages = {70-81},
doi = {https://doi.org/10.1109/BDVA.2018.8534019},
pdf = {papers/dynspace.pdf},
video = {videos/dynspace.mp4},
teaser = {teasers/dynspace.png},
abstract = {Exploratory visual analysis is an iterative process, where analysts often start from an overview of the data. Subsequently, they often pursue different hypotheses through multiple rounds of interaction and analysis. Commercial visualization packages support mostly a model with a single analysis path, where the system view represents only the final state of the users' current analysis. In this paper, we investigate the benefit of using multiple workspaces to support alternative analyses, enabling users to create different workspaces to pursue multiple analysis paths at the same time. We implemented a prototype for multiple workspaces using a multi-tab design in a visual analytics system. The results of our user studies show that multiple workspaces: enable analysts to work on concurrent tasks, work well for organizing an analysis, and make it easy to revisit previous parts of their work.},
keywords = {visual analytics, visualization, alternatives, scenarios},
}
@inproceedings{machuca2018multiplanes,
title = {Multiplanes: Assisted Freehand VR Sketching},
author = {Barrera Machuca*, Mayra D. and Asente, Paul and Lu*, Jingwan and Kim, Byungmoon and Stuerzlinger, Wolfgang},
booktitle = {Symposium on Spatial User Interaction},
publisher = {ACM},
series = {SUI '18},
year = {2018},
month = {Oct},
pages = {36-47},
doi = {https://doi.org/10.1145/3267782.3267786},
pdf = {papers/multiplanes.pdf},
video = {videos/multiplanes.mp4},
teaser = {teasers/multiplanes.png},
abstract = {The presence of a third dimension makes accurate drawing in virtual reality (VR) more challenging than 2D drawing. These challenges include higher demands on spatial cognition and motor skills, as well as the potential for mistakes caused by depth perception errors. We present Multiplanes, a VR drawing system that supports both the flexibility of freehand drawing and the ability to draw accurate shapes in 3D by affording both planar and beautified drawing. The system was designed to address the above-mentioned challenges. Multiplanes generates snapping planes and beautification trigger points based on previous and current strokes and the current controller pose. Based on geometrical relationships to previous strokes, beautification trigger points serve to guide the user to reach specific positions in space. The system also beautifies user's strokes based on the most probable intended shape while the user is drawing them. With Multiplanes, in contrast to other systems, users do not need to manually activate such guides, allowing them to focus on the creative process.},
keywords = {3D sketching, 3D drawing, 3D modeling, 3D user interfaces},
}
@inproceedings{sun2018comparing,
title = {Comparing Input Methods and Cursors for {3D} Positioning with Head-Mounted Displays},
author = {Sun*, Junwei and Stuerzlinger, Wolfgang and Riecke, Bernhard E.},
booktitle = {15th Symposium on Applied Perception},
publisher = {ACM},
series = {SAP '18},
year = {2018},
month = {Aug},
articleno = {8},
numpages = {8},
doi = {https://doi.org/10.1145/3225153.3225167},
pdf = {papers/input4VR.pdf},
teaser = {teasers/input4VR.png},
abstract = {Moving objects is an important task in 3D user interfaces. In this work, we focus on (precise) 3D object positioning in immersive virtual reality systems, especially head-mounted displays (HMDs). To evaluate input method performance for 3D positioning, we focus on an existing sliding algorithm, in which objects slide on any contact surface. Sliding enables rapid positioning of objects in 3D scenes on a desktop system but is yet to be evaluated in an immersive system. We performed a user study that compared the efficiency and accuracy of different input methods (mouse, hand-tracking, and trackpad) and cursor display conditions (stereo cursor and one-eyed cursor) for 3D positioning tasks with the HTC Vive. The results showed that the mouse outperformed hand-tracking and the trackpad, in terms of efficiency and accuracy. Stereo cursor and one-eyed cursor did not demonstrate a significant difference in performance, yet the stereo cursor condition was rated more favourable. For situations where the user is seated in immersive VR, the mouse is thus still the best input device for precise 3D positioning.},
keywords = {3D positioning, input device},
}
@inproceedings{yamanaka2018steering,
title = {Steering Through Successive Objects},
author = {Yamanaka*, Shota and Stuerzlinger, Wolfgang and Miyashita, Homei},
booktitle = {Conference on Human Factors in Computing Systems},
publisher = {ACM},
series = {CHI '18},
year = {2018},
month = {Apr},
articleno = {603},
numpages = {13},
doi = {https://doi.org/10.1145/3173574.3174177},
pdf = {papers/steervscross.pdf},
teaser = {teasers/steervscross.png},
abstract = {We investigate stroking motions through successive objects with styli. There are several promising models for stroking motions, such as crossing tasks, which require endpoint accuracy of a stroke, or steering tasks, which require continuous accuracy throughout the trajectory. However, a task requiring users to repeatedly steer through constrained path segments has never been studied, although such operations are needed in GUIs, e.g., for selecting icons or objects on illustration software through lassoing. We empirically confirmed that the interval, trajectory width, and obstacle size significantly affect the movement speed. Existing models can not accurately predict user performance in such tasks. We found several unexpected results such as that steering through denser objects sometimes required less times than expected. Speed profile analysis showed the reasons behind such behaviors, such as participants' anticipation strategies. We also discuss the applicability of exiting performance models and revisions.},
keywords = {steering, lasso, group selection},
}
@inproceedings{ortega2018wiggle,
title = {Pointing at Wiggle {3D} Displays},
author = {Ortega, Michael and Stuerzlinger, Wolfgang},
booktitle = {Conference on Virtual Reality and {3D} User Interfaces},
publisher = {IEEE},
series = {VR '18},
year = {2018},
month = {Mar},
pages = {335-340},
doi = {https://doi.org/10.1109/VR.2018.8447552},
pdf = {papers/wigglepoint.pdf},
video = {videos/wigglepoint.m4v},
teaser = {teasers/wigglepoint.png},
abstract = {This paper presents two new pointing techniques for wiggle 3D displays, which present the 2D projection of 3D content with automatic (rotatory) motion parallax. Standard pointing at targets in wiggle 3D displays is challenging as the content is constantly in motion. The two pointing techniques presented here take advantage of the cursor's current position or the user's gaze direction for collocating the wiggle rotation center and potential targets. We evaluate the performance of the pointing techniques with a novel methodology that integrates 3D distractors into the ISO-9241-9 standard task. The experimental results indicate that the new techniques are significantly more efficient than standard pointing techniques in wiggle 3D displays. Given that we observed no performance variation for different targets, our new techniques seem to negate any interaction performance penalties of wiggle 3D displays.},
keywords = {3D pointing},
}
@inproceedings{nguyenvo2018referenceframe,
title = {Simulated Reference Frame: A Cost-Effective Solution to Improve Spatial Orientation in {VR}},
author = {Nguyen-Vo*, Thinh and Riecke, Bernhard E. and Stuerzlinger, Wolfgang},
booktitle = {Conference on Virtual Reality and {3D} User Interfaces},
publisher = {IEEE},
series = {VR '18},
year = {2018},
month = {Mar},
pages = {415-422},
doi = {https://doi.org/10.1109/VR.2018.8446383},
pdf = {papers/spatialreferenceframe.pdf},
teaser = {teasers/spatialreferenceframe.png},
abstract = {Virtual Reality (VR) is increasingly used in spatial cognition research, as it offers high experimental control in naturalistic multimodal environments, which is hard to achieve in real-world settings. Although recent technological advances offer a high level of photorealism, locomotion in VR is still restricted because people might not perceive their self-motion as they would in the real world. This might be related to the inability to use embodied spatial orientation processes, which support automatic and obligatory updating of our spatial awareness. Previous research has identified the roles reference frames play in retaining spatial orientation. Here, we propose using visually overlaid rectangular boxes, simulating reference frames in VR, to provide users with a better insight into spatial direction in landmark-free virtual environments. The current mixed-method study investigated how different variations of the visually simulated reference frames might support people in a navigational search task. Performance results showed that the existence of a simulated reference frame yields significant effects on participants completion time and travel distance. Though a simulated CAVE translating with the navigator (one of the simulated reference frames) did not provide significant benefits, the simulated room (another simulated reference frame depicting a rest frame) significantly boosted user performance in the task as well as improved participants preference in the post-experiment evaluation. Results suggest that adding a visually simulated reference frame to VR applications might be a cost-effective solution to the spatial disorientation problem in VR.},
keywords = {3D navigation},
}
@inproceedings{tran2017virtualarm,
title = {Effects of Virtual Arm Representations on Interaction in Virtual Environments},
author = {Tran+, Tanh Quang and Shin*, HyunJu and Stuerzlinger, Wolfgang and Han, JungHyun},
booktitle = {23rd Symposium on Virtual Reality Software and Technology},
publisher = {ACM},
series = {VRST '17},
year = {2017},
month = {Nov},
articleno = {40},
numpages = {9},
doi = {https://doi.org/10.1145/3139131.3139149},
pdf = {papers/armrepresentation.pdf},
teaser = {teasers/armrepresentation.png},
abstract = {Many techniques for visualization and interaction that potentially increase user performance have been studied in the growing field of virtual reality. However, the effects of virtual-arm representations on users' performance and perception in selection tasks have not been studied before. This paper presents the results of a user study of three different representations of the virtual arm: "hand only," "hand+forearm," and "whole arm" which includes the upper arm. In addition to the representations' effects on performance and perception in selection tasks, we investigate how the users' performance changes depending on whether collisions with objects are allowed or not. The relationship between the virtual-arm representations and the senses of agency and ownership are also explored. Overall, we found that the "whole arm" condition performed worst.},
keywords = {3D pointing, presence},
}
@inproceedings{putze2017eeg,
title = {Automatic Classification of Auto-Correction Errors in Predictive Text Entry Based on {EEG} and Context Information},
author = {Putze, Felix and Schünemann*, Maik and Schultz, Tanja and Stuerzlinger, Wolfgang},
booktitle = {19th Conference on Multimodal Interaction},
publisher = {ACM},
series = {ICMI '17},
year = {2017},
month = {Nov},
pages = {137–145},
doi = {https://doi.org/10.1145/3136755.3136784},
pdf = {papers/classifyAutoCorrectEEG.pdf},
teaser = {teasers/classifyAutoCorrectEEG.png},
abstract = {State-of-the-art auto-correction methods for predictive text entry systems work reasonably well, but can never be perfect due to the properties of human language. We present an approach for the automatic detection of erroneous auto-corrections based on brain activity and text-entry-based context features. We describe an experiment and a new system for the classification of human reactions to auto-correction errors. We show how auto-correction errors can be detected with an average accuracy of 85%.},
keywords = {EEG, text entry, autocorrect, errors},
}
@inproceedings{zaman2017mace,
title = {{MACE}: A New Interface for Comparing and Editing of Multiple Alternative Documents for Generative Design},
author = {Zaman, Loutfouz and Stuerzlinger, Wolfgang and Neugebauer+, Christian},
booktitle = {Symposium on Document Engineering},
publisher = {ACM},
series = {DocEng '17},
year = {2017},
month = {Sep},
pages = {67–76},
doi = {https://doi.org/10.1145/3103010.3103013},
pdf = {papers/mace.pdf},
teaser = {teasers/mace.png},
abstract = {We present a new interface for interactive comparisons of more than two alternative documents in the context of a generative design system that uses generative data-flow networks defined via directed acyclic graphs. To better show differences between such networks, we emphasize added, deleted, (un)changed nodes and edges. We emphasize differences in the output as well as parameters using highlighting and enable post-hoc merging of the state of a parameter across a selected set of alternatives. To minimize visual clutter, we introduce new difference visualizations for selected nodes and alternatives using additive and subtractive encodings, which improve readability and keep visual clutter low. We analyzed similarities in networks from a set of alternative designs produced by architecture students and found that the number of similarities outweighs the differences, which motivates use of subtractive encoding. We ran a user study to evaluate the two main proposed difference visualization encodings and found that they are equally effective.},
keywords = {alternatives, difference visualization, design},
}
@inproceedings{zeidler2017automatic,
title = {Automatic Generation of User Interface Layouts for Alternative Screen Orientations},
author = {Zeidler*, Clemens and Weber, Gerald and Stuerzlinger, Wolfgang and Lutteroth, Christof},
booktitle = {Human-Computer Interaction},
publisher = {Springer},
series = {INTERACT '17},
year = {2017},
month = {Sep},
volume = {LNCS 10513},
pages = {13-35},
doi = {https://doi.org/10.1007/978-3-319-67744-6_2},
pdf = {papers/autoorientlayout.pdf},
video = {videos/autoorientlayout.mp4},
teaser = {teasers/autoorientlayout.png},
abstract = {Creating multiple layout alternatives for graphical user interfaces to accommodate different screen orientations for mobile devices is labor intensive. Here, we investigate how such layout alternatives can be generated automatically from an initial layout. Providing good layout alternatives can inspire developers in their design work and support them to create adaptive layouts. We performed an analysis of layout alternatives in existing apps and identified common real-world layout transformation patterns. Based on these patterns we developed a prototype that generates landscape and portrait layout alternatives for an initial layout. In general, there is a very large number of possibilities of how widgets can be rearranged. For this reason we developed a classification method to identify and evaluate "good" layout alternatives automatically. From this set of "good" layout alternatives, designers can choose suitable layouts for their applications. In a questionnaire study we verified that our method generates layout alternatives that appear well structured and are easy to use.},
keywords = {GUI, layout},
award = {This work received a Reviewer's Choice Award},
}
@inproceedings{bjerre2017predictive,
title = {Predictive Model for Group Selection Performance on Touch Devices},
author = {Bjerre+, Per and Christensen+, Allan and Pedersen+, Andreas Køllund and Pedersen+, Simon André and Stuerzlinger, Wolfgang and Stenholt, Rasmus},
booktitle = {Human-Computer Interaction, Interaction Contexts},
publisher = {Springer},
series = {HCI International '17},
year = {2017},
month = {Jul},
volume = {LNCS 10272},
pages = {142-161},
doi = {https://doi.org/10.1007/978-3-319-58077-7_12},
pdf = {papers/lazytouch.pdf},
teaser = {teasers/lazytouch.png},
abstract = {Users spend hours making selections with ineffective tools, we therefore examine selection methods for efficiency in various touch trials. In a preliminary study three alternative selection methods were identified, we compared these to a smart selection tool. The study showed that a single selection method was the fastest; however, when the amount of targets increased, a multiple selection tool became more efficient. A secondary study with more targets revealed similar results. We therefore examined the single selection method against traditional selection methods in a user study. The results reveal a model of the average action and time cost for all methods within the parameters of mental preparation and target addition. The study revealed that the most favored selection methods were a lasso and brush selection tool. The study provides evidence towards a predictive model of selection performance for multiple target selection trials.},
keywords = {group selection, touch},
}
@inproceedings{yamanaka2017steering,
title = {Steering Through Sequential Linear Path Segments},
author = {Yamanaka*, Shota and Stuerzlinger, Wolfgang and Miyashita, Homei},
booktitle = {Conference on Human Factors in Computing Systems},
publisher = {ACM},
series = {CHI '17},
year = {2017},
month = {May},
pages = {232–243},
doi = {https://doi.org/10.1145/3025453.3025836},
pdf = {papers/pathsequencesteering.pdf},
teaser = {teasers/pathsequencesteering.png},
abstract = {The steering law models human motor performance and has been verified to hold for a single linear and/or circular path. Some extensions investigated steering around corners. Yet, little is known about human performance in navigating joined linear paths, i.e., successions of path segments with different widths. Such operations appear in graphical user interface tasks, including lasso operations in illustration software. In this work, we conducted several experiments involving joined paths. The results show that users significantly changed their behavior, and that this strategy change can be predicted beforehand. A simple model summing the two indexes of difficulty (IDs) for each path predicts movement time well, but more sophisticated models were also evaluated. The best model in terms of both of R2 and AIC values includes the ID of the crossing operation to enter the second path.},
keywords = {steering, lasso, group selection},
}
@inproceedings{jang2017fatigue,
title = {Modeling Cumulative Arm Fatigue in Mid-Air Interaction Based on Perceived Exertion and Kinetics of Arm Motion},
author = {Jang*, Sujin and Stuerzlinger, Wolfgang and Ambike, Satyajit and Ramani, Karthik},
booktitle = {Conference on Human Factors in Computing Systems},
publisher = {ACM},
series = {CHI '17},
year = {2017},
month = {May},
pages = {3328–3339},
doi = {https://doi.org/10.1145/3025453.3025523},
url = {https://github.com/CDesignGitHub/Cumulative-Arm-Fatigue_CHI-2017},
pdf = {papers/cumulativearmfatigue.pdf},
teaser = {teasers/cumulativearmfatigue.png},
abstract = {Quantifying cumulative arm muscle fatigue is a critical factor in understanding, evaluating, and optimizing user experience during prolonged mid-air interaction. A reasonably accurate estimation of fatigue requires an estimate of an individual's strength. However, there is no easy-to-access method to measure individual strength to accommodate inter-individual differences. Furthermore, fatigue is influenced by both psychological and physiological factors, but no current HCI model provides good estimates of cumulative subjective fatigue. We present a new, simple method to estimate the maximum shoulder torque through a mid-air pointing task, which agrees with direct strength measurements. We then introduce a cumulative fatigue model informed by subjective and biomechanical measures. We evaluate the performance of the model in estimating cumulative subjective fatigue in mid-air interaction by performing multiple cross-validations and a comparison with an existing fatigue metric. Finally, we discuss the potential of our approach for real-time evaluation of subjective fatigue as well as future challenges.},
keywords = {fatigue, mid-air, model},
}
@inproceedings{yamanaka2017analysis,
title = {Analysis and Modeling of Steering Behavior of Connected Straight Paths},
author = {Yamanaka*, Shota and Stuerzlinger, Wolfgang and Miyashita, Homei},
booktitle = {Interaction},
year = {2017},
month = {Mar},
pages = {17-26},
url = {http://www.interaction-ipsj.org/proceedings/2017},
pdf = {papers/steeringanalysis.pdf},
teaser = {teasers/steeringanalysis.png},
commented-title = {Analysis and Modeling of the Operation of Steering a Connected Linear Route},
abstract = {The steering law models human motor performance and has been verified to hold for a single linear and/or circular path. Some extensions investigated steering around corners. Yet, little is known about human performance in navigating joined linear paths, i.e., successions of path segments with different widths, although such operations appear in our graphical user interface tasks, including lasso operations in illustration software. In this work, we conducted three experiments involving joined paths. The results showed that users significantly changed their behavior, and that that strategy change can be determined beforehand. A simple model summing the two indexes of difficulty (IDs) for each path was efficient to predict the time (R2 > 0.96), but more sophisticated models were also evaluated. The best model includes the ID of the crossing operation to enter the second path, in terms of both of R2 and AIC values.},
keywords = {steering, lasso, group selection},
award = {This work received a Best Paper Award},
note = {In Japanese},
}
@inproceedings{kim2016holostation,
title = {{HoloStation}: Augmented Visualization and Presentation},
author = {Kim*, Minju and Lee*, Jungjin and Stuerzlinger, Wolfgang and Wohn, Kwangyun},
booktitle = {{SIGGRAPH} {ASIA} Symposium on Visualization},
publisher = {ACM},
series = {SA Vis '16},
year = {2016},
month = {Dec},
articleno = {12},
numpages = {9},
doi = {https://doi.org/10.1145/3002151.3002161},
pdf = {papers/holostation.pdf},
teaser = {teasers/holostation.png},
abstract = {As much as stories need to be told, images need to be presented. Although visualizations are meant to be self-explanatory, often enhancing their expressive power by incorporating a certain degree of interactivity, visualized images today often fail to encourage the active engagement of the user/audience. In many cases, interactive interventions by a human presenter have the potential to drastically improve the engagement with visualization. Rather than just showing the content, the presenter then enhances information delivery, e.g., by providing the context of the visualization. In this paper, we propose a novel concept called augmented presentation in which the human presenter occupies the same physical space as the visualized information, thereby presenting and interacting with the visualized images seamlessly. Depending on the level of engagement the presenter's role may vary: from a simple storyteller to an augmented presenter who may be regarded as a part of the visualized entity. To further the development of the new idea of augmented presentation, we have designed, implemented, and user-tested a visualization system named HoloStation. The presenter is placed between two projection screens: the front one is half-mirrored and the rear one is a conventional wall screen. The 3D stereoscopic images are rendered to appear in-between, thereby creating a coherent 3D visualization space filled with digital information and the human presenter. We have conducted a controlled experiment to investigate the subjective level of immersion and engagement of the audience with HoloStation compared to the traditional presentation. Our results suggest that our new form of augmented presentation has a potential not only to enhance the quality of information presentation but also to enrich the user experience on visualizations.},
keywords = {stereo, display, augmented reality},
}
@inproceedings{waese2016rsvp,
title = {An Evaluation of Interaction Methods for Controlling RSVP Displays in Visual Search Tasks},
author = {Waese*, Jamie and Stuerzlinger, Wolfgang and Provart, Nicholas},
booktitle = {Symposium on Big Data Visual Analytics},
publisher = {IEEE},
series = {BDVA '16},
year = {2016},
month = {Nov},
pages = {1-8},
doi = {https://doi.org/10.1109/BDVA.2016.7787041},
pdf = {papers/rsvp.pdf},
teaser = {teasers/rsvp.png},
abstract = {Accurately identifying images with subtly varying features from a large set of similar images can be a challenging task. To succeed, viewers must perceive subtle differences between multiple nearly identical images and react appropriately. The Rapid Serial Visual Presentation (RSVP) display technique has the potential to improve performance as it exploits our ability to preattentively recognize differences between images when they are flashed on a screen in a rapid and serial manner. We compared the speed and accuracy of three RSVP interface methods ("Hover", "Slide Show" and "Velocity") against a traditional "Point & Click" non-RSVP interface to test whether an RSVP display improves performance in visual search tasks. In a follow-up study we compared "Hover" and "Velocity" RSVP interface methods against a "Small Multiples" non-RSVP interface to explore the interaction of interface type and target size on visual search tasks. We found the "Hover" RSVP interface to significantly reduce the time it takes to perform visual search tasks with no reduction in accuracy, regardless of the size of the search targets. Beyond the gene identification task tested here, these experiments inform the design of user interfaces for many other visual search tasks.},
keywords = {visual analytics, rsvp, visualization, search},
}
@inproceedings{sun2016depthpop,
title = {Shift-Sliding and Depth-Pop for {3D} Positioning},
author = {Sun*, Junwei and Stuerzlinger, Wolfgang and Shuralyov*, Dmitri},
booktitle = {Symposium on Spatial User Interaction},
publisher = {ACM},
series = {SUI '16},
year = {2016},
month = {Oct},
pages = {69-78},
doi = {https://doi.org/10.1145/2983310.2985748},
pdf = {papers/depthpop.pdf},
video = {videos/depthpop.mp4},
teaser = {teasers/depthpop.png},
abstract = {Moving objects is an important task in 3D user interfaces. We describe two new techniques for 3D positioning, designed for a mouse, but usable with other input devices. The techniques enable rapid, yet easy-to-use positioning of objects in 3D scenes. With sliding, the object follows the cursor and moves on the surfaces of the scene. Our techniques enable precise positioning of constrained objects. Sliding assumes that by default objects stay in contact with the scene's front surfaces, are always at least partially visible, and do not interpenetrate other objects. With our new Shift-Sliding method the user can override these default assumptions and lift objects into the air or make them collide with other objects. Shift-Sliding uses the local coordinate system of the surface that the object was last in contact with, which is a new form of context-dependent manipulation. We also present Depth-Pop, which maps mouse wheel actions to all object positions along the mouse ray, where the object meets the default assumptions for sliding. For efficiency, both methods use frame buffer techniques. Two user studies show that the new techniques significantly speed up common 3D positioning tasks.},
keywords = {3D manipulation, sliding, 3D positioning},
award = {This work received a Best Demonstration Award},
}
@inproceedings{brown2016inair,
title = {Exploring the Throughput Potential of In-Air Pointing},
author = {Brown*, Michelle A. and Stuerzlinger, Wolfgang},
booktitle = {18th International Conference on Human-Computer Interaction. Interaction Platforms and Techniques, Part {II}},
publisher = {Springer},
series = {HCI International '16},
year = {2016},
month = {Jul},
volume = {LNCS 9732},
pages = {13–24},
doi = {https://doi.org/10.1007/978-3-319-39516-6_2},
pdf = {papers/fingercast.pdf},
teaser = {teasers/fingercast.png},
abstract = {We present an analysis of how pointing performance in in-air un-instrumented pointing can be improved, towards throughput equal to the mouse. Pointing using a chopstick is found to achieve the highest average throughput, with 3.89 bps. This is a substantial improvement over using the finger to point at the screen. Two potential reasons for the throughput gap between chopstick and finger operation were explored: the natural curvature of human fingers and tracking issues that occurs when fingers bend toward the device. Yet, neither one of these factors seems to significantly affect throughput. Thus other, yet unexplored factors must be the cause. Lastly, the effect of unreliable click detection was also explored, as this also affects un-instrumented performance, and was found to have a linear effect.},
keywords = {mid-air, 3D pointing, errors},
}
@inproceedings{bjerre2016transition,
title = {Transition Times for Manipulation Tasks in Hybrid Interfaces},
author = {Christensen+, Allan and Pedersen+, Simon André and Bjerre+, Per and Pedersen+, Andreas Køllund and Stuerzlinger, Wolfgang},
booktitle = {18th International Conference on Human-Computer Interaction. Interaction Platforms and Techniques, Part {II}},
publisher = {Springer},
series = {HCI International '16},
year = {2016},
month = {Jul},
volume = {LNCS 9732},
pages = {138-150},
doi = {https://doi.org/10.1007/978-3-319-39516-6_13},
pdf = {papers/transitions.pdf},
teaser = {teasers/transitions.png},
abstract = {Compared to the mouse, uninstrumented in-air interaction has been shown to be slower and less precise for pointing. Yet, in-air input is preferable or advantageous in some interaction scenarios. Thus, we examine a three-device hybrid setup involving the mouse, keyboard, and a Leap Motion. We performed a user study to quantify the costs associated with transitioning between these interaction devices, while performing simple 2D manipulation tasks using the mouse and Leap Motion. We found that transitioning to and from the Leap Motion takes on average 0.87 s longer than those between the mouse and keyboard.},
keywords = {mid-air, 3D manipulation, 3D positioning},
}
@inproceedings{arif2016smartbackspace,
title = {Evaluation of a Smart-Restorable Backspace Technique to Facilitate Text Entry Error Correction},
author = {Arif, Ahmed Sabbir and Kim, Sunjun and Stuerzlinger, Wolfgang and Lee, Geehyuk and Mazalek, Ali},
booktitle = {Conference on Human Factors in Computing Systems},
publisher = {ACM},
series = {CHI '16},
year = {2016},
month = {Apr},
pages = {5151–5162},
doi = {https://doi.org/10.1145/2858036.2858407},
pdf = {papers/smartrestorablebackspace.pdf},
video = {videos/SmartRestorableBackspace.mp4},
teaser = {teasers/smartrestorablebackspace.png},
abstract = {We present a new smart-restorable backspace technique to facilitate correction of "overlooked" errors on touchscreen-based tablets. We conducted an empirical study to compare the new backspace technique with the conventional one. Results of the study revealed that the new technique improves the overall text entry performance, both in terms of speed and operations per character, by significantly reducing error correction efforts. In addition, results showed that most users preferred the new technique to the one they use on their tablets, and found it easy to learn and use. Most of them also felt that it improved their overall text entry performance, thus wanted to keep using it.},
keywords = {text entry, errors},
}
@inproceedings{chan2016microgestures,
title = {User Elicitation on Single-Hand Microgestures},
author = {Chan*, Edwin and Seyed*, Teddy and Stuerzlinger, Wolfgang and Yang, Xing-Dong and Maurer, Frank},
booktitle = {Conference on Human Factors in Computing Systems},
publisher = {ACM},
series = {CHI '16},
year = {2016},
month = {Apr},
pages = {3403–3414},
doi = {https://doi.org/10.1145/2858036.2858589},
pdf = {papers/singlehandmicrogestureelicitation.pdf},
teaser = {teasers/singlehandmicrogestureelicitation.png},
abstract = {Gestural interaction has become increasingly popular, as enabling technologies continue to transition from research to retail. The mobility of miniaturized (and invisible) technologies introduces new uses for gesture recognition. This paper investigates single-hand microgestures (SHMGs), detailed gestures in a small interaction space. SHMGs are suitable for the mobile and discrete nature of interactions for ubiquitous computing. However, there has been a lack of end-user input in the design of such gestures. We performed a user-elicitation study with 16 participants to determine their preferred gestures for a set of referents. We contribute an analysis of 1,632 gestures, the resulting gesture set, and prevalent conceptual themes amongst the elicited gestures. These themes provide a set of guidelines for gesture designers, while informing the designs of future studies. With the increase in hand-tracking and electronic devices in our surroundings, we see this as a starting point for designing gestures suitable to portable ubiquitous computing.},
keywords = {gesture recognition, gestures, elicitation, mid-air},
award = {This work received a Best Paper Honorable Mention Award},
}
@inproceedings{perteneder2016ambientlight,
title = {Glowworms and Fireflies: Ambient Light on Large Interactive Surfaces},
author = {Perteneder*, Florian and Grossauer*, Eva-Maria Beatrix and Leong*, Joanne and Stuerzlinger, Wolfgang and Haller, Michael},
booktitle = {Conference on Human Factors in Computing Systems},
publisher = {ACM},
series = {CHI '16},
year = {2016},
month = {Apr},
pages = {5849–5861},
doi = {https://doi.org/10.1145/2858036.2858524},
pdf = {papers/glowwormsfireflies.pdf},
video = {videos/glowworms.mp4},
teaser = {teasers/glowworms.png},
abstract = {Ambient light is starting to be commercially used to enhance the viewing experience for watching TV. We believe that ambient light can add value in meeting and control rooms that use large vertical interactive surfaces. Therefore, we equipped a large interactive whiteboard with a peripheral ambient light display and explored its utility for different scenarios by conducting two controlled experiments. In the first experiment, we investigated how ambient light can be used for peripheral notifications, and how perception is influenced by the user's position and the type of work they are engaged in. The second experiment investigated the utility of ambient light for off-screen visualization. We condense our findings into several design recommendations that we then applied to application scenarios to show the versatility and usefulness of ambient light for large surfaces.},
keywords = {ambient light, large display system},
}
@inproceedings{makonin2016mixedinitiative,
title = {Mixed-Initiative for Big Data: The Intersection of Human + Visual Analytics + Prediction},
author = {Makonin, Stephen and {McVeigh}+, Daniel and Stuerzlinger, Wolfgang and Tran*, Khoa and Popowich, Fred},
booktitle = {Hawaii International Conference on System Sciences},
publisher = {IEEE},
series = {HICSS '16},
year = {2016},
month = {Jan},
pages = {1427-1436},
doi = {https://doi.org/10.1109/HICSS.2016.181},
pdf = {papers/mixedinitiativesurvey.pdf},
teaser = {teasers/mixedinitiativesurvey.png},
abstract = {Existing surveys in visual analytics focus on the importance of the topic. However, many do not discuss the increasingly critical area of mixed-initiative systems. In this survey we discuss the importance of research in mixed-initiative systems and how it is different from visual analytics and other research fields. We present the conceptual architecture of a mixed-initiative visual analytics system (MIVAS) and the five key components that make up MIVASs (data wrangling, alternative discovery and comparison, parametric interaction, history tracking and exploration, and system agency and adaptation), which forms our main contribution. We compare and contrast different research that claims to be mixed-initiative against MIVASs and show how there is still a considerable amount of work that needs to be accomplished before any system can truly be mixed-initiative.},
keywords = {visual analytics, visualization, mixed initiative},
}
@inproceedings{strothoff2015pinsntouches,
title = {Pins 'n' Touches: An Interface for Tagging and Editing Complex Groups},
author = {Strothoff*, Sven and Stuerzlinger, Wolfgang and Hinrichs, Klaus},
booktitle = {Conference on Interactive Tabletops & Surfaces},
publisher = {ACM},
series = {ITS '15},
year = {2015},
month = {Nov},
pages = {191–200},
doi = {https://doi.org/10.1145/2817721.2817731},
pdf = {papers/pinsntouches.pdf},
video = {videos/pinsntouches.mp4},
teaser = {teasers/pinsntouches.png},
abstract = {Influenced by mouse/pen-based user interfaces, most touch-based object tagging techniques rely mostly on a single interaction point. Once objects are tagged, typically only individual object inclusions/exclusions are possible. Yet, for tagging larger groups with complex spatial layouts, more refinement may be necessary to achieve the desired result. We apply visual tag markers to objects to visualize their group association. Through a new multi-touch pin gesture that "pins" one or more objects "down" while tagging, our new interface is capable of efficiently grouping objects, as identified in our user studies.},
keywords = {touch, group selection},
}
@inproceedings{ortega2015shocam,
title = {{SHOCam}: A {3D} Orbiting Algorithm},
author = {Ortega, Michael and Stuerzlinger, Wolfgang and Scheurich*, Doug},
booktitle = {28th Annual Symposium on User Interface Software & Technology},
publisher = {ACM},
series = {UIST '15},
year = {2015},
month = {Nov},
pages = {119–128},
doi = {https://doi.org/10.1145/2807442.2807496},
pdf = {papers/shocam.pdf},
video = {videos/SHOcam.mp4},
teaser = {teasers/shocam.png},
abstract = {In this paper we describe a new orbiting algorithm, called SHOCam, which enables simple, safe and visually attractive control of a camera moving around 3D objects. Compared with existing methods, SHOCam provides a more consistent mapping between the user's interaction and the path of the camera by substantially reducing variability in both camera motion and look direction. Also, we present a new orbiting method that prevents the camera from penetrating object(s), making the visual feedback - and with it the user experience - more pleasing and also less error prone. Finally, we present new solutions for orbiting around multiple objects and multi-scale environments.},
keywords = {3D navigation, 3D orbiting},
}
@inproceedings{vuibert2015docking,
title = {Evaluation of Docking Task Performance Using Mid-Air Interaction Techniques},
author = {Vuibert*, Vanessa and Stuerzlinger, Wolfgang and Cooperstock, Jeremy R.},
booktitle = {3rd Symposium on Spatial User Interaction},
publisher = {ACM},
series = {SUI '15},
year = {2015},
month = {Aug},
pages = {44–52},
doi = {https://doi.org/10.1145/2788940.2788950},
pdf = {papers/midairdock.pdf},
teaser = {teasers/midairdock.png},
abstract = {Mid-air interaction has the potential to manipulate objects in 3D with more natural input mappings. We compared the performance attainable using various mid-air interaction methods with a mechanically constrained input device in a 6 degrees-of-freedom (DoF) docking task in both accuracy and completion time. We found that tangible mid-air input devices supported faster docking performance, while exhibiting accuracy close to that of constrained devices. Interaction with bare hands in mid-air achieved similar time performance and accuracy compared to the constrained device.},
keywords = {3D manipulation, 3D positioning, docking, mid-air},
}
@inproceedings{teather2015factors,
title = {Factors Affecting Mouse-Based {3D} Selection in Desktop {VR} Systems},
author = {Teather, Robert J. and Stuerzlinger, Wolfgang},
booktitle = {3rd Symposium on Spatial User Interaction},
publisher = {ACM},
series = {SUI '15},
year = {2015},
month = {Aug},
pages = {10–19},
doi = {https://doi.org/10.1145/2788940.2788946},
pdf = {papers/mousestereo.pdf},
video = {videos/mousestereo.mp4},
teaser = {teasers/mousestereo.png},
abstract = {We present two experiments on mouse-based point selection in a desktop virtual reality system using stereo display and head-tracking. To address potential issues of using a mouse cursor with stereo display, we also evaluate the impact of using a one-eyed (mono) cursor. While a one-eyed cursor visualization eliminates depth conflicts, recent work suggests it offers worse performance than stereo cursors, possibly due to eye discomfort. Our results indicate that presenting the cursor in stereo significantly reduces performance for targets at different depths. The one-eyed cursor eliminates this effect, offering better performance than both screen-plane and geometry-sliding cursors visualized in stereo. However, it also performed slightly worse than stereo cursors in situations without depth conflicts. Our study suggests that this difference is not due exclusively to the relative transparency of such a cursor, hence eye fatigue or similar may be responsible.},
keywords = {3D positioning, stereo},
}
@inproceedings{zaman2015gemni,
title = {{GEM-NI}: A System for Creating and Managing Alternatives In Generative Design},
author = {Zaman*, Loutfouz and Stuerzlinger, Wolfgang and Neugebauer+, Christian and Woodbury, Robert and Elkhaldi*, Maher and Shireen*, Naghmi and Terry, Michael},
booktitle = {33rd Annual ACM Conference on Human Factors in Computing Systems},
publisher = {ACM},
series = {CHI '15},
year = {2015},
month = {Apr},
pages = {1201–1210},
doi = {https://doi.org/10.1145/2702123.2702398},
pdf = {papers/gem-ni.pdf},
video = {videos/GEM-NI.m4v},
teaser = {teasers/gem-ni.png},
abstract = {We present GEM-NI - a graph-based generative-design tool that supports parallel exploration of alternative designs. Producing alternatives is a key feature of creative work, yet it is not strongly supported in most extant tools. GEM-NI enables various forms of exploration with alternatives such as parallel editing, recalling history, branching, merging, comparing, and Cartesian products of and for alternatives. Further, GEM-NI provides a modal graphical user interface and a design gallery, which both allow designers to control and manage their design exploration. We conducted an exploratory user study followed by in-depth one-on-one interviews with moderately and highly skills participants and obtained positive feedback for the system features, showing that GEM-NI supports creative design work well.},
keywords = {alternatives, design},
}
@inproceedings{pfeiffer2015emsfeedback,
title = {{3D} Virtual Hand Pointing with {EMS} and Vibration Feedback},
author = {Pfeiffer*, Max and Stuerzlinger, Wolfgang},
booktitle = {Symposium on {3D} User Interfaces},
publisher = {IEEE},
series = {3DUI '15},
year = {2015},
month = {Mar},
pages = {117-120},
doi = {https://doi.org/10.1109/3DUI.2015.7131735},
pdf = {papers/EMSfeedback.pdf},
teaser = {teasers/EMSfeedback.png},
abstract = {Pointing is one of the most basic interaction methods for 3D user interfaces. Previous work has shown that visual feedback improves such actions. Here we investigate if electrical muscle stimulation (EMS) and vibration is beneficial for 3D virtual hand pointing. In our experiment we used a 3D version of a Fitts' task to compare visual feedback, EMS, vibration, with no feedback. The results demonstrate that both EMS and vibration provide reasonable addition to visual feedback. We also found good user acceptance for both technologies.},
keywords = {3D pointing, haptics},
}
@inproceedings{arif2014pseudopressure,
title = {The Use of Pseudo Pressure in Authenticating Smartphone Users},
author = {Arif*, Ahmed Sabbir and Ali, Mazalek and Stuerzlinger, Wolfgang},
booktitle = {11th International Conference on Mobile and Ubiquitous Systems: Computing, Networking and Services},
publisher = {ICST},
series = {MOBIQUITOUS '14},
year = {2014},
month = {Dec},
pages = {151–160},
doi = {https://doi.org/10.4108/icst.mobiquitous.2014.257919},
pdf = {papers/pressureauthentication.pdf},
teaser = {teasers/pressureauthentication.png},
abstract = {In this article, we present a new user authentication technique for touchscreen-based smartphone users that augments pseudo touch pressure as an extra security measure to the conventional digit-lock technique. The new technique enhances security by offering more unique password combinations than the most popular ones, by making each password specific to its owner, and by reducing the threat of smudge attacks. A study comparing the new technique with the digit-lock technique showed that overall it is slower and more error-prone, but performs substantially better in short term. Also, most users felt more secure using it and wanted to use it dominantly on their smartphones. A second study confirmed that it does enhance security by making it relatively more resistant to smudge attacks and less vulnerable to situations where attackers are already in possession of users' passwords.},
keywords = {authentication, password, mobile device},
}
@inproceedings{teather2014visualaids,
title = {Visual Aids in {3D} Point Selection Experiments},
author = {Teather*, Robert J. and Stuerzlinger, Wolfgang},
booktitle = {2nd Symposium on Spatial User Interaction},
publisher = {ACM},
series = {SUI '14},
year = {2014},
month = {Oct},
pages = {127–136},
doi = {https://doi.org/10.1145/2659766.2659770},
pdf = {papers/visualaidspointing.pdf},
video = {videos/3DvisualAids.mp4},
teaser = {teasers/visualaidspointing.png},
abstract = {We present a study investigating the influence of visual aids on 3D point selection tasks. In a Fitts' law pointing experiment, we compared the effects of texturing, highlighting targets upon being touched, and the presence of support cylinders intended to eliminate floating targets. Results of the study indicate that texturing and support cylinders did not significantly influence performance. Enabling target highlighting increased movement speed, while decreasing error rate. Pointing throughput was unaffected by this speed-accuracy tradeoff. Highlighting also eliminated significant differences between selection coordinate depth deviation and the deviation in the two orthogonal axes.},
keywords = {3D pointing, stereo},
}
@inproceedings{brown2014performance,
title = {The Performance of Un-Instrumented in-Air Pointing},
author = {Brown*, Michelle A. and Stuerzlinger, Wolfgang and de Mendonça Filho+, Euclides José},
booktitle = {Graphics Interface},
series = {GI '14},
year = {2014},
month = {May},
pages = {59–66},
url = {https://dl.acm.org/doi/10.5555/2619648.2619659},
footnote = {https://graphicsinterface.org/proceedings/gi2014/gi2014-8},
pdf = {papers/inairpointing.pdf},
teaser = {teasers/inairpointing.png},
abstract = {We present an analysis of in-air finger and hand controlled object pointing and selection. The study used a tracking system that required no instrumentation on the user. We compared the performance of the two pointing methods with and without elbow stabilization and found that the method that yielded the best performance varied for each participant, such that there was no method that performed significantly better than all others. We also directly compared user performance between un-instrumented in-air pointing and the mouse. We found that the un-instrumented in-air pointing performed significantly worse, at less than 75% of mouse throughput. Yet, the larger range of applications for un-instrumented 3D hand tracking makes this technology still an attractive option for user interfaces.},
keywords = {3D pointing, mid-air},
}
@inproceedings{arif2014adaptation,
title = {User Adaptation to a Faulty Unistroke-Based Text Entry Technique by Switching to an Alternative Gesture Set},
author = {Arif*, Ahmed Sabbir and Stuerzlinger, Wolfgang},
booktitle = {Graphics Interface},
series = {GI '14},
year = {2014},
month = {May},
pages = {183–192},
url = {https://dl.acm.org/doi/10.5555/2619648.2619679},
footnote = {https://graphicsinterface.org/proceedings/gi2014/gi2014-24},
pdf = {papers/faultygestures.pdf},
teaser = {teasers/faultygestures.png},
abstract = {This article presents results of two user studies to investigate user adaptation to a faulty unistroke gesture recognizer of a text entry technique. The intent was to verify the hypothesis that users gradually adapt to a faulty gesture recognition technique' s misrecognition errors and that this adaptation rate is dependent on how frequently they occur. Results confirmed that users gradually adapt to misrecognition errors by replacing the error prone gestures with alternative ones, as available. Also, users adapt to a particular misrecognition error faster if it occurs more frequently than others.},
keywords = {errors, gesture recognition, adaptation},
}
@inproceedings{latoschik2014evaluation,
title = {On the Art of the Evaluation and Presentation of RIS-Engineering},
author = {Latoschik, Marc Erich and Stuerzlinger, Wolfgang},
booktitle = {Software Engineering and Architectures for Realtime Interactive Systems},
publisher = {IEEE},
series = {SEARIS '14},
year = {2014},
month = {Mar},
pages = {9-17},
doi = {https://doi.org/10.1109/SEARIS.2014.7152796},
pdf = {papers/rispresent.pdf},
teaser = {teasers/rispresent.png},
abstract = {This article analyses the tasks of presenting and evaluating relevant scientific research in the field of Real-time Interactive Systems (RIS), i.e., in areas such as Virtual, Mixed, and Augmented Reality (VR, MR, and AR) and advanced Human-Computer Interaction. It identifies different methods for a structured approach to the description and evaluation of systems and their properties, including commonly found best practices as well as dos and don'ts. The article is targeted at authors as well as reviewers to guide both groups in the presentation as well as the appraisal of system engineering work.},
keywords = {systems, evaluation, virtual reality, augmented reality},
}
@inproceedings{arif2013pseudopressure,
title = {Pseudo-Pressure Detection and Its Use in Predictive Text Entry on Touchscreens},
author = {Arif*, Ahmed Sabbir and Stuerzlinger, Wolfgang},
booktitle = {Australian Computer-Human Interaction Conference: Augmentation, Application, Innovation, Collaboration},
series = {OzCHI '13},
year = {2013},
month = {Nov},
pages = {383-392},
doi = {https://doi.org/10.1145/2541016.2541024},
pdf = {papers/pseudopressure.pdf},
teaser = {teasers/pseudopressure.png},
abstract = {In this article we first present a new hybrid technique that combines existing time- and touch-point-based approaches to simulate pressure detection on standard touchscreens. Results of two user studies show that the new hybrid technique can distinguish (at least) two pressure levels, where the first requires on average 1.04 N and the second 3.24 N force on the surface. Then, we present a novel pressure-based predictive text entry technique that utilizes our hybrid pressure detection to enable users to bypass incorrect predictions by applying extra pressure on the next key. For inputting short English phrases with 10% non-dictionary words a comparison with conventional text entry in a study showed that the new technique increases entry speed by 9% and decreases error rates by 25%. Also, most users (83%) favour the new technique.},
keywords = {text entry, pressure, touch},
award = {This work received a Best Paper Award},
}
@inproceedings{arif2013evaluation,
title = {Evaluation of a New Error Prevention Technique for Mobile Touchscreen Text Entry},
author = {Arif*, Ahmed Sabbir and Stuerzlinger, Wolfgang},
booktitle = {Australian Computer-Human Interaction Conference: Augmentation, Application, Innovation, Collaboration},
series = {OzCHI '13},
year = {2013},
month = {Nov},
pages = {397-400},
doi = {https://doi.org/10.1145/2541016.2541063},
pdf = {papers/textpressure.pdf},
teaser = {teasers/textpressure.png},
abstract = {This paper presents a new pressure-based error prevention technique for mobile touchscreen text entry. Two user studies were conducted to compare the new technique with a conventional virtual keyboard, one with novice and another with expert users. Results of the first user study showed that with practice the new technique significantly improves accuracy. Yet, no such indication was observed during the second study.},
keywords = {text entry, errors, pressure, touch},
}
@inproceedings{lindlbauer2013perceptual,
title = {Perceptual Grouping: Selection Assistance for Digital Sketching},
author = {Lindlbauer*, David and Haller, Michael and Hancock, Mark and Scott, Stacey and Stuerzlinger, Wolfgang},
booktitle = {Conference on Interactive Tabletops and Surfaces},
publisher = {ACM},
series = {ITS '13},
year = {2013},
month = {Oct},
pages = {51-60},
doi = {https://doi.org/10.1145/2512349.2512801},
pdf = {papers/suggero.pdf},
video = {videos/Suggero.mp4},
teaser = {teasers/suggero.png},
abstract = {Modifying a digital sketch may require multiple selections before a particular editing tool can be applied. Especially on large interactive surfaces, such interactions can be fatiguing. Accordingly, we propose a method, called Suggero, to facilitate the selection process of digital ink. Suggero identifies groups of perceptually related drawing objects. These "perceptual groups" are used to suggest possible extensions in response to a person's initial selection. Two studies were conducted. First, a background study investigated participant's expectations of such a selection assistance tool. Then, an empirical study compared the effectiveness of Suggero with an existing manual technique. The results revealed that Suggero required fewer pen interactions and less pen movement, suggesting that Suggero minimizes fatigue during digital sketching.},
keywords = {group selection},
}
@inproceedings{zeidler2013ale,
title = {The Auckland Layout Editor: An Improved {GUI} Layout Specification Process},
author = {Zeidler*, Clemens and Lutteroth, Christof and Stuerzlinger, Wolfgang and Weber, Gerald},
booktitle = {26th Annual Symposium on User Interface Software and Technology},
publisher = {ACM},
series = {UIST '13},
year = {2013},
month = {Oct},
pages = {343-352},
doi = {https://doi.org/10.1145/2501988.2502007},
pdf = {papers/layoutALE.pdf},
video = {videos/ALE.mp4},
teaser = {teasers/layoutALE.png},
abstract = {Layout managers are used to control the placement of widgets in graphical user interfaces (GUIs). Constraint-based layout managers are among the most powerful. However, they are also more complex and their layouts are prone to problems such as over-constrained specifications and widget overlap. This poses challenges for GUI builder tools, which ideally should address these issues automatically. We present a new GUI builder - the Auckland Layout Editor (ALE) - that addresses these challenges by enabling GUI designers to specify constraint-based layouts using simple, mouse-based operations. We give a detailed description of ALE's edit operations, which do not require direct constraint editing. ALE guarantees that all edit operations lead to sound specifications, ensuring solvable and non-overlapping layouts. To achieve that, we present a new algorithm that automatically generates the constraints necessary to keep a layout non-overlapping. Furthermore, we discuss how our innovations can be combined with manual constraint editing in a sound way. Finally, to aid designers in creating layouts with good resize behavior, we propose a novel automatic layout preview. This displays the layout at its minimum and in an enlarged size, which allows visualizing potential resize issues directly. All these features permit GUI developers to focus more on the overall UI design.},
keywords = {GUI, layout, constraints, GUI builder},
}
@inproceedings{zabramski2013easy,
title = {Easy vs Tricky: The Shape Effect in Tracing, Selecting, and Steering With Mouse, Stylus, and Touch},
author = {Zabramski*, Stanislaw and Shrestha*, Suman and Stuerzlinger, Wolfgang},
booktitle = {International Conference on Making Sense of Converging Media},
series = {MindTrek '13},
year = {2013},
month = {Oct},
pages = {99-103},
doi = {https://doi.org/10.1145/2523429.2523444},
pdf = {papers/shapeeffect.pdf},
teaser = {teasers/shapeeffect.png},
abstract = {This short paper is a work-in-progress report on an experimental comparison and evaluation of users' performance in four line-tracing tasks based on two shapes and performed with three input methods (mouse, stylus, and touch-input). The shapes' properties used in the study created the two classes of shapes: easy and hard to replicate. As expected these two classes had different impact on user's performance in each task tested (tracing, lasso selection, steering through narrow and wide tunnel). The results show that participants replicating the shapes using touch-input were the least accurate but were the fastest in comparison to the remaining input methods. The stylus was the least error-prone method and the mouse was the slowest device in drawing tasks (tracing and selection). The differences in error distances between the input methods were less pronounced in steering tasks but timing data showed that mouse was still the slowest one. While the time of replication did not differ between the two shapes tested, the differences between the errors participants made were significant for all tasks and input devices, and patterns of these differences were consistent between the shapes. These results confirm predictions from a previous study and show which shapes' properties can make their replication more difficult. The results can be used to design shapes that are easy to replicate, e.g., in surface-based gestural interaction.},
keywords = {steering, tracing, drawing},
}
@inproceedings{agarwal2013widgetlens,
title = {{WidgetLens}: A System for Adaptive Content Magnification of Widgets},
author = {Agarwal*, Bhavna and Stuerzlinger, Wolfgang},
booktitle = {27th International BCS Human Computer Interaction Conference},
series = {BCS-HCI '13},
year = {2013},
month = {Sep},
articleno = {2},
numpages = {10},
doi = {https://doi.org/10.14236/ewic/HCI2013.4},
pdf = {papers/widgetlens.pdf},
video = {videos/WidgetLensOLD.mp4},
teaser = {teasers/widgetlens.png},
abstract = {On displays with high pixel densities or on mobile devices and due to limitations in current graphical user interface toolkits, content can appear (too) small and be hard to interact with. We present WidgetLens, a novel adaptive widget magnification system, which improves access to and interaction with graphical user interfaces. It is designed for usage of unmodified applications on screens with high pixel densities, remote desktop scenarios, and may also address some situations with visual impairments. It includes a comprehensive set of adaptive magnification lenses for standard widgets, each adjusted to the properties of that type of widget. These lenses enable full interaction with content that appears too small. We also present several extensions.},
keywords = {GUI, widget, magnification, layout},
}
@inproceedings{zabramski2013didwemiss,
title = {Did We Miss Something? Correspondence Analysis of Usability Data},
author = {Zabramski*, Stanislaw and Stuerzlinger, Wolfgang},
booktitle = {Human-Computer Interaction},
publisher = {Springer},
series = {INTERACT '13},
year = {2013},
month = {Sep},
volume = {LNCS 8120},
pages = {272-279},
doi = {https://doi.org/10.1007/978-3-642-40498-6_20},
pdf = {papers/correspondenceanalysisshort.pdf},
teaser = {teasers/correspondenceanalysisshort.png},
abstract = {We have applied a multivariate exploratory technique called Correspondence Analysis (CA) to create and analyze a model of the dataset of experiment results. The dataset originates from a comparative usability study of tracing with the use of mouse, pen, and touch input and contains both categorical and continuous data – i.e. results of questionnaires and task measurements. CA allowed to visually and numerically assess the main variables in the dataset and how they interact with each other. In our study, pen input had the best measured performance and was preferred by the users. Touch input was the least accurate of all input methods tested but it was preferred by users over mouse especially in the conditions lacking of visual feedback of drawing. CA helped to detect that secondary effect even though it cannot be explained by the performance results alone. The importance of the influence of user's previous experience is also noted. We conclude that CA helped to identify all major phenomena known from previous studies but also was sensitive to minor and secondary effects, what makes it a well suited method to quickly evaluate usability data.},
keywords = {steering, drawing, steering},
}
@inproceedings{zeidler2013evaluating,
title = {Evaluating Direct Manipulation Operations for Constraint-based Layout},
author = {Zeidler*, Clemens and Lutteroth, Christof and Stuerzlinger, Wolfgang and Weber, Gerald},
booktitle = {Human-Computer Interaction},
publisher = {Springer},
series = {INTERACT '13},
year = {2013},
month = {Sep},
volume = {LNCS 8118},
pages = {513-529},
doi = {https://doi.org/10.1007/978-3-642-40480-1_35},
pdf = {papers/layoutALEstudy.pdf},
teaser = {teasers/layoutALEstudy.png},
abstract = {Layout managers are used to control the placement of widgets in graphical user interfaces (GUIs). Constraint-based layout managers are more powerful than other ones. However, they are also more complex and their layouts are prone to problems that usually require direct editing of constraints. Today, designers commonly use GUI builders to specify GUIs. The complexities of traditional approaches to constraint-based layouts pose challenges for GUI builders.We evaluate a novel GUI builder, the Auckland Layout Editor (ALE), which addresses these challenges by enabling GUI designers to specify constraint-based layouts via direct manipulation using simple, mouse-based operations. These operations hide the complexity of the constraint-based layout model, while giving designers access to its benefits.In a user evaluation we compared ALE with two other mainstream layout builders, a grid-based and a constraint-based one. The time taken to create realistic sample layouts with our builder was significantly shorter, and most participants preferred ALE's approach. The evaluation demonstrates that good usability for authoring constraint-based layouts is possible.},
keywords = {GUI, layout, constraints},
}
@inproceedings{bruder2013touching,
title = {Touching the Void Revisited: Analyses of Touch Behavior On and Above Tabletop Surfaces},
author = {Bruder*, Gerd and Steinicke, Frank and Stuerzlinger, Wolfgang},
booktitle = {Human-Computer Interaction},
publisher = {Springer},
series = {INTERACT '13},
year = {2013},
month = {Sep},
volume = {LNCS 8117},
pages = {278-296},
doi = {https://doi.org/10.1007/978-3-642-40483-2_19},
pdf = {papers/stereotouchobserv.pdf},
teaser = {teasers/stereotouchobserv.png},
abstract = {Recent developments in touch and display technologies made it possible to integrate touch-sensitive surfaces into stereoscopic three-dimensional (3D) displays. Although this combination provides a compelling user experience, interaction with stereoscopically displayed objects poses some fundamental challenges. If a user aims to select a 3D object, each eye sees a different perspective of the same scene. This results in two distinct projections on the display surface, which raises the question where users would touch in 3D or on the two-dimensional (2D) surface to indicate the selection. In this paper we analyze the relation between the 3D positions of stereoscopically displayed objects and the on- as well as off-surface touch areas. The results show that 2D touch interaction works better close to the screen but also that 3D interaction is more suitable beyond 10cm from the screen. Finally, we discuss implications for the development of future touch-sensitive interfaces with stereoscopic display.},
keywords = {3D pointing, mid-air, touch},
}
@inproceedings{scheurich2013onehanded,
title = {A One-Handed Multi-Touch Method for {3D} Rotations},
author = {Scheurich*, Doug and Stuerzlinger, Wolfgang},
booktitle = {Human-Computer Interaction},
publisher = {Springer},
series = {INTERACT '13},
year = {2013},
month = {Sep},
volume = {LNCS 8117},
pages = {56-69},
doi = {https://doi.org/10.1007/978-3-642-40483-2_4},
pdf = {papers/touchrot.pdf},
video = {videos/touchRot.mp4},
teaser = {teasers/touchrot.png},
abstract = {Rotating 3D objects is a difficult task. We present a new rotation technique based on collision-free "mating" to expedite 3D rotations. It is specifically designed for one-handed interaction on tablets or touchscreens. A user study found that our new technique decreased the time to rotate objects in 3D by more than 60% in situations where objects align. We found similar results when users translated and rotated objects in a 3D scene. Also, angle errors were 35% less with mating. In essence, our new rotation technique improves both the speed and accuracy of common 3D rotation tasks.},
keywords = {3D manipulation, touch},
}
@inproceedings{das2013unified,
title = {Unified Modeling of Proactive Interference and Memorization Effort: A New Mathematical Perspective Within {ACT-R} Theory},
author = {Das*, Arindam and Stuerzlinger, Wolfgang},
booktitle = {Annual Meeting of the Cognitive Science Society},
series = {CogSci '13},
isbn = {978-097683189-1},
year = {2013},
month = {Jul},
pages = {358-363},
url = {https://escholarship.org/uc/item/1p05s7db},
pdf = {papers/proactivememorymodel.pdf},
teaser = {teasers/proactivememorymodel.png},
abstract = {We parsimoniously model the effect of proactive interference and memorization effort in learning stable graphical layouts. We model the visual search cost, i.e. the number of distractors visually encoded while looking for a target item, as a reasonable surrogate of onscreen proactive interference. Further, we show that a novel quantity that we term "effort factor" is an acceptable estimate for comparing the memorization effort across different access cost of onscreen information during the early stages of practice.},
keywords = {text entry, learning},
}
@inproceedings{zabramski2013activity,
title = {Activity or Product? - Drawing and {HCI}},
author = {Zabramski*, Stanislaw and Stuerzlinger, Wolfgang},
booktitle = {International Conference on Multimedia, Interaction, Design and Innovation},
series = {MIDI '13},
year = {2013},
month = {Jun},
pages = {29-38},
doi = {https://doi.org/10.1145/2500342.2500346},
pdf = {papers/drawingactivity.pdf},
teaser = {teasers/drawingactivity.png},
abstract = {Drawing tasks are rarely addressed experimentally by the HCI community, and even then pointing, steering, or gesturing is promoted as an approach towards drawing. We critically analyze the status quo, propose an improved framework for task analysis, and give suggestions on how to perceive drawing task at a meta-level.},
keywords = {drawing, steering},
}
@comment{c, c={leave the "_stuerzlinger" in the ID to enable umlaut-free search!}}
@inproceedings{bruder_stuerzlinger2013totouch,
title = {To Touch or not to Touch? Comparing {2D} Touch and {3D} Mid-Air Interaction on Stereoscopic Tabletop Surfaces},
author = {Bruder*, Gerd and Steinicke, Frank and Stürzlinger, Wolfgang},
booktitle = {Symposium on Spatial User Interaction},
publisher = {ACM},
series = {SUI '13},
year = {2013},
month = {Jul},
pages = {9-16},
doi = {https://doi.org/10.1145/2491367.2491369},
pdf = {papers/2D3Dtouch.pdf},
video = {videos/stereoTouch.mp4},
teaser = {teasers/2D3Dtouch.png},
abstract = {Recent developments in touch and display technologies have laid the groundwork to combine touch-sensitive display systems with stereoscopic three-dimensional (3D) display. Although this combination provides a compelling user experience, interaction with objects stereoscopically displayed in front of the screen poses some fundamental challenges: Traditionally, touch-sensitive surfaces capture only direct contacts such that the user has to penetrate the visually perceived object to touch the 2D surface behind the object. Conversely, recent technologies support capturing finger positions in front of the display, enabling users to interact with intangible objects in mid-air 3D space. In this paper we perform a comparison between such 2D touch and 3D mid-air interactions in a Fitts' Law experiment for objects with varying stereoscopical parallax. The results show that the 2D touch technique is more efficient close to the screen, whereas for targets further away from the screen, 3D selection outperforms 2D touch. Based on the results, we present implications for the design and development of future touch-sensitive interfaces for stereoscopic displays.},
keywords = {3D pointing, touch, mid-air},
}
@inproceedings{teather2013pointing,
title = {Pointing at {3D} Target Projections with One-Eyed and Stereo Cursors},
author = {Teather*, Robert J. and Stuerzlinger, Wolfgang},
booktitle = {{SIGCHI} Conference on Human Factors in Computing Systems},
publisher = {ACM},
series = {CHI '13},
year = {2013},
month = {Apr},
pages = {159-168},
doi = {https://doi.org/10.1145/2470654.2470677},
pdf = {papers/stereocursor.pdf},
video = {videos/3DoneEyedCursor.mp4},
teaser = {teasers/stereocursor.png},
abstract = {We present a study of cursors for selecting 2D-projected 3D targets. We compared a stereo- and mono-rendered (one-eyed) cursor using two mouse-based and two remote pointing techniques in a 3D Fitts' law pointing experiment. The first experiment used targets at fixed depths. Results indicate that one-eyed cursors only improve screen-plane pointing techniques, and that constant target depth does not influence pointing throughput. A second experiment included pointing between targets at varying depths and used only "screen-plane" pointing techniques. Our results suggest that in the absence of stereo cue conflicts, screen-space projections of Fitts' law parameters (target size and distance) yield constant throughput despite target depth differences and produce better models of performance.},
keywords = {3D pointing, stereo},
}
@inproceedings{bruder2013effects,
title = {Effects of Visual Conflicts on {3D} Selection Task Performance in Stereoscopic Display Environments},
author = {Bruder*, Gerd and Steinicke, Frank and Stuerzlinger, Wolfgang},
booktitle = {Symposium on {3D} User Interfaces},
publisher = {IEEE},
series = {3DUI '13},
year = {2013},
month = {Mar},
pages = {115-118},
doi = {https://doi.org/10.1109/3DUI.2013.6550207},
pdf = {papers/offsettouch.pdf},
teaser = {teasers/offsettouch.png},
abstract = {Mid-air direct-touch interaction in stereoscopic display environments poses challenges to the design of 3D user interfaces. Not only is passive haptic feedback usually absent when selecting a virtual object displayed with positive or negative parallax relative to a display surface, but such setups also suffer from inherent visual conflicts, such as vergence/accommodation mismatches and double vision. In particular, if the user tries to select a virtual object with a finger or input device, either the virtual object or the user's finger will appear blurred, resulting in an ambiguity for selections that may significantly impact the user's performance. In this paper we evaluate the effect of visual conflicts for mid-air 3D selection performance within arm's reach on a stereoscopic table with a Fitts' Law experiment. We compare three different techniques with different levels of visual conflicts for selecting a virtual object: real hand, virtual offset cursor, and virtual offset hand. Our results show that the error rate is highest for the real hand condition and less for the virtual offset-based techniques. However, our results indicate that selections with the real hand resulted in the highest effective throughput of all conditions. This suggests that virtual offset-based techniques do not improve overall performance.},
keywords = {3D pointing, stereo},
}
@inproceedings{zabramski2012effect,
title = {The Effect of Shape Properties on Ad-hoc Shape Replication with Mouse, Pen, and Touch Input},
author = {Zabramski*, Stanislaw and Stuerzlinger, Wolfgang},
booktitle = {Proceeding of the 16th International Academic {MindTrek} Conference},
series = {MindTrek '12},
year = {2012},
month = {Oct},
pages = {275-278},
doi = {https://doi.org/10.1145/2393132.2393192},
pdf = {papers/shapereplication.pdf},
teaser = {teasers/shapereplication.png},
abstract = {This paper summarizes observations from four empirical studies focusing on shape replication with three input methods. The aim was to identify and assess how the components of several semi-randomly generated shapes influence how accurately untrained users can replicate each of these components. We found that the pen is the least and touch the most error-prone method when used for drawing. Additionally, the distribution of errors was analyzed. The results may be used to predict which shape properties make shape replication more difficult. Additionally, the results may be used to design shapes that are easy to replicate.},
keywords = {steering, drawing},
}
@inproceedings{liang20123dmanipulation,
title = {User-defined Surface+Motion Gestures for {3D} Manipulation of Objects at a Distance Through a Mobile Device},
author = {Liang, Hai-Ning and Williams*, Cary and Semegen, Myron and Stuerzlinger, Wolfgang and Irani, Pourang},
booktitle = {10th Asia Pacific Conference on Computer Human Unteraction},
series = {APCHI '12},
year = {2012},
month = {Aug},
pages = {299-308},
doi = {https://doi.org/10.1145/2350046.2350098},
pdf = {papers/dualsurface.pdf},
teaser = {teasers/dualsurface.png},
abstract = {One form of input for interacting with large shared surfaces is through mobile devices. These personal devices provide interactive displays as well as numerous sensors to effectuate gestures for input. We examine the possibility of using surface and motion gestures on mobile devices for interacting with 3D objects on large surfaces. If effective use of such devices is possible over large displays, then users can collaborate and carry out complex 3D manipulation tasks, which are not trivial to do. In an attempt to generate design guidelines for this type of interaction, we conducted a guessability study with a dual-surface concept device, which provides users access to information through both its front and back. We elicited a set of end-user surface- and motion-based gestures. Based on our results, we demonstrate reasonably good agreement between gestures for choice of sensory (i.e. tilt), multi-touch and dual-surface input. In this paper we report the results of the guessability study and the design of the gesture-based interface for 3D manipulation.},
keywords = {3D manipulation, touch},
}
@inproceedings{arif2011extending,
title = {Extending Mobile User Ambient Awareness for Nomadic Text Entry},
author = {Arif*, Ahmed Sabbir and Iltisberger+, Benedikt and Stuerzlinger, Wolfgang},
booktitle = {Australian Computer-Human Interaction Conference},
series = {OzCHI '11},
year = {2011},
month = {Nov},
pages = {21-30},
doi = {https://doi.org/10.1145/2071536.2071539},
pdf = {papers/nomadictextentry.pdf},
teaser = {teasers/nomadictextentry.png},
abstract = {Nowadays, we input text not only on stationary devices, but also on handheld devices while walking, driving, or commuting. Text entry on the move, which we term as nomadic text entry, is generally slower. This is partially due to the need for users to move their visual focus from the device to their surroundings for navigational purposes and back. To investigate if better feedback about users' surroundings on the device can improve performance, we present a number of new and existing feedback systems: textual, visual, textual & visual, and textual & visual via translucent keyboard. Experimental comparisons between the conventional and these techniques established that increased ambient awareness for mobile users enhances nomadic text entry performance. Results showed that the textual and the textual & visual via translucent keyboard conditions increased text entry speed by 14% and 11%, respectively, and reduced the error rate by 13% compared to the regular technique. The two methods also significantly reduced the number of collisions with obstacles.},
keywords = {text entry, mobile device, awareness},
}
@inproceedings{patel2011simulation,
title = {Simulation of a Virtual Reality Tracking System},
author = {Patel+, Kapil and Stuerzlinger, Wolfgang},
booktitle = {International Conference on Virtual Environments, Human-Computer Interfaces and Measurement Systems Proceedings},
publisher = {IEEE},
series = {VECIMS '11},
year = {2011},
month = {Sep},
pages = {78-83},
doi = {https://doi.org/10.1109/VECIMS.2011.6053849},
pdf = {papers/hedgesim.pdf},
teaser = {teasers/hedgesim.png},
abstract = {Virtual reality tracking systems are used to detect the position and orientation of a user inside spatially immersive systems. In this paper, we simulate a laser-based tracking system that was originally developed for a six-sided spatially immersive system in environments with one and five walls to evaluate its performance for other installations. As expected, the results show that performance degrades with the number of walls, but they also show that tracking with even one wall is still very feasible.},
keywords = {3D tracking, simulation, virtual reality},
}
@inproceedings{zhao2011comparison,
title = {Comparison of Multiple {3D} Rotation Methods},
author = {Zhao*, Yao Jun and Shuralyov*, Dmitri and Stuerzlinger, Wolfgang},
booktitle = {International Conference on Virtual Environments, Human-Computer Interfaces and Measurement Systems Proceedings},
publisher = {IEEE},
series = {VECIMS '11},
year = {2011},
month = {Sep},
pages = {13-17},
doi = {https://doi.org/10.1109/VECIMS.2011.6053855},
pdf = {papers/comparerotation.pdf},
teaser = {teasers/comparerotation.png},
abstract = {In this paper, we present an experimental comparison of 3D rotation techniques. In all techniques, the third degree of freedom is controlled by the mouse-wheel. The investigated techniques are Bell's Trackball, Shoemake's Arcball and the Two-axis Valuator method. The result from a pilot showed no performance or accuracy difference among these three. However, we did observe minor differences in an experiment with more participants and trials, though these differences were not significant. Also, from questionnaires, we found that most of the users considered the use of mouse wheel helpful for completing the tasks.},
keywords = {3D manipulation},
}
@inproceedings{mcclymont2011comparison,
title = {Comparison of {3D} Navigation Interfaces},
author = {{McClymont}*, Joshua and Shuralyov*, Dmitri and Stuerzlinger, Wolfgang},
booktitle = {International Conference on Virtual Environments, Human-Computer Interfaces and Measurement Systems Proceedings},
publisher = {IEEE},
series = {VECIMS '11},
year = {2011},
month = {Sep},
pages = {7-12},
doi = {https://doi.org/10.1109/VECIMS.2011.6053842},
pdf = {papers/comparenavigation.pdf},
teaser = {teasers/comparenavigation.png},
abstract = {This paper evaluates two different interfaces for navigation in a 3D environment. The first is a `Click-to-Move' style interface that involves using a mouse. The second is a gaming style interface that uses both mouse and keyboard (i.e. the `WASD' keys) for view direction and movement respectively. In the user study, participants were asked to navigate a supermarket environment and collect a specific subset of items. Results revealed significant differences only for some of the sub-measures. Yet, some revealing observations were made regarding user behavior and interaction with the user interface.},
keywords = {3D navigation},
}
@inproceedings{dadgari2011merging,
title = {New Techniques for Merging Text Versions},
author = {Dadgari*, Darius and Stuerzlinger, Wolfgang},
booktitle = {Human-Computer Interaction, Interaction Techniques and Environments},
publisher = {Springer},
series = {HCI International '11},
year = {2011},
month = {Jul},
volume = {LNCS 6762},
pages = {331-340},
doi = {https://doi.org/10.1007/978-3-642-21605-3_37},
pdf = {papers/version4text.pdf},
teaser = {teasers/version4text.png},
abstract = {Versioning helps users to keep track of different sets of edits on a document. Version merging methods enable users to determine which parts of which version they wish to include in the next or final version. We explored several existing and two new methods (highlighting and overlay) in single and multiple window settings. We present the results of our quantitative user studies, which show that the new highlighting and overlay techniques are preferred for version merging tasks. The results suggest that the most useful methods are those which clearly and easily present information that is likely important to the user, while simultaneously hiding less important information. Also, multi window version merging is preferred over single window merging.},
keywords = {difference visualization, merging},
}
@inproceedings{zaman2011effect,
title = {The Effect of Animation Dual-View, Difference Layers and Relative Re-Layout in Hierarchical Diagram Differencing},
author = {Zaman*, Loutfouz and Kalra+, Ashish and Stuerzlinger, Wolfgang},
booktitle = {Graphics Interface},
series = {GI '11},
year = {2011},
month = {May},
pages = {183-190},
url = {https://graphicsinterface.org/proceedings/gi2011/gi2011-24},
pdf = {papers/versiondiff4diagrams.pdf},
teaser = {teasers/versiondiff4diagrams.png},
abstract = {We present a new system for visualizing and merging differences in diagrams that uses animation, dual views, a storyboard, relative re-layout, and layering. We ran two user studies investigating the benefits of the system. The first user study compared pairs of hierarchical diagrams with matching node positions. The results underscore that naïve dual-view visualization is undesirable. On the positive side, participants particularly liked the dual-view with difference layer technique. The second user study focused on diagrams with partially varying node positions and difference visualization and animation. We found evidence that both techniques are beneficial, and that the combination was preferred.},
keywords = {difference visualization, diagram},
}
@inproceedings{ashtiani20112d,
title = {{2D} Similarity Transformations on Multi-Touch Surfaces},
author = {Ashtiani*, Behrooz and Stuerzlinger, Wolfgang},
booktitle = {Graphics Interface},
series = {GI '11},
year = {2011},
month = {May},
pages = {57-64},
url = {https://graphicsinterface.org/proceedings/gi2011/gi2011-8},
pdf = {papers/xnt2d.pdf},
video = {videos/XNT.mp4},
teaser = {teasers/xnt2d.png},
abstract = {We present and comparatively evaluate two new object transformation techniques for multi-touch surfaces. Specifying complete two-dimensional similarity transformations requires a minimum of four degrees of freedom: two for position, one for rotation, and another for scaling. Many existing techniques for object transformation are designed to function with traditional input devices such as mice, single-touch surfaces, or stylus pens. The challenge is to map controls appropriately for each of these devices. A few multi-touch techniques have been proposed in the past, but no comprehensive evaluation has been presented.
XNT is a new three-finger object transformation technique, designed for multi-touch surfaces. It provides a natural interface for two-dimensional manipulation. XNT and several existing techniques were evaluated in a user study. The results show that XNT is superior for all tasks that involve scaling and competitive for tasks that involve only rotation and positioning.},
keywords = {touch, manipulation},
}
@inproceedings{pavlovych2011target,
title = {Target Following Performance in the Presence of Latency, Jitter, and Signal Dropouts},
author = {Pavlovych*, Andriy and Stuerzlinger, Wolfgang},
booktitle = {Graphics Interface},
series = {GI '11},
year = {2011},
month = {May},
pages = {33-40},
url = {https://graphicsinterface.org/proceedings/gi2011/gi2011-5},
pdf = {papers/trackingperformance.pdf},
teaser = {teasers/trackingperformance.png},
abstract = {In this paper we describe how human target following performance changes in the presence of latency, latency variations, and signal dropouts. Many modern games and game systems allow for networked, remote participation. In such networks latency, variations and dropouts are commonly encountered factors.
Our user study reveals that all of the investigated factors decrease tracking performance. The errors increase very quickly for latencies of over 110 ms, for latency jitters above 40 ms, and for dropout rates of more than 10 %. The effects of target velocity on errors are close to linear, and transverse errors are smaller than longitudinal ones. The results can be used to better quantify the effects of different factors on moving objects in interactive scenarios. They also aid the designers in selecting target sizes and velocities, as well as in adjusting smoothing, prediction and compensation algorithms.},
keywords = {target following, jitter},
}
@inproceedings{teather2011pointing,
title = {Pointing at {3D} Targets in a Stereo Head-Tracked Virtual Environment},
author = {Teather*, Robert J. and Stuerzlinger, Wolfgang},
booktitle = {Symposium on {3D} User Interfaces},
publisher = {IEEE},
series = {3DUI '11},
year = {2011},
month = {Mar},
pages = {87-94},
doi = {https://doi.org/10.1109/3DUI.2011.5759222},
pdf = {papers/fishtankfitts.pdf},
teaser = {teasers/fishtankfitts.png},
abstract = {We present three experiments that systematically examine pointing tasks in fish tank VR using the ISO 9241-9 standard. All experiments used a tracked stylus for a both direct touch and ray-based technique. Mouse-based techniques were also studied. Our goal was to investigate means of comparing 2D and 3D pointing techniques. The first experiment used a 2D task constrained to the display surface, allowing direct validation against other 2D studies. The second experiment used targets stereoscopically presented above and parallel to the display, i.e., the same task, but without tactile feedback afforded by the screen. The third experiment used targets varying in all three dimensions. Results of these studies suggest that the conventional 2D formulation of Fitts' law works well for planar pointing tasks even without tactile feedback, and with stereo display. Fully 3D motions using the ray and mouse based techniques are less well modeled.},
keywords = {3D pointing},
}
@inproceedings{dehmeshki2010designeval,
title = {Design and Evaluation of a Perceptual-based Object Group Selection Technique},
author = {Dehmeshki*, Hoda and Stuerzlinger, Wolfgang},
booktitle = {24th BCS Interaction Specialist Group Conference},
series = {BCS-HCI '10},
year = {2010},
month = {Sep},
pages = {365-372},
doi = {https://doi.org/10.14236/ewic/HCI2010.43},
pdf = {papers/persel.pdf},
video = {videos/PerSel.mp4},
teaser = {teasers/persel.png},
abstract = {Selecting groups of objects is a frequent task in graphical user interfaces since it precedes all manipulation operations. Current selection techniques such as lasso become time-consuming and error-prone in dense configurations or when the area covered by targets is large or hard to reach. Perceptual-based selection techniques can considerably improve the selection task when the targets have a perceptual structure, driven by Gestalt principles of proximity and good continuity. However, current techniques use ad hoc grouping algorithms that often lack evidence from perception science. Moreover, they do not allow selecting arbitrary groups (i.e. without a perceptual structure) or modifying a selection. This paper presents a domain-independent perceptual-based selection technique that addresses these issues. It is built upon an established group detection model from perception research and provides intuitive interaction techniques for selecting (whole or partial) groups with curvi-linear or random structures. Our user study shows that this technique not only outperforms rectangle selection and lasso techniques when targets have perceptual structure, but also it is competitive when targets have arbitrary arrangements.},
keywords = {group selection},
}
@inproceedings{dadgari2010novel,
title = {Novel User Interfaces for Diagram Versioning and Differencing},
author = {Dadgari*, Darius and Stuerzlinger, Wolfgang},
booktitle = {24th BCS Interaction Specialist Group Conference},
series = {BCS-HCI '10},
year = {2010},
month = {Sep},
pages = {62-71},
doi = {https://doi.org/10.14236/ewic/HCI2010.10},
pdf = {papers/version4diagram.pdf},
teaser = {teasers/version4diagram.png},
abstract = {Easily available software for diagram creation does not support the comparison of different versions and the merging of such versions. We present new methods and techniques for easy versioning of general two-dimensional diagrams. Multiple novel versioning methods for diagram versioning are compared to each other as well as to previous work in a user study. Participants in a user study preferred the Translucency View and Master Diagram Scenario to the other investigated methods and scenarios.},
keywords = {difference visualization, diagram},
}
@inproceedings{das2010proactive,
title = {Proactive Interference in Location Learning: A New Closed-Form Approximation},
author = {Das*, Arindam and Stuerzlinger, Wolfgang},
booktitle = {International Conference on Cognitive Modeling},
publisher = {Drexel University},
series = {ICCM '10},
year = {2010},
month = {Aug},
pages = {37-42},
url = {https://iccm-conference.neocities.org/2010/proceedings},
pdf = {papers/proactiveinter.pdf},
teaser = {teasers/proactiveinter.png},
abstract = {The ACT-R cognitive theory models forgetting in general with a constant "decay due to passage of time" parameter. However, this is not sufficient to predict learning for frequently executed tasks in dense arrangements of items. Prominent examples are two-dimensional location learning in finding keys on a keyboard or clicking on items on a web page or in a graphical user interface. Our work presents a new way to theoretically model the effect of Proactive Interference, i.e. the effect of the history of events on location learning, through an extension to ACT-R's mathematical model of declarative memory strength. It predicts that each time an item is searched for and found, the item gets "stronger", i.e. easier to remember. However, this strength diminishes not only through the passage of time, but also due to interference from other (non-target) items that have been encountered in the past. We tested the predictions of our new model against empirical measurements from two previous studies that involve simple visual search and selection. The predictions fit the experimental data very well.},
keywords = {learning, text entry},
}
@inproceedings{zaman2010cloning,
title = {A New Interface for Cloning Objects in Drawing Systems},
author = {Zaman*, Loutfouz and Stuerzlinger, Wolfgang},
booktitle = {Graphics Interface},
series = {GI '10},
year = {2010},
month = {May},
pages = {27-34},
url = {https://graphicsinterface.org/proceedings/gi2010/gi2010-5},
pdf = {papers/cloning.pdf},
teaser = {teasers/cloning.png},
abstract = {Cloning objects is a common operation in graphical user interfaces. One example is calendar systems, where users commonly create and modify recurring events, i.e. repeated clones of a single event. Inspired by the calendar paradigm, we introduce a new cloning technique for 2D drawing programs. This technique allows users to clone objects by first selecting them and then dragging them to create clones along the dragged path. Moreover, it allows editing the generated sequences of clones similar to the editing of calendar events. Novel approaches for the generation of clones of clones are also presented.
We compared our new clone creation technique with generic duplication via copy-and-paste, smart duplication, and a dialog driven technique on a standard desktop system. The results show that the new cloning method is always faster than dialogs and smart duplication for most conditions. We also compared our clone editing method against rectangular selection. The results show that our method is better in general. In situations where rectangle selection is effective, our method is still competitive. Participants preferred the new techniques overall, too.},
keywords = {drawing, cloning, copy, paste},
}
@inproceedings{arif2010predicting,
title = {Predicting the Cost of Error Correction in Character-Based Text Entry Technologies},
author = {Arif*, Ahmed Sabbir and Stuerzlinger, Wolfgang},
booktitle = {{SIGCHI} Conference on Human Factors in Computing Systems},
publisher = {ACM},
series = {CHI '10},
year = {2010},
month = {Apr},
pages = {5-14},
doi = {https://doi.org/10.1145/1753326.1753329},
pdf = {papers/errorcostmodel.pdf},
teaser = {teasers/errorcostmodel.png},
abstract = {Researchers have developed many models to predict and understand human performance in text entry. Most of the models are specific to a technology or fail to account for human factors and variations in system parameters, and the relationship between them. Moreover, the process of fixing errors and its effects on text entry performance has not been studied. Here, we first analyze real-life text entry error correction behaviors. We then use our findings to develop a new model to predict the cost of error correction for character-based text entry technologies. We validate our model against quantities derived from the literature, as well as with a user study. Our study shows that the predicted and observed cost of error correction correspond well. At the end, we discuss potential applications of our new model.},
keywords = {text entry, errors},
}
@inproceedings{phillips2009friction,
title = {Can Friction Improve Mouse-Based Text Selection?},
author = {Phillips*, Dustin and Stuerzlinger, Wolfgang},
booktitle = {International Conference Science and Technology for Humanity},
publisher = {IEEE},
series = {TIC-STH '09},
year = {2009},
month = {Sep},
pages = {89-94},
doi = {https://doi.org/10.1109/TIC-STH.2009.5444369},
pdf = {papers/frictionselect.pdf},
teaser = {teasers/frictionselect.png},
abstract = {Text selection via caret positioning is a common task in modern word processing interfaces. It is a difficult task as target size - the distance between characters - is very small. We adapt Baudisch's snap-and-go technique for target acquisition to insert additional motor space at such targets when the mouse is decelerating. This increases the size of the target in motor space, thus potentially reducing the difficulty of text selection tasks. We expand this idea by introducing the concept of context-sensitive friction to improve target acquisition for common targets. We performed two pilot studies and a controlled user study to evaluate the new techniques. Our results indicate that selectively introducing friction into the interface can reduce total task time in common text selection tasks.},
keywords = {selection, snapping, mouse},
}
@inproceedings{arif2009analysis,
title = {Analysis of Text Entry Performance Metrics},
author = {Arif*, Ahmed Sabbir and Stuerzlinger, Wolfgang},
booktitle = {International Conference Science and Technology for Humanity},
publisher = {IEEE},
series = {TIC-STH '09},
year = {2009},
month = {Sep},
pages = {100-105},
doi = {https://doi.org/10.1109/TIC-STH.2009.5444533},
pdf = {papers/textperfmetrics.pdf},
teaser = {teasers/textperfmetrics.png},
abstract = {Researchers have proposed many text entry systems to enable users to perform this frequent task as quickly and precise as possible. Unfortunately the reported data varies widely and it is difficult to extract meaningful average entry speeds and error rates from this body of work. In this article we collect data from well-designed and well-reported experiments for the most important text entry methods, including those for handheld devices. Our survey results show that thumb keyboard is the fastest text entry method after the standard QWERTY keyboard, and that Twiddler is fastest amongst non-QWERTY methods. Moreover, we survey how text entry errors were handled in these studies. Finally, we conducted a user study to detect which effect different error-handling methodologies have on text entry performance metrics. Our study results show that the way human errors are handled has indeed a significant effect on all frequently used error metrics.},
keywords = {text entry, errors},
}
@inproceedings{teather2009evaluating,
title = {Evaluating Visual/Motor Co-location in Fish-Tank Virtual Reality},
author = {Teather*, Robert J. and Allison, Robert and Stuerzlinger, Wolfgang},
booktitle = {International Conference Science and Technology for Humanity},
publisher = {IEEE},
series = {TIC-STH '09},
year = {2009},
month = {Sep},
pages = {624-629},
doi = {https://doi.org/10.1109/TIC-STH.2009.5444423},
pdf = {papers/colocateddisjoint.pdf},
teaser = {teasers/colocateddisjoint.png},
abstract = {Virtual reality systems often co-locate the display and input (motor) spaces. Many input devices, such as the mouse, use indirect input mappings, and are disjoint from the display space. A study of visual/motor co-location was conducted to determine if there is any benefit to working directly "in" a virtual environment. Using a fish-tank VR setup, participants performed a 3D object movement task. This required moving an object from the centre of the environment to target regions, using a tracked pen, in both co-located and disjoint display/input conditions. Results were analyzed in the context of Fitts' Law, which models rapid aimed movements. Ultimately, no significant differences were found between co-located and disjoint conditions. However, when analyzing object movement in specific directions, the co-located condition was somewhat better than the disjoint one. In particular, movement into the scene was faster when the display and input device were co-located rather than disjoint.},
keywords = {3D pointing},
}
@inproceedings{dehmeshki2009icelasso,
title = {ICE-Lasso: An Enhanced Form Of Lasso Selection},
author = {Dehmeshki*, Hoda and Stuerzlinger, Wolfgang},
booktitle = {International Conference Science and Technology for Humanity},
publisher = {IEEE},
series = {TIC-STH '09},
year = {2009},
month = {Sep},
pages = {630-635},
doi = {https://doi.org/10.1109/TIC-STH.2009.5444424},
pdf = {papers/icelasso.pdf},
teaser = {teasers/icelasso.png},
abstract = {Lasso selection tends to be inefficient in many circumstances such as selecting spatially large clusters. ICE-Lasso is a novel technique that infers likely target clusters during an ongoing lasso gesture. It provides efficient gesture-based interaction techniques as shortcuts to select partial, complete, and multiple clusters. Additionally, it is overloaded on the traditional lasso via automatic mode switching. A comparative user study show that ICE-Lasso is significantly more efficient than lasso and also well-liked by users.},
keywords = {group selection},
}
@inproceedings{scoditti2009new,
title = {A New Layout Method for Graphical User Interfaces},
author = {Scoditti*, Adriano and Stuerzlinger, Wolfgang},
booktitle = {International Conference Science and Technology for Humanity},
publisher = {IEEE},
series = {TIC-STH '09},
year = {2009},
month = {Sep},
pages = {642-647},
doi = {https://doi.org/10.1109/TIC-STH.2009.5444422},
pdf = {papers/intuilayout.pdf},
teaser = {teasers/intuilayout.png},
abstract = {The layout mechanisms for many GUI toolkits are hard to understand, the associated tools and API's often difficult to use. This work investigates new, easy-to-understand layout mechanisms and evaluates its implementation. We will analyze the requirements for the definition of layouts of a graphical user interface. Part of the issue is that several aspects need to be considered simultaneously while laying-out a component: the alignment with other components as well as its own behaviour while resizing its container. Moreover, the used tools should isolate the designer/drawer from the implementation details of the framework. We present the details of our new GUI layout system, discuss the choices we made for our new layout algorithm and detail implementation issues. Moreover, we present also the user interface for our new GUI builder system that contains several innovations, such as a preview window to show the effects of layout configuration choices in real-time. We present an evaluation of our new system by attacking the complex GUI layout problem mentioned above.},
keywords = {GUI, layout},
}
@inproceedings{pavlovych2009tradeoff,
title = {The Tradeoff Between Spatial Jitter and Latency in Pointing Tasks},
author = {Pavlovych*, Andriy and Stuerzlinger, Wolfgang},
booktitle = {Symposium on Engineering Interactive Computing Systems},
publisher = {ACM},
series = {EICS '09},
year = {2009},
month = {Jul},
pages = {187-196},
doi = {https://doi.org/10.1145/1570433.1570469},
pdf = {papers/latencyjitter.pdf},
teaser = {teasers/latencyjitter.png},
abstract = {Interactive computing systems frequently use pointing as an input modality, while also supporting other forms of input such as alphanumeric, voice, gesture, and force.We focus on pointing and investigate the effects of input device latency and spatial jitter on 2D pointing speed and accuracy. First, we characterize the latency and jitter of several common input devices. Then we present an experiment, based on ISO 9241-9, where we systematically explore combinations of latency and jitter on a desktop mouse to measure how these factors affect human performance. The results indicate that, while latency has a stronger effect on human performance compared to low amounts of spatial jitter, jitter dramatically increases the error rate, roughly inversely proportional to the target size.The findings can be used in the design of pointing devices for interactive systems, by providing a guideline for choosing parameters of spatial filtering to compensate for jitter, since stronger filtering typically also increases lag. We also describe target sizes at which error rates start to increase notably, as this is relevant for user interfaces where hand tremor or similar factors play a major role.},
keywords = {pointing, jitter},
}
@inproceedings{dehmeshki2009gpsel,
title = {GPSel: A Gestural Perceptual-based Path Selection Technique},
author = {Dehmeshki*, Hoda and Stuerzlinger, Wolfgang},
booktitle = {Smart Graphics},
publisher = {Springer},
series = {SG '09},
year = {2009},
month = {May},
volume = {LNCS 5531},
pages = {243-252},
doi = {https://doi.org/10.1007/978-3-642-02115-2_21},
pdf = {papers/gpsel.pdf},
teaser = {teasers/gpsel.png},
abstract = {This paper introduces a gestural perceptual-based approach to select objects, i.e., nodes and/or edges along paths. Based on known results from perception research, we propose a model to detect perceptually salient paths formed by the Gestalt principles of good continuity and closure. Then we introduce gestural interaction techniques that enable users to select single or multiple perceptual paths, as well as resolving ambiguities in selection. The result of a user study shows that our system outperforms current techniques for path selection.},
keywords = {group selection, gestures},
}
@inproceedings{teather2009effectstracking,
title = {Effects of Tracking Technology, Latency, and Spatial Jitter on Object Movement},
author = {Teather*, Robert J. and Pavlovych*, Andriy and Stuerzlinger, Wolfgang and {MacKenzie}, I. Scott},
booktitle = {Symposium on {3D} User Interfaces},
publisher = {IEEE},
series = {3DUI '09},
year = {2009},
month = {Mar},
pages = {43-50},
doi = {https://doi.org/10.1109/3DUI.2009.4811204},
pdf = {papers/deviceeffects3D.pdf},
teaser = {teasers/deviceeffects3D.png},
abstract = {We investigate the effects of input device latency and spatial jitter on 2D pointing tasks and 3D object movement tasks. First, we characterize jitter and latency in a 3D tracking device and an optical mouse used as a baseline comparison. We then present an experiment based on ISO 9241-9, which measures performance characteristics of pointing devices. We artificially introduce latency and jitter to the mouse and compared the results to the 3D tracker. Results indicate that latency has a much stronger effect on human performance than low amounts of spatial jitter. In a second study, we use a subset of conditions from the first to test latency and jitter on 3D object movement. The results indicate that large, uncharacterized jitter ldquospikesrdquo significantly impact 3D performance.},
keywords = {3D pointing, latency, jitter},
}
@inproceedings{das2008modeling,
title = {Modeling Learning Effects in Mobile Texting},
author = {Das*, Arindam and Stuerzlinger, Wolfgang},
booktitle = {International Conference on Mobile and Ubiquitous Multimedia},
publisher = {ACM},
series = {MUM '08},
year = {2008},
month = {Dec},
pages = {154-161},
doi = {https://doi.org/10.1145/1543137.1543169},
pdf = {papers/learneffectsmodel.pdf},
teaser = {teasers/learneffectsmodel.png},
abstract = {No work on mobile text messaging so far has taken into account the effect of learning on the change in visual exploration behavior as users progress from non-expert to expert level. We discuss within the domain of multi-tap texting on mobile phone and address the process of searching versus selecting a letter on the keypad interface. We develop a simulation model that forecasts the probability of letter location recall by non-expert users and thereby models learning, as the user acquires expertise in recalling, with practice, session after session. We then plugin this probability within a model of visual strategy that combines the effect of different ways visual exploration: non-expert users search for a letter while expert users select a letter. The observed non-expert non-motor time preceding a key press (for a letter) correlates extremely well with the simulation results.},
keywords = {text entry, learning},
}
@inproceedings{teather2008exaggerated,
title = {Exaggerated Head Motions for Game Viewpoint Control},
author = {Teather*, Robert J. and Stuerzlinger, Wolfgang},
booktitle = {Conference on Future Play: Research, Play, Share},
publisher = {ACM},
series = {FuturePlay '08},
year = {2008},
month = {Nov},
pages = {240-243},
doi = {https://doi.org/10.1145/1496984.1497034},
pdf = {papers/headmotion.pdf},
teaser = {teasers/headmotion.png},
abstract = {In this paper, we present an evaluation of exaggerated headcoupled camera motions in a game-like 3D object movement. Three exaggeration levels were compared to determine if the exaggeration was more beneficial than a realistic 1:1 mapping.The results suggest that there is some user preference for this type of exaggeration; however, no significant differences by the experimental conditions were found, other than a learning effect.},
keywords = {3D navigation, head motion},
}
@inproceedings{pavlovych2008screenconfiguration,
title = {Effect of Screen Configuration and Interaction Devices in Shared Display Groupware},
author = {Pavlovych*, Andriy and Stuerzlinger, Wolfgang},
booktitle = {3rd Workshop on Human-centered Computing},
publisher = {ACM},
series = {HCC '08},
year = {2008},
month = {Oct},
pages = {49-56},
doi = {https://doi.org/10.1145/1462027.1462035},
pdf = {papers/multi_effects.pdf},
teaser = {teasers/multi_effects.png},
abstract = {Interactive tabletop and wall surfaces support collaboration and interactivity in novel ways. Apart from keyboards and mice, such systems can also incorporate other input devices, namely laser pointers, marker pens with screen location sensors, or touch-sensitive surfaces. Similarly, instead of a vertically positioned desktop monitor, collaborative setups typically use much larger displays, which are oriented either vertically (wall) or horizontally (tabletop), or combine both kinds of surfaces.In this paper we describe an empirical study that investigates how technical system constraints can affect group performance in high pace collaborative tasks. For this, we compare various input and output modalities in a system that consists of several interactive tabletop and wall surface(s). We observed that the performance of a group of people scaled almost linearly with the number of participants on an almost perfectly parallel task. We also found that mice were significantly faster than laser pointers, but only by 21%. Also, interaction on walls was significantly faster than on the tabletop, by 51%.},
keywords = {groupware, large display interaction, large display system},
}
@inproceedings{dehmeshki2008groupselect,
title = {Intelligent Mouse-based Object Group Selection},
author = {Dehmeshki*, Hoda and Stuerzlinger, Wolfgang},
booktitle = {Smart Graphics 2008},
publisher = {Springer},
series = {SG '08},
year = {2008},
month = {Aug},
volume = {LNCS 5166},
pages = {33-44},
doi = {https://doi.org/10.1007/978-3-540-85412-8_4},
pdf = {papers/gestaltclick1.pdf},
video = {videos/Gestalt.mp4},
teaser = {teasers/gestaltclick1.png},
abstract = {Modern graphical user interfaces support direct manipulation of objects and object groups. Current object group selection techniques such as lasso and rectangle selection can be time-consuming and error-prone. This paper presents a new approach to group selection that exploits the way human perception naturally groups objects, also known as Gestalt grouping. Based on known results from perception research, we present a novel method to group objects via models of the Gestalt principles of proximity and (curvi-)linearity. Then, we introduce several new mouse-based selection techniques that exploit these Gestalt groups. The results of a user study show that our new technique outperforms lasso and rectangle selection for object groups with an implicit structure, such as (curvi-)linear arrangements or clusters.},
keywords = {group selection},
}
@inproceedings{kerr2008context,
title = {Context-Sensitive Cut, Copy, and Paste},
author = {Kerr+, Reid and Stuerzlinger, Wolfgang},
booktitle = {Conference on Computer Science and Software Engineering},
publisher = {ACM},
series = {C3S2E '08},
year = {2008},
month = {May},
pages = {159-166},
doi = {https://doi.org/10.1145/1370256.1370283},
pdf = {papers/csccap.pdf},
teaser = {teasers/csccap.png},
abstract = {Creating and editing source code are tedious and error-prone processes. One important source of errors in editing programs is the failure to correctly adapt a block of copied code to a new context. This occurs because several dependencies to the surrounding code usually need to be adapted for the new context and it is easy to forget one of them. Conversely, this also makes such errors hard to find.This paper presents a new method for identifying some common types of errors in cut, copy and paste operations. The method analyzes the context of the original block of code and tries to match it with the context in the new location. It utilizes a simple, pattern-based model of context, which we found to be well suited to the analysis of relocated blocks of text. Furthermore, we discuss the ability of our technique to detect semantic errors. While semantic errors are relatively difficult to recognize in a static document, our new technique can infer important information from the original context to detect some semantic mismatches. Finally, we present a proof-of-concept implementation and discuss our simple user interface for context-sensitive cut, copy and paste.},
keywords = {copy, paste, editing, context-sensitive},
}
@inproceedings{teather2008assessing,
title = {Assessing the Effects of Orientation and Device on (Constrained) {3D} Movement Techniques},
author = {Teather*, Robert J. and Stuerzlinger, Wolfgang},
booktitle = {Symposium on {3D} User Interfaces},
publisher = {IEEE},
series = {3DUI '08},
year = {2008},
month = {Mar},
pages = {43-50},
doi = {https://doi.org/10.1109/3DUI.2008.4476590},
pdf = {papers/move3deval.pdf},
teaser = {teasers/move3deval.png},
abstract = {We present two studies to assess which physical factors influence 3D object movement tasks with various input devices. Since past research has shown that a mouse with suitable mapping techniques can serve as a good input device for some 3D object movement tasks, we also evaluate which characteristics of the mouse sustain its success. Our first study evaluates the effect of a supporting surface across orientation of input device movement and display orientation. A 3D tracking device was used in all conditions for consistency. The results of this study are inconclusive; no significant differences were found between the factors examined. The results of a second study show that the mouse outperforms the tracker for speed in all instances. The presence of support also improved accuracy when tracker movement is limited to 2D operation. A 3DOF movement mode performed worst overall.},
keywords = {3D positioning, 3D pointing, orientation},
}
@inproceedings{teather2007guidelines,
title = {Guidelines for {3D} Positioning Techniques},
author = {Teather*, Robert J. and Stuerzlinger, Wolfgang},
booktitle = {Conference on Future Play},
publisher = {ACM},
series = {Futureplay '07},
year = {2007},
month = {Nov},
pages = {61-68},
doi = {https://doi.org/10.1145/1328202.1328214},
pdf = {papers/move3dguidelines.pdf},
teaser = {teasers/move3dguidelines.png},
abstract = {In this paper, we present a set of guidelines for designing 3D positioning techniques. These guidelines are intended for developers of object interaction schemes in 3D games, modeling packages, computer aided design systems, and virtual environments. The guidelines promote intuitive object movement techniques in these types of environments.We then present a study comparing 3D positioning techniques based on these guidelines with 2D and 3D/6D devices across VR display technologies. Display technologies such as stereoscopic graphics and head-coupled perspective provide additional depth cues and could affect how a user perceives and thus interacts with a 3D scene - regardless of the input device/technique used. Thus they are examined as well. The results suggest that 2D devices using "smart" movement algorithms can outperform 3D devices.},
keywords = {3D positioning, orientation},
}
@inproceedings{das2007cognitive,
title = {A Cognitive Simulation Model for Novice Text Entry on Cell Phone Keypads},
author = {Das*, Arindam and Stuerzlinger, Wolfgang},
booktitle = {14th European Conference on Cognitive Ergonomics: Invent! Explore!},
publisher = {ACM},
series = {ECCE '07},
year = {2007},
month = {Aug},
pages = {141-147},
doi = {https://doi.org/10.1145/1362550.1362579},
pdf = {papers/novicecogmodel.pdf},
teaser = {teasers/novicecogmodel.png},
abstract = {Motivation - To create a cognitive simulation model that predicts text entry performance and learning on cell phone keypads by novice users. Research approach - A programmable cognitive architecture, ACT-R, is used to execute the simulation model. Part of the simulation result is compared with the result of a previous user study. Findings/Design - The proposed model is an a priori model (not tuned to any real user data) that predicts the amount of time spent in finding a key on the keypad and pressing it repeatedly. The predicted amount of time in finding a key differs by 6% and the time between two repeated key-presses of the same key by 27% compared to the results of a previous user study. The model also captures the learning of keypad layout by novice users. Memorization of keypad layout is simulated using task repetition. Research limitations/Implications - This research has several limitations described towards the end of this paper. An important one among them is that the work does not model the impact of visual distracters in the field of view (frontal surface of the handset) on user performance. Originality/Value - This is the first cognitive simulation model of novice user's text entry performance and learning on cell phone keypads. Take away message - This work introduces an a priori congnitive model of text entry by novice users. This forms a basis for systematic exploration of keypad designs for cell phones in shorter time and lower cost.},
keywords = {text entry, learning},
}
@inproceedings{tumanov2007variabilityaware,
title = {Variability-Aware Latency Amelioration in Distributed Environments},
author = {Tumanov*, Alexey and Allison, Robert and Stuerzlinger, Wolfgang},
booktitle = {Virtual Reality Conference},
publisher = {IEEE},
series = {VR '07},
year = {2007},
month = {Mar},
pages = {123-130},
doi = {https://doi.org/10.1109/VR.2007.352472},
pdf = {papers/latencypredict.pdf},
teaser = {teasers/latencypredict.png},
abstract = {Application designers of collaborative distributed virtual environments must account for the influence of the network connection and its detrimental effects on user performance. Based upon analysis and classification of existing latency compensation techniques, this paper introduces a novel approach to latency amelioration in the form of a two-tier predictor-estimator framework. The technique is variability-aware due to its proactive sender-side prediction of a pose a variable time into the future. The prediction interval required is estimated based on current and past network delay characteristics. This latency estimate is subsequently used by a Kalman filter-based predictor to replace the measurement event with a predicted pose that matches the event's arrival time at the receiving workstation. The compensation technique was evaluated in a simulation through an offline playback of real head motion data and network delay traces collected under a variety of real network conditions. The experimental results indicate that the variability-aware approach significantly outperforms a state-of-the-art one, which assumes a constant system delay},
keywords = {latency, jitter, virtual reality},
}
@inproceedings{stuerzlinger2006uifacades,
title = {User Interface Façades: Towards Fully Adaptable User Interfaces},
author = {Stuerzlinger, Wolfgang and Chapuis, Olivier and Phillips*, Dustin and Roussel, Nicolas},
booktitle = {19th Symposium on User Interface Software and Technology},
publisher = {ACM},
series = {UIST '06},
year = {2006},
month = {Oct},
pages = {309-318},
doi = {https://doi.org/10.1145/1166253.1166301},
url = {https://ws.iat.sfu.ca/facades},
pdf = {papers/uifacades.pdf},
video = {videos/uifacades.mp4},
teaser = {teasers/uifacades.png},
abstract = {User interfaces are becoming more and more complex. Adaptable and adaptive interfaces have been proposed to address this issue and previous studies have shown that users prefer interfaces that they can adapt to self-adjusting ones. However, most existing systems provide users with little support for adapting their interfaces. Interface customization techniques are still very primitive and usually constricted to particular applications. In this paper, we present User Interface Façades, a system that provides users with simple ways to adapt, reconfigure, and re-combine existing graphical interfaces, through the use of direct manipulation techniques. The paper describes the user's view of the system, provides some technical details, and presents several examples to illustrate its potential.},
keywords = {facades, GUI, layout, copy, paste},
}
@inproceedings{oh2006sesame,
title = {{SESAME}: Towards Better {3D} Conceptual Design Systems},
author = {Oh*, Ji-Young and Stuerzlinger, Wolfgang and Danahy, John},
booktitle = {6th Conference on Designing Interactive Systems},
publisher = {ACM},
series = {DIS '06},
year = {2006},
month = {Jun},
pages = {80-89},
doi = {https://doi.org/10.1145/1142405.1142419},
pdf = {papers/sesameui.pdf},
video = {videos/sesame.m4v},
teaser = {teasers/sesameui.png},
abstract = {Conceptual design dominates the early stages of most creative design processes. During these stages, the designer makes important decisions about the parameters of a model that are aimed at satisfying a set of design criteria. To do this, the designer produces many sketches of various possible solutions. Meanwhile, computer-aided design (CAD) systems are becoming the dominant visual medium used in design practice. However, these tools evolved as documentation production tools and do not support conceptual thinking. This paper presents a list of guidelines for computer support for conceptual design activities on 3D scenes and presents SESAME (Sketch, Extrude, Sculpt, and Manipulate Easily), a system based on these guidelines. Finally, we present a user study comparing SESAME with a conventional CAD package to demonstrate the effectiveness of SESAME.},
keywords = {design, snapping, 3D positioning, 3D manipulation, 3D modeling},
}
@inproceedings{baradaran2006comparison,
title = {A Comparison of Real and Virtual {3D} Construction Tools with Novice Users},
author = {Baradaran+, Hooman and Stuerzlinger, Wolfgang},
booktitle = {International Conference on Computer Graphics & Virtual Reality},
series = {CGVR '06},
isbn = {978-1-93241585-8},
year = {2006},
month = {Jun},
pages = {10-14},
url = {https://dblp.org/db/conf/cgvr/cgvr2006},
pdf = {papers/hapticslego.pdf},
teaser = {teasers/hapticslego.png},
abstract = {In this paper, we present the results of a comparative evaluation of a "virtual Lego" system against real Lego bricks with novice users. The virtual Lego system was designed to emulate the behavior of real Lego bricks as close as possible, while still allowing for efficient operation. We implemented two different user interfaces for the virtual Lego system, namely controlling it with a 2D mouse, based on an efficient mapping from 2D to 3D, as well as with a 3D haptics device, which provides haptic feedback to the user. The results of our study show that real Lego is still significantly faster for first-time users (i.e. users with minimal training). A more surprising result is that the 2D mouse condition and the 3D haptics condition did not differ significantly - even though the 3D haptics condition provides much richer feedback. We discuss the results and speculate about the underlying reasons.},
keywords = {haptics, 3D positioning, 3D manipulation, design, lego},
}
@inproceedings{parilov2006multiview,
title = {Multi-view Visibility Orderings for Real-Time Point-Sampled Rendering},
author = {Parilov*, Sergey and Stuerzlinger, Wolfgang},
booktitle = {International Conference on Computer Graphics & Virtual Reality},
series = {CGVR '06},
isbn = {978-1-93241585-8},
year = {2006},
month = {Jun},
pages = {125-131},
url = {https://dblp.org/db/conf/cgvr/cgvr2006},
pdf = {papers/fastibr.pdf},
video = {videos/ibr_pointsampled.mp4},
teaser = {teasers/fastibr.png},
abstract = {Occlusion-compatible traversals and z-buffering are often regarded as the only choices for resolving visibility in the image- and point-based rendering community. These algorithms do either per-frame or per-pixel computations. This paper first discusses visibility orderings for point samples in general and then discusses orderings that are valid for multiple views. Then we present a novel, highly efficient, visibility algorithm for point-sampled models that has much smaller per-frame cost than previous approaches. We also discuss a high-performance, cache friendly implementation of this visibility method and present results. Finally, we speculate on possible hardware implementations.},
keywords = {rendering, real-time, visibility},
}
@inproceedings{boehl2006areashadow,
title = {Real-time Computation Of Area Shadows - A Geometrical Algorithm},
author = {Boehl*, Michael and Stuerzlinger, Wolfgang},
booktitle = {International Conference on Computer Graphics & Virtual Reality},
series = {CGVR '06},
isbn = {978-1-93241585-8},
year = {2006},
month = {Jun},
pages = {118-124},
url = {https://dblp.org/db/conf/cgvr/cgvr2006},
pdf = {papers/penumbras.pdf},
teaser = {teasers/penumbras.png},
abstract = {The computation of soft shadows created by area light sources is a well-known problem in computer graphics. Due to the complexity of the problem, soft shadows commonly are generated only for images that are rendered in an off-line process. In interactive virtual environments, where images have to be computed in real time, soft shadows are mostly replaced by hard shadows as this takes much less time to compute.
This paper presents an algorithm that uses a geometrical method to generate a triangulated approximation of the soft shadow cast by a polygonal object very quickly. The algorithm can simulate effects such as the varying width of penumbras depending on distance to the light and can be extended to support non-convex light sources as well. We mention the artifacts arising from triangulation and give discuss how to alleviate such problems.},
keywords = {rendering, real-time},
}
@inproceedings{oh2006groupselect,
title = {Group Selection Techniques for Efficient {3D} Modeling},
author = {Oh*, Ji-Young and Stuerzlinger, Wolfgang and Dadgari*, Darius},
booktitle = {Symposium on {3D} User Interfaces},
publisher = {IEEE},
series = {3DUI '06},
year = {2006},
month = {Mar},
pages = {95-102},
doi = {https://doi.org/10.1109/VR.2006.66},
pdf = {papers/sesamegrouping.pdf},
video = {videos/sesame_multiclick.m4v},
teaser = {teasers/sesamegrouping.png},
abstract = {Object selection and manipulation (e.g. moving, rotating) are the most basic tasks in 3D scene construction. While most research on selection and manipulation techniques targets single objects, we examine the concept of group selection in this paper. Group selection is often given lesser importance than single object selection, yet is vital in providing users with a way to modify larger scenes with objects which are repetitive, sequential, or otherwise inherently understood as 'belonging together' by a user. We observed users manipulating objects in 3D scenes, and while doing so, they clearly expected that objects would be grouped based on their gravitational relationship. That is, all objects that are supported by some selected object will follow the motion of the selected object when manipulated. In this paper, we present a system that efficiently supports the manipulation of groups of objects via a gravitational hierarchy. As this hierarchy is derived with a collision detector, the new grouping techniques do not require semantic or user specified information to work. The results of the evaluation show that using the gravitational hierarchy improves scene rearrangement significantly compared to conventional non-hierarchical methods. Finally, we discuss lessons learned from this study and make some suggestions on how the results can be incorporated into other systems.},
keywords = {group selection, 3D positioning, 3D modeling, 3D manipulation},
}
@inproceedings{pavlovych2005hdrproject,
title = {A High-Dynamic Range Projection System},
author = {Pavlovych*, Andriy and Stuerzlinger, Wolfgang},
booktitle = {Photonic Applications in Biosensing and Imaging},
publisher = {SPIE},
series = {Photonics North '05},
year = {2005},
month = {Sep},
volume = {SPIE 5969},
numpages = {8},
doi = {https://doi.org/10.1117/12.629117},
url = {https://ws.iat.sfu.ca/hdrproj.html},
pdf = {papers/hdrproject.pdf},
teaser = {teasers/hdrproject.png},
abstract = {The dynamic range in many real-world environments surpasses the capabilities of traditional display technologies by several orders of magnitude. Recently, a novel display capable of displaying images with a dynamic range much closer to real world situations has been demonstrated. This was achieved through a spatially modulated backlight behind an LCD panel. Combined with the modulating power of the LCD panel itself, this enabled the display of much higher contrast compared to an LCD panel with a spatially uniform backlight.
In this paper, we describe a further development of the technology, namely a high dynamic range projection system. This makes such display systems more widely applicable as any surface can be used for the display of high dynamic range images.
Our new system is designed as an external attachment to a regular DLP-based projector, which allows the use of unmodified projectors. It works by adapting the projected image via a set of lenses to form a small image. This small image is then modulated via an LCD panel and the result is projected via another lens system onto a larger screen, as in traditional projection scenarios. The double modulation, by the projector and the LCD panel together, creates a high dynamic range image and an ANSI contrast of over 700:1.
Finally, we discuss the advantages and disadvantages of our design relative to other high and low dynamic range display technologies and its potential applications.},
keywords = {high dynamic range, projector},
}
@inproceedings{oh2005comparing,
title = {Comparing {SESAME} and Sketching on Paper for Conceptual {3D} Design},
author = {Oh*, Ji-Young and Stuerzlinger, Wolfgang and Danahy, John},
booktitle = {Sketch-Based Interfaces and Modeling},
publisher = {Eurographics},
series = {SBM '05},
year = {2005},
month = {Aug},
pages = {81-88},
doi = {https://doi.org/10.2312/SBM/SBM05/081-087},
pdf = {papers/sesamecompare.pdf},
teaser = {teasers/sesamecompare.png},
abstract = {In the early stages of design, several concepts are usually generated to explore the possibilities. This paper investigates how well a computer-based system can support design thinking. SESAME is a novel 3D design system that aims to support creativity during the explorative phase of the design process. We report an evaluation comparing SESAME to paper sketching for early design exploration in an urban design scenario. Through the user evaluation, we illustrate how important it is to support essential properties of traditional sketching, such as rapid creation/modification, emergent shapes, and tolerance to ambiguity. Additionally, we show that a 3D system can indeed facilitate form exploration at the early stages of design thinking.},
keywords = {3D modeling, 3D manipulation, 3D sketching, drawing},
footnote = {SESAME was a co-evolution with SketchUp, https://www.sketchup.com},
}
@inproceedings{pavlovych2005analysis,
title = {An Analysis of Novice Text Entry Performance on Large Interactive Wall Surfaces},
author = {Pavlovych*, Andriy and Stuerzlinger, Wolfgang},
booktitle = {Human Computer International, CD},
publisher = {Lawrence Erlbaum},
series = {HCI International '05},
isbn = {978-080585807-5},
year = {2005},
month = {Jul},
numpages = {10},
url = {http://www.hci.international/index.php?module=conference&CF_op=view&CF_id=4},
pdf = {papers/whiteboardtext.pdf},
teaser = {teasers/whiteboardtext.png},
abstract = {This paper presents a comparative study of several soft keyboard layouts for text entry on interactive whiteboards. We compare the traditional QWERTY with several other layouts, including theoretically optimal ones, such as FITALY. In contrast to previous work, we concentrate on novice performance, as few people ever gain expert status on whiteboards.
The results show that for a population of regular keyboard users, QWERTY is the best alternative and even the slightest deviations from that arrangement degrade the performance significantly. Based on the experiments, we present an in-depth analysis of the behaviour of users for several layouts from a cognitive viewpoint.},
keywords = {text entry, large display interaction, novice},
}
@inproceedings{stachniak2005terrain,
title = {An Algorithm for Automated Fractal Terrain Deformation},
author = {Stachniak*, Szymon and Stuerzlinger, Wolfgang},
booktitle = {Computer Graphics and Artificial Intelligence},
series = {3IA '05},
commented-isbn = {978-291425607-0},
year = {2005},
month = {May},
pages = {64-76},
url = {http://www.msi.unilim.fr/3IA},
pdf = {papers/fractaldeform.pdf},
video = {videos/fractal_deform.mp4},
teaser = {teasers/fractaldeform.png},
abstract = {Fractal terrains provide an easy way to generate realistic landscapes. There are several methods to generate fractal terrains, but none of those algorithms allow the user much flexibility in controlling the shape or properties of the final outcome. A few methods to modify fractal terrains have been previously proposed, both algorithm-based as well as by hand editing, but none of these provide a general solution.
In this work, we present a new algorithm for fractal terrain deformation. We present a general solution that can be applied to a wide variety of deformations. Our approach employs stochastic local search to identify a sequence of local modifications, which deform the fractal terrain to conform to a set of specified constraints. The presented results show that the new method can incorporate multiple constraints simultaneously, while still preserving the natural look of the fractal terrain.},
keywords = {fractal, terrain, rendering, ray tracing},
}
@inproceedings{oh2005moving,
title = {Moving Objects with {2D} Input Devices in CAD Systems and Desktop Virtual Environments},
author = {Oh*, Ji-Young and Stuerzlinger, Wolfgang},
booktitle = {Graphics Interface},
series = {GI '05},
year = {2005},
month = {May},
pages = {195-202},
url = {https://graphicsinterface.org/proceedings/gi2005/gi2005-24},
pdf = {papers/move3d.pdf},
video = {videos/sesameMove3D2005.mp4},
teaser = {teasers/move3d.png},
abstract = {Part assembly and scene layout are basic tasks in 3D design in Desktop Virtual Environment (DVE) systems as well as Computer Aided Design (CAD) systems. 2D input devices such as a mouse or a stylus are still the most common input devices for such systems. With such devices, a notably difficult problem is to provide an efficient and predictable object motion in 3D based on their 2D motion. This paper presents a new technique to move objects in CAD/DVE using 2D input devices.
The technique presented in this paper utilizes the fact that people easily recognize the depth-order of shapes based on occlusions. In the presented technique, the object position follows the mouse cursor position, while the object slides on various surfaces in the scene. In contrast to existing techniques, the movement surface and the relative object position is determined using the whole area of overlap of the moving object with the static scene. The resulting object movement is visually smooth and predictable, while avoiding undesirable collisions. The proposed technique makes use of the framebuffer for efficiency and runs in real-time. Finally, the evaluation of the new technique with a user study shows that it compares very favorably to conventional techniques.},
keywords = {3D positioning, 3D modeling, 3D manipulation, sliding},
}
@inproceedings{vorozcovs2005hedgehog,
title = {The Hedgehog: A Novel Optical Tracking Method for Spatially Immersive Displays},
author = {Vorozcovs*, Andrew and Hogue*, Andrew and Stuerzlinger, Wolfgang},
booktitle = {Virtual Reality},
publisher = {IEEE},
series = {VR '05},
year = {2005},
month = {Mar},
pages = {83-89},
doi = {https://doi.org/10.1109/VR.2005.1492757},
pdf = {papers/hedgehog.pdf},
teaser = {teasers/hedgehog.png},
abstract = {Existing commercial technologies do not adequately meet the requirements for tracking in fully-enclosed VR displays. We present the Hedgehog, which overcomes several limitations imposed by existing sensors and tracking technology. The tracking system robustly and reliably estimates the 6DOF pose of the device with high accuracy and a reasonable update rate. The system is composed of several cameras viewing the display walls and an arrangement of laser diodes secured to the user. The light emitted from the lasers projects onto the display walls and the 2D centroids of the projections are tracked to estimate the 6DOF pose of the device. The system is able to handle ambiguous laser projection configurations, static and dynamic occlusions of the lasers, and incorporates an intelligent laser activation control mechanism that determines which lasers are most likely to improve the pose estimate. The Hedgehog is also capable of performing auto-calibration of the necessary camera parameters through the use of the SCAAT algorithm. A preliminary evaluation reveals that the system has an angular resolution of 0.01 degrees RMS and a position resolution of 0.2 mm RMS.},
keywords = {3D tracking},
}
@inproceedings{pavlovych2004laser,
title = {Laser Pointers as Interaction Devices for Collaborative Pervasive Computing},
author = {Pavlovych*, Andriy and Stuerzlinger, Wolfgang},
booktitle = {Advances in Pervasive Computing},
publisher = {OCG},
series = {Pervasive '04},
isbn = {978-385403176-5},
year = {2004},
month = {Apr},
pages = {315-320},
url = {http://www.pervasive2004.org},
pdf = {papers/lasers_improved.pdf},
teaser = {teasers/lasers_improved.png},
abstract = {We present a system that supports collaborative interactions for arbitrary environments. The system uses laser pointers as interaction devices and employs a video camera to detect where each laser pointer is pointing. Time-division multiplexing together with a wireless link affords discrimination between laser pointer dots belonging to different pointers. Safety issues with laser pointers are addressed with a new technique. We also discuss how new users can be dynamically added and removed from the system.},
keywords = {pointing, collaboration, laser},
}
@inproceedings{pavlovych2004model,
title = {Model for non-Expert Text Entry Speed on 12-Button Phone Keypads},
author = {Pavlovych*, Andriy and Stuerzlinger, Wolfgang},
booktitle = {{SIGCHI} Conference on Human Factors in Computing Systems},
publisher = {ACM},
series = {CHI '04},
year = {2004},
month = {Apr},
pages = {351-358},
doi = {https://doi.org/10.1145/985692.985737},
pdf = {papers/novicemodel.pdf},
teaser = {teasers/novicemodel.png},
abstract = {In this paper we present a new model for predicting text entry speed on a 12-button mobile phone keypad. The proposed model can predict the performance of novice users. Like other models for text entry, the proposed model includes a movement component based on Fitts' law and a linguistic component based on letter digraph probabilities. It also adds cognitive delay times before key presses and takes into account the fact that Fitts' law cannot model multiple presses of the same key accurately. Finally, we compare the prediction of our model to previously published experimental results, demonstrate that it fits observed results for novices very well, and list some observations about learning.},
keywords = {text entry, mode, novice},
}
@inproceedings{oh2003intelligent,
title = {Intelligent Manipulation Techniques for Conceptual {3D} Design},
author = {Oh*, Ji-Young and Stuerzlinger, Wolfgang},
booktitle = {Human-Computer Interaction},
publisher = {IFIP},
series = {INTERACT '03},
isbn = {978-158603363-7},
year = {2003},
month = {Sep},
pages = {319-326},
url = {https://www.interaction-design.org/literature/conference/proceedings-of-ifip-interact03-human-computer-interaction},
pdf = {papers/legomanip.pdf},
video = {videos/lego.m4v},
teaser = {teasers/legomanip.png},
abstract = {One of the main operations in conceptual 3D design is the rearrangement of single and composite objects. This paper presents a new conceptual 3D design system that affords easy manipulation of composite objects. We discuss several alternative manipulation techniques to separate complex parts off an existing model. Then, we present a new way to move such parts in a 3D scene, as well as an algorithm to place parts at arbitrary locations. Finally, we present and discuss the results of a user study of these manipulation techniques.},
keywords = {3D modeling, 3D positioning, 3D manipulation, lego},
}
@inproceedings{pavlovych2003lesstap,
title = {Less-Tap: A Fast and Easy-to-learn Text Input Technique for Phones},
author = {Pavlovych*, Andriy and Stuerzlinger, Wolfgang},
booktitle = {Graphics Interface},
series = {GI '03},
year = {2003},
month = {Jun},
pages = {97-104},
doi = {https://doi.org/10.20380/GI2003.12},
pdf = {papers/lesstap.pdf},
teaser = {teasers/lesstap.png},
abstract = {A new technique to enter text using a mobile phone keypad, Less-Tap, is described. The traditional touch-tone phone keypad is ambiguous for text input because each button encodes 3 or 4 letters. As in Multitap, our method requires the user to press buttons repeatedly to get a required letter. However, in Less-Tap, letters are rearranged within each button according to their frequency. This way, the most common letters require only one key press.
Unlike dictionary based methods, Less-Tap facilitates the entry of arbitrary words. Unlike LetterWise and T9, Less-Tap allows entering text without having to visually verify the result, after some initial training. For English, Less-Tap requires an average of 1.5266 keystrokes per character (vs. 2.0342 in Multitap).
We conducted a user study to compare Less-Tap against Multitap. Each participant had three 20-minute sessions with each technique. The mean entry speed was 9.5% higher with the new technique.},
keywords = {text entry, mobile device},
}
@inproceedings{oh2002laser,
title = {Laser Pointers as Collaborative Pointing Devices},
author = {Oh*, Ji-Young and Stuerzlinger, Wolfgang},
booktitle = {Graphics Interface},
series = {GI '02},
year = {2002},
month = {May},
pages = {141-149},
doi = {https://doi.org/10.20380/GI2002.17},
pdf = {papers/multi_laser.pdf},
video = {videos/laser_multi.mp4},
teaser = {teasers/multi_laser.png},
abstract = {Single Display Groupware (SDG) is a research area that focuses on providing collaborative computing environments. Traditionally, most hardware platforms for SDG support only one person interacting at any given time, which limits collaboration. In this paper, we present laser pointers as input devices that can provide concurrent input streams ideally required to the SDG environment.
First, we discuss several issues related to utilization of laser pointers and present the new concept of computer controlled laser pointers. Then we briefly present a performance evaluation of laser pointers as input devices and a baseline comparison with the mouse according to the ISO 9241-9 standard.
Finally, we describe a new system that uses multiple computer controlled laser pointers as interaction devices for one or more displays. Several alternatives for distinguishing between different laser pointers are presented, and an implementation of one of them is demonstrated with SDG applications.},
keywords = {laser, pointing, collaboration},
}
@inproceedings{stuerzlinger2002efficient,
title = {Efficient Manipulation of Object Groups in Virtual Environments},
author = {Stuerzlinger, Wolfgang and Smith*, Graham},
booktitle = {Virtual Reality},
publisher = {IEEE},
series = {VR '02},
year = {2002},
month = {Mar},
pages = {251-258},
doi = {https://doi.org/10.1109/VR.2002.996529},
pdf = {papers/mive_vr2002.pdf},
video = {videos/mive_duals.mp4},
teaser = {teasers/mive_vr2002.png},
abstract = {We describe simple techniques for object group manipulation, an important operation in user interaction with a virtual environment. All presented manipulation techniques exploit constraints to simplify user interaction. The techniques are based on how humans perceive groups and afford direct manipulation of such groups. Furthermore, we introduce two new intuitive ways to create a whole group of objects: drag-add and random drag-add. Finally, we present an evaluation of the presented techniques.},
keywords = {group selection, 3D positioning, 3D manipulation},
}
@inproceedings{robinson2002ivy,
title = {IVY: The Immersive Visual Environment at York},
author = {Robinson, Matt and Laurence, Jeff R. and Zacher, James and Hogue*, Andrew and Allison, Robert and Harris, Laurence and Jenkin, Michael and Stuerzlinger, Wolfgang},
booktitle = {International Immersive Projection Technology Symposium},
series = {IPT '02},
year = {2002},
month = {Mar},
numpages = {6},
url = {http://vr.iao.fhg.de/ipt-egve},
pdf = {papers/ivy_ipt2002.pdf},
teaser = {teasers/ivy_ipt2002.png},
abstract = {Given the limitations of head mounted display systems, there has been significant interest in the development of large-scale virtual environments such as video walls, immersive project displays, and similar devices. Although these devices do provide a wide-field visual display, very few of these devices are completely immersive as the user may view the visual world or they may be tethered to the real world via tracking systems. In this paper we present the motivation and design of IVY: The Immersive Visual environment currently under construction at Y ork University (IVY).},
keywords = {cave, immersive display system, 3D tracking},
}
@inproceedings{robinson2001growing,
title = {Growing IVY: Building the Immersive Visual Environment at York},
author = {Robinson, Matt and Laurence, Jeff R. and Zacher, James and Hogue*, Andrew and Allison, Robert and Harris, Laurence and Jenkin, Michael and Stuerzlinger, Wolfgang},
booktitle = {11th International Conference on Artificial Reality and Tele-existence},
series = {ICAT '01},
year = {2001},
month = {Dec},
pages = {85-89},
url = {http://icat.vrsj.org/ICAT2001},
pdf = {papers/ivy_icat2001.pdf},
teaser = {teasers/ivy_icat2001.png},
abstract = {When we move about within our environment, we are presented with a range of cues to our motion. Virtual reality systems attempt to simulate these various sensory cues. IVY – the Immersive Visual environment at York – is a virtual environment being constructed at York University to investigate aspects of human perception and to examine the relative importance of various visual and non-visual cues to the generation of an effective virtual environment. This paper describes the movation behind the design of IVY, and describes the design of the essential hardware and software components.},
keywords = {cave, immersive display system, 3D tracking},
}
@inproceedings{smith2001integration,
title = {Integration of Constraints into a VR Environment},
author = {Smith*, Graham and Stuerzlinger, Wolfgang},
booktitle = {Virtual Reality International Conference, Laval Virtual},
series = {VRIC '01},
isbn = {978-295157300-0},
year = {2001},
month = {Jun},
pages = {103-110},
pdf = {papers/mive_vric2001.pdf},
video = {videos/mive_creation.mp4},
teaser = {teasers/mive_vric2001.png},
abstract = {Interactive Virtual Reality applications are in general complex and non-intuitive. One fundamental problem is that manipulation of 3D objects is very difficult for non-experienced users. We describe a constraint based 3D scene construction system that exploits human intuitions to restrict object placement and interactions. In particular, we focus on the constraints themselves by describing how they are defined, and how they are used within a scene. Several different types of constraints are discussed, including virtual constraints, which decouple the constraint areas from the geometry of an object, and negative constraints, which restrict object placements within certain volumes of space. Furthermore, we discuss techniques that can be used to automatically generate constraints for most geometric objects, which makes incorporating new objects into the system much easier. Finally, we argue that the presented constraint techniques can be incorporated into existing Virtual Reality systems to make interactions easier.},
keywords = {3D manipulation, 3D positioning, constraints},
}
@inproceedings{smith2001scenedevices,
title = {{3D} Scene Manipulation with {2D} Devices and Constraints},
author = {Smith*, Graham and Salzman*, Tim and Stuerzlinger, Wolfgang},
booktitle = {Graphics Interface},
series = {GI '01},
year = {2001},
month = {Jun},
pages = {135-142},
doi = {https://doi.org/10.20380/GI2001.16},
pdf = {papers/mive_gi2001.pdf},
video = {videos/mive_resize.mp4},
teaser = {teasers/mive_gi2001.png},
abstract = {Content creation for computer graphics applications is a laborious process that requires skilled personnel. One fundamental problem is that manipulation of 3D objects with 2D user interfaces is very difficult for non-experienced users.
In this paper, we introduce a new system that uses constraints to restrict object motion in a 3D scene, making interaction much simpler and more intuitive. We compare three different 3D scene manipulation techniques based on a 2D user interface. We show that the presented techniques are significantly more efficient than commonly used solutions. To our knowledge, this is the first evaluation of 3D manipulation techniques with 2D devices and constraints.},
keywords = {3D manipulation, 3D positioning, constraints},
}
@inproceedings{smith2001sceneconstraints,
title = {{3D} Scene Manipulation with Constraints},
author = {Smith*, Graham and Salzman*, Tim and Stuerzlinger, Wolfgang},
booktitle = {Virtual and Augmented Architecture},
series = {VAA '01},
year = {2001},
month = {Jun},
pages = {35-46},
doi = {https://doi.org/10.1007/978-1-4471-0337-0_4},
pdf = {papers/mive_vaa2001.pdf},
teaser = {teasers/mive_vaa2001.png},
abstract = {Content creation for computer graphics applications is a laborious process that requires skilled personnel. One fundamental problem is that manipulation of 3D objects with 2D user interfaces is very difficult for non-experienced users.
In this paper, we introduce a new system that uses constraints to restrict object motion in a 3D scene, making interaction much simpler and more intuitive. We compare three different 3D scene manipulation techniques based on a 2D user interface. We show that the presented techniques are significantly more efficient than commonly used solutions. To our knowledge, this is the first evaluation of 3D manipulation techniques with 2D devices and constraints.},
keywords = {3D manipulation, 3D positioning, constraints},
}
@inproceedings{smith2001utility,
title = {On the Utility of Semantic Constraints},
author = {Smith*, Graham and Stuerzlinger, Wolfgang},
booktitle = {Virtual Environments},
publisher = {Eurorgraphics},
series = {EGVE '01},
year = {2001},
month = {May},
pages = {41-50},
doi = {https://doi.org/10.2312/EGVE/EGVE01/041-050},
pdf = {papers/mive_egve2001.pdf},
video = {videos/mive_pipes.mp4},
teaser = {teasers/mive_egve2001.png},
abstract = {Content creation for computer graphics applications is a laborious process that requires skilled personnel. One fundamental problem is that manipulation of 3D objects with 2D user interfaces is very difficult for non-experienced users. In this paper, we describe a system that uses semantic constraints to restrict object motion in a 3D scene, making interaction much simpler and more intuitive. We compare three different levels of semantic constraints in a 3D scene manipulation program with a 2D user interface. We show that the pr esented techniques are significantly more efficient than alternate techniques, which do not use semantics in their constraints. To our knowledge, this is the first evaluation of 3D manipulation techniques with 2D devices and constraints.},
keywords = {3D manipulation, 3D positioning, constraints},
}
@inproceedings{salzman2001unconstrained,
title = {Unconstrained vs. Constrained {3D} Scene Manipulation},
author = {Salzman*, Tim and Stachniak*, Szymon and Stuerzlinger, Wolfgang},
booktitle = {Engineering for Human-Computer Interaction},
publisher = {Springer},
series = {EHCI '01},
year = {2001},
month = {May},
volume = {LNCS 2254},
pages = {207-219},
doi = {https://doi.org/10.1007/3-540-45348-2_19},
pdf = {papers/mive_ehci2001.pdf},
video = {videos/mive_playing.mp4},
teaser = {teasers/mive_ehci2001.png},
abstract = {Content creation for computer graphics applications is a very time-consuming process that requires skilled personnel. Many people find the manipulation of 3D object with 2D input devices non-intuitive and difficult. We present a system, which restricts the motion of objects in a 3D scene with constraints. In this publication we discuss an experiment that compares two different 3D manipulation interfaces via 2D input devices. The results show clearly that the new constraint-based interface performs significantly better than previous work.},
keywords = {3D manipulation, 3D positioning, constraints},
}
@inproceedings{stuerzlinger1999imaging,
title = {Imaging all Visible Surfaces},
author = {Stuerzlinger, Wolfgang},
booktitle = {Graphics Interface},
series = {GI '99},
year = {1999},
month = {Jun},
pages = {115-122},
doi = {https://doi.org/10.20380/GI1999.16},
pdf = {papers/imgvissurf.pdf},
teaser = {teasers/imgvissurf.png},
abstract = {Today many systems exist to generate geometric models of existing scenes and objects. However, very few systems store accurate data about surface appearance such as colors and textures. One way to capture surface texture data is to record a series of images that, collectively, captures all visible surfaces of the object. Finding good viewpoints for this task is not easy.
This paper presents a new heuristic method to find a good set of viewpoints for a given geometric model. Taking images from the computed viewpoints will show every visible part of every surface at least once. The approach uses a hierarchical visibility algorithm to preprocess the scene. A good set of viewing regions is identified with simulated annealing and then good viewpoints are derived. Results and visualizations of the computed solutions are presented.},
keywords = {3D scanning, next-best view, visibility},
}
@inproceedings{goesele1999semantic,
title = {Semantic Constraints for Scene Manipulation},
author = {Goesele*, Michael and Stuerzlinger, Wolfgang},
booktitle = {SCCG: Spring Conference in Computer Graphics},
series = {SCCG '99},
commented-isbn = {978-802231357-5},
year = {1999},
month = {Apr},
pages = {140-146},
url = {http://sccg.sk/1999_min},
pdf = {papers/semconstr.pdf},
teaser = {teasers/semconstr.png},
abstract = {The creation of object models for computer graphics applications, such as interior design or the generation of animations is a labour-intensive process. Today's computer aided design (CAD) programs address the problem of creating geometric object models quite well. But almost all users find common tasks, such as quickly furnishing a room, hard to accomplish. One of the basic reasons is that manipulation of objects often does not yield the expected results.
This paper presents a new system that exploits knowledge about natural behavior of objects to provide simple and intuitive interaction techniques for object manipulation. Semantic constraints are introduced, which encapsulate such `common knowledge' about objects. Furthermore, we present a new way to automatically infer a scene hierarchy by dynamically grouping objects according to their constraint relationships.},
keywords = {3D manipulation, 3D positioning, constraints},
}
@inproceedings{aliaga1999mmr,
title = {MMR: An Interactive Massive Model Rendering System Using Geometric and Image-Based Acceleration},
author = {Aliaga*, Daniel and Cohen*, Jon and Wilson*, Andrew and Baker*, Eric and Zhang*, Hansong and Erikson*, Carl and Hoff*, Kenny and Hudson*, Tom and Stuerzlinger, Wolfgang and Bastos*, Rui and Whitton, Mary and Brooks, Fred and Manocha, Dinesh},
booktitle = {Symposium on Interactive {3D} Graphics},
publisher = {ACM},
series = {I3D '99},
year = {1999},
month = {Apr},
pages = {199-206},
doi = {https://doi.org/10.1145/300523.300554},
pdf = {papers/mmr.pdf},
teaser = {teasers/mmr.png},
abstract = {We present a system for rendering very complex 3D models at interactive rates. We select a subset of the model as preferred viewpoints and partition the space into virtual cells. Each cell contains near geometry, rendered using levels of detailand visibility culling, and far geometry, rendered as a textured depth mesh. Our system automatically balances the screen-space errors resulting from geometric simplification with those from textured-depth-mesh distortion. We describe our prefetching and data management schemes, both crucial for models significantly larger than available system memory. We have successfully used our system to accelerate walkthroughs of a 13 million triangle model of a large coal-fired power plant and of a 1.7 million triangle architectural model. We demonstrate the walkthrough of a 1.3 GB power plant model with a 140 MB cache footprint.},
keywords = {rendering, real-time},
}
@comment{c, c={leave the "_stuerzlinger" in the ID to enable umlaut-free search!}}
@inproceedings{raskar_stuerzlinger1998efficient,
title = {Efficient Image Generation for Multiprojector and Multisurface Displays},
author = {Raskar*, Ramesh and Cutts*, Matt and Welch, Greg and Stürzlinger, Wolfgang},
booktitle = {Rendering Techniques},
publisher = {Springer},
series = {EGSR '98},
year = {1998},
month = {Jun},
pages = {139-144},
doi = {https://doi.org/10.1007/978-3-7091-6453-2_13},
pdf = {papers/multisurf.pdf},
teaser = {teasers/multisurf.png},
abstract = {We describe an efficient approach to rendering a perspectively correct image on a potentially irregular display surface that may be illuminated with one or more distinct devices. The first pass of the technique generates an image of the desired graphics model using conventional rendering. The second pass projects that image as a texture onto a model of the display surface, then re-renders the textured display surface model from the viewpoint of each display device. The algorithm scales with the complexity of the display surface, and is constant with respect to the complexity of the graphics model.},
keywords = {rendering, real-time, projector},
}
@inproceedings{stuerzlinger1997interactive,
title = {Interactive Rendering of Globally Illuminated Glossy Scenes},
author = {Stürzlinger, Wolfgang and Bastos*, Rui},
booktitle = {Rendering Techniques},
publisher = {Springer},
series = {EGSR '97},
year = {1997},
month = {Jun},
pages = {93-102},
doi = {https://doi.org/10.1007/978-3-7091-6858-5_9},
pdf = {papers/fastglos.pdf},
teaser = {teasers/fastglos.png},
abstract = {Global illumination simulates all transfers of light in a scene. The results of the simulation are then used to generate photo-realistic images. Scenes with diffuse surfaces only can be displayed in real-time using the results of radiosity methods. Images of scenes with more general surfaces are created with methods based on ray tracing but do not achieve interactive frame rates.This paper presents a new algorithm for the display of globally illuminated scenes at interactive speeds. A photon tracing phase computes an approximation to the global illumination. The rendering phase splats the contribution of each photon hit onto the corresponding surface taking reflectance properties and viewing direction into account. Results demonstrate that this method allows to render images of globally illuminated scenes with glossy surfaces at interactive frame rates.},
keywords = {rendering, real-time, global illumination},
}
@inproceedings{stuerzlinger1996generic,
title = {A Generic Interface to Colors, Materials, and Textures},
author = {Stürzlinger, Wolfgang},
booktitle = {Compugraphics},
publisher = {GRASP},
series = {Compugraphics '96},
isbn = {978-972834201-2},
year = {1996},
month = {Dec},
pages = {192-200},
pdf = {papers/genmat.pdf},
teaser = {teasers/genmat.png},
abstract = {Material models predict the reflection of light by surfaces in a scene. Many models have been proposed, all with different scope of effects and different parameters. The same holds for color models and texture definitions. Most computer graphics systems implement only one model with a minimal interface. If a different model is to be integrated this interface needs to be restructured which results in many code changes in the whole system.
This work presents a new approach to a generic interface to colors and materials. By enumerating all possible operations on these graphics objects an interface for reusable and portable code is defined. A seamless integration of textured surfaces into a computer graphics system is made possible by generic texture trees which implement the generic material interface. This portable definition of textures is realized via a tree of texture nodes and texture generators.},
keywords = {rendering, ray tracing},
}
@inproceedings{stuerzlinger1996bounding,
title = {Bounding Volume Construction Using Point Clouds},
author = {Stürzlinger, Wolfgang},
booktitle = {Spring Conference on Computer Graphics},
series = {SCCG '96},
isbn = {978-802231032-1},
year = {1996},
month = {Jun},
pages = {239-246},
url = {http://sccg.sk/1996_min},
pdf = {papers/pcloud.pdf},
teaser = {teasers/pcloud.png},
abstract = {Bounding volumes are used to optimize many graphic algorithms. They permit to decide quickly if a more exact test is likely to succeed or not. The exact test is only applied if the bounding volume test succeeds, which saves time in most cases. Two of the most prominent applications are ray tracing and collision detection.
This paper presents a new method to calculate tight bounding volumes for primitives under arbitrary transformations and hierarchical scene descriptions. An optimized form of storing a convex hull is presented which allows efficient calculation of the bounding volume type used for later processing. Results are shown for the ray tracing of cyclic CSG-graphs used to render plants and other natural phenomena.},
keywords = {rendering, ray tracing, bounding volumes},
}
@comment{c, c={leave the "_stuerzlinger" in the ID to enable umlaut-free search!}}
@inproceedings{burger_stuerzlinger1995immersive,
title = {Immersive Simulation for Computer Vision},
author = {Burger, Wilhelm and Barth, Matthew J. and Stürzlinger, Wolfgang},
booktitle = {Visual Modules},
publisher = {Oldenbourg Press},
isbn = {978-348623476-3},
year = {1995},
month = {May},
pages = {160-168},
pdf = {papers/vision.pdf},
teaser = {teasers/vision.png},
abstract = {Synthetic imagery has often been considered unsuitable for demonstrating the performance of vision algorithms and systems. We argue that (despite many remaining difficulties) simulation and computer graphics are at a point today that make them extremely useful for evaluation and training, even for complex outdoor applications. This is particularly valuable for autonomous and robotics applications, where the lack of suitable training data and ground truth information is a severe bottleneck. Extensive testing in a synthetic environment should become an integral part of the systems development and evaluation process to reduce the possibility of failure in the real word. We describe ongoing efforts towards the development of an "Immersive Perception Simulator" and discuss some of the specific problems involved.},
keywords = {rendering, computer vision, ray tracing, real-time},
}
@comment{c, c={leave the "_stuerzlinger" in the ID to enable umlaut-free search!}}
@inproceedings{schaufler_stuerzlinger1995exact,
title = {Exact and Error Bounded Approximations of Local Illumination},
author = {Schaufler*, Gernot and Stürzlinger, Wolfgang},
booktitle = {Compugraphics},
publisher = {GRASP},
series = {Compugraphics '95},
isbn = {978-972834200-5},
year = {1995},
month = {Dec},
pages = {327-333},
commented-url = {http://www.gup.uni-linz.ac.at:8001/staff/schaufler/papers/local},
pdf = {papers/localillum.pdf},
teaser = {teasers/localillum.png},
abstract = {Recent approaches to realistic image synthesis split the rendering process into two passes. The first pass calculates an approximate global illumination solution, the second produces an image of high quality (from a user selected view point) using the solution obtained in the first pass by applying the local illumination model to each surface point visible through each pixel. This paper presents a new method how to compute the visible surfaces as seen from a surface point - the hemisphere projection. This method allows the exact evaluation of the local illumination model and facilitates the fast and accurate computation of form factors taking occlusion into account. Using the hemisphere projection an exact local pass solution can be obtained. In addition the hemisphere projection can be used to compute an approximation of a point's local illumination to within given error bounds in significantly less time.},
keywords = {rendering, global illumination},
}
@comment{c, c={unfortunate-dup, quasi-parallel, but independent submission by different authors}}
@inproceedings{stuerzlinger1995load,
title = {Load Balancing for a Parallel Radiosity Algorithm},
author = {Stürzlinger, Wolfgang and Schaufler*, Gernot and Volkert, Jens},
booktitle = {Symposium on Parallel Rendering},
publisher = {ACM & IEEE},
series = {PRS '95},
year = {1995},
month = {Oct},
pages = {39-45},
doi = {https://doi.org/10.1145/218327.218335},
pdf = {papers/loadbalancing.pdf},
teaser = {teasers/loadbalancing.png},
abstract = {The radiosity method models the interaction of light between diffuse surfaces, thereby accurately predicting global illumination effects. Due to the high computational effort to calculate the transfer of light between surfaces and the memory requirements for the scene description, a distributed, parallelized version of the algorithm is needed for scenes consisting of thousands of surfaces.
We present several load distribution schemes for such a parallel algorithm which includes progressive refinement and adaptive subdivision for fast solutions of high quality. The load is distributed before the calculations in a static way. During the computation the load is redistributed dynamically to make up for individual differences in processor loads. The dynamic load balancing scheme never generates more data packets than the original algorithm and avoids overloading processors through actions taken by the scheme.},
keywords = {rendering, parallel, global illumination},
}
@comment{c, c={unfortunate-dup, quasi-parallel, but independent submission by different authors}}
@inproceedings{stuerzlinger1995strategies,
title = {Load Balancing Strategies for a Radiosity Algorithm},
author = {Stürzlinger, Wolfgang and Schaufler*, Gernot and Volkert, Jens},
booktitle = {High Performance Computing Symposium},
series = {HPCS '95},
isbn = {978-292131612-5},
year = {1995},
month = {Jul},
pages = {217-228},
url = {http://hpcs.ca},
pdf = {papers/loadbalancing1.pdf},
teaser = {teasers/loadbalancing1.png},
abstract = {The radiosity method models the interaction of light between diffuse surfaces, thereby accurately predicting global illumination effects. Due to the high computational effort to calculate the transfer of light between surfaces and the memory requirements for the scene description, a distributed, parallelized version of the algorithm is needed for scenes consisting of thousands of surfaces.
We present several load distribution schemes for such a parallel algorithm which includes progressive refinement and adaptive subdivision for fast solutions of high quality. The load is distributed before the calculations in a static way. During the computation the load is redistributed dynamically to make up for individual differences in processor loads. The dynamic load balancing scheme never generates more data packets than the original algorithm and avoids overloading processors through actions taken by the scheme.},
keywords = {rendering, parallel, global illumination},
}
@inproceedings{stuerzlinger1995exact,
title = {Exact Projections onto the Hemisphere},
author = {Stürzlinger, Wolfgang},
booktitle = {Spring Conference on Computer Graphics},
series = {SCCG '95},
isbn = {978-802330344-5},
year = {1995},
month = {May},
pages = {31-38},
pdf = {papers/hemisphere.pdf},
teaser = {teasers/hemisphere.png},
abstract = {Recent approaches to realistic image synthesis have split the rendering process into two passes. The first pass calculates an approximate global illumination solution, the second generates an image of high quality from a given view point using the illumination solution obtained in the first pass.
This paper discusses a new method for projecting polygons onto the hemisphere which is the central operation performed for each pixel during the local pass. The method calculates an exact hemispherical projection of all polygons considering occlusion. The chosen representation of the projected polygons facilitates the fast and accurate computation of formfactors with regard to the projection center.
The new hemispherical projection method is used to obtain an exact local pass solution.},
keywords = {rendering, global illumination},
footnote = {Newer work such as "Visibility Silhouettes for Semi-Analytic Spherical Integration", http://dx.doi.org/10.1111/cgf.12257 and "Vectorization for Fast, Analytic, and Differentiable Visibility", https://doi.org/10.1145/3452097 uses the same idea of decomposing projections into convex polygons.},
}
@comment{c, c={leave the "_stuerzlinger" in the ID to enable umlaut-free search!}}
@inproceedings{schaufler_stuerzlinger1995generating,
title = {Generating Multiple Levels of Detail for Polygonal Geometry Models},
author = {Schaufler*, Gernot and Stürzlinger, Wolfgang},
booktitle = {Virtual Environments},
publisher = {Springer},
series = {EGVE '95},
year = {1995},
month = {Jan},
pages = {33-41},
doi = {https://doi.org/10.1007/978-3-7091-9433-1_4},
commented-url = {http://www.gup.uni-linz.ac.at:8001/staff/schaufler/papers/lods},
pdf = {papers/lod.pdf},
teaser = {teasers/lod.png},
abstract = {This paper presents a new method for solving the following problem: Given a polygonal model of some geometric object generate several more and more approximative representations of this object containing less and less polygons. The idea behind the method is that small detail in the model is represented by many spatially close points. A hierarchical clustering algorithm is used to generate a hierarchy of clusters from the vertices of the object's polygons. The coarser the approximation the more points are found to lie within one cluster of points. Each cluster is replaced by one representative point and polygons are reconstructed from these points. A static detail elision algorithm was implemented to prove the practicability of the method. This paper shows examples of approximations generated from different geometry models, pictures of scenes rendered by a detail elision algorithm and timings of the method at work.},
keywords = {rendering, real-time},
}
@inproceedings{stuerzlinger1994parallel2,
title = {Parallel Visibility Calculations for Parallel Radiosity},
author = {Stürzlinger, Wolfgang and Wild*, Christoph},
booktitle = {Parallel Processing: CONPAR — VAPP VI},
publisher = {Springer},
series = {CONPAR '94},
year = {1994},
month = {Sep},
volume = {LNCS 854},
pages = {405-413},
doi = {https://doi.org/10.1007/3-540-58430-7_36},
pdf = {papers/parvis.pdf},
teaser = {teasers/parvis.png},
abstract = {The radiosity method models the interaction of light between diffuse reflecting surfaces, thereby accurately predicting global illumination effects. Due to the high computational effort to calculate the transfer of light between surfaces and the memory requirements for the scene description, a distributed, parallelized verison of the algorithm is needed for scenes consisting of thousands of surfaces. We present a distributed, parallel progressive radiosity algorithm. Then we parallelize the visibility calculations and analyze the results.},
keywords = {rendering, parallel, visibility, global illumination},
}
@inproceedings{stuerzlinger1994adaptive,
title = {Adaptive Mesh Refinement with Discontinuities for the Radiosity Method},
author = {Stürzlinger, Wolfgang},
booktitle = {Photorealistic Rendering Techniques},
publisher = {Springer},
series = {EGSR '94},
year = {1995},
commented-year = {1994},
month = {Aug},
commented-month = {Jun},
pages = {244-253},
doi = {https://doi.org/10.1007/978-3-642-87825-1_18},
pdf = {papers/disco.pdf},
teaser = {teasers/disco.png},
abstract = {The radiosity method simulates the interaction of light between diffuse reflecting surfaces, thereby accurately predicting global illumination effects. One of the main problems of the original algorithm is the inability to represent correctly the shadows cast onto surfaces. Adaptive subdivision techniques were tried but the results are not good enough for general purposes. The conceptually different discontinuity meshing algorithm produces exact pictures of shadow boundaries but is computationally expensive. The newly presented adaptive discontinuity meshing method combines the speed of adaptive subdivision with the quality of the discontinuity meshing method.},
keywords = {rendering, global illumination},
}
@inproceedings{stuerzlinger1994optimization,
title = {Two Optimization Methods for Ray Tracing},
author = {Stürzlinger, Wolfgang and Tobler*, Robert},
booktitle = {Spring School on Computer Graphics},
series = {SCCG '94},
isbn = {978-802230801-4},
year = {1994},
month = {Jun},
pages = {104-107},
pdf = {papers/rtopt.pdf},
teaser = {teasers/rtopt.png},
abstract = {Raytracing is a method to produce photo-realistic pictures. For each pixel of an image one ray is shot to find the object, which determines the color of the pixel. Rays are also used to simulate shadows and reflections. Previously bounding volume hierarchies have been used to speed raytracing. A new method to speed the traversal of a bounding volume hierarchy is presented. Optimisation methods to find the intersection point between the ray and the scene have been introduced previously. A new algorithm based on cylinders is presented also.},
keywords = {rendering, ray tracing},
}
@inproceedings{stuerzlinger1992radiosity,
title = {Radiosity with Voronoi Diagrams},
author = {Stürzlinger, Wolfgang},
booktitle = {Third Eurographics Workshop on Rendering},
publisher = {Consolidation Express},
series = {EGSR '92},
isbn = {978-189785100-5},
year = {1992},
month = {May},
pages = {169-177},
pdf = {papers/radvor.pdf},
teaser = {teasers/radvor.png},
abstract = {Current radiosity methods rely on the calculation of geometric factors, known as form-factors which describe energy exchange between the surfaces of an environment. The most widely used method for storing the illumination across a surface is a mesh of quadrilaterals and/or triangles. For more exact computations these meshes need to be subdivided adaptively. The subdivision methods create artifacts which have visible results. A new technique for storing the surface is presented, based on Voronoi diagrams, which are well suited for the task, and can be subdivided without introducing artifacts.},
keywords = {rendering, global illumination},
}
@comment{************************other_publications************************}
@misc{bashar2026vacgazecontroller,
title = {Effects of Visual Depth on Vergence–Accommodation Conflict in Gaze- and Controller-Based Selection in Virtual Reality},
author = {Bashar*, Mohammad Raihanul and Amini*, Mohammadreza and Mutasim, Aunnoy K. and Barrera Machuca, Mayra D. and Stuerzlinger, Wolfgang and Batmaz, Anil Ufuk},
booktitle = {Extended Abstracts of the CHI Conference on Human Factors in Computing Systems},
publisher = {ACM},
series = {CHI EA '26},
howpublished = {Extended Abstract},
year = {2026},
month = {Apr},
articleno = {250},
numpages = {6},
doi = {https://doi.org/10.1145/3772363.3798344},
pdf = {papers/vacgazecontroller.pdf},
abstract = {The vergence–accommodation conflict (VAC) in stereoscopic head-mounted displays is known to affect depth perception and interaction performance. Prior studies have examined its impact on a controller, but it remains unclear how the VAC affects gaze pointing in Virtual Reality. Here, we investigate gaze- and controller-based 3D target selection under varying depth conditions. Results show that gaze is more sensitive to depth variation, exhibiting longer movement times, higher variability along the task axis, and lower throughput compared to controller-based interaction. "Variation in Diopter" Fitts' law modeling further indicates greater depth-dependent variability for gaze input. Despite these differences, perceived usability and workload were comparable. These findings suggest that the VAC affects pointing modalities differently, which should be considered when designing gaze-enabled 3D interfaces.},
keywords = {eye gaze, 3D pointing},
}
@misc{motoe2026steeringpreview,
title = {Deriving Steering Time Models for Paths with Corners of Varying Curvature Based on Preview-Based Velocity Control},
author = {Motoe*, Koyo and Kasahara*, Nobuhito and Yamanaka, Shota and Stuerzlinger, Wolfgang and Miyashita, Homei},
booktitle = {Extended Abstracts of the CHI Conference on Human Factors in Computing Systems},
publisher = {ACM},
series = {CHI EA '26},
howpublished = {Extended Abstract},
year = {2026},
month = {Apr},
articleno = {204},
numpages = {6},
doi = {https://doi.org/10.1145/3772363.3798500},
pdf = {papers/steeringpreview.pdf},
abstract = {Steering operations, such as menu navigation and drawing, constitute a fundamental GUI interaction. The conventional Steering Law estimates movement times by accumulating the local width of the path, but it suffers from limited predictive accuracy for paths with varying curvature. In contrast, humans tend to adjust their speed by anticipating the path ahead (e.g., when driving). This study proposes a new Preview-based Model, which integrates geometric properties with visual constraints further along the path. Our experimental results show that our model achieved a higher adjusted R^2 (0.983) on curve-included paths than existing models. Furthermore, a simplified formulation without parameter tuning also exhibited comparable accuracy (adjusted R^2 = 0.972), confirming its effectiveness as a practical difficulty metric.},
keywords = {steering, lasso},
}
@misc{hu2025exploringgazesteering,
title = {Exploring and Modeling Gaze-Based Steering Behavior in Virtual Reality},
author = {Hu*, Xuning and Zhang*, Yichuan and Wei*, Yushi and Li, Yue and Stuerzlinger, Wolfgang and Liang, Hai-Ning},
booktitle = {Extended Abstracts of the CHI Conference on Human Factors in Computing Systems},
publisher = {ACM},
series = {CHI EA '25},
howpublished = {Extended Abstract},
year = {2025},
month = {Apr},
articleno = {260},
pages = {1-8},
doi = {https://doi.org/10.1145/3706599.3720273},
pdf = {papers/exploringgazesteering.pdf},
abstract = {Gaze-based interaction is a common input method in virtual reality (VR). Eye movements, such as fixations and saccades, result in different behaviors compared to other input methods. Previous studies on selection tasks showed that, unlike the mouse, the human gaze is insensitive to target distance and does not fully utilize target width due to the characteristics of saccades and micro-saccades of the eyes. However, its application in steering tasks remains unexplored. Since steering tasks are widely used in VR for menu adjustments and object manipulation, this study examines whether the findings from selection tasks apply to steering tasks. We also model and compare the Steering Law based on eye movement characteristics. To do this, we use data on movement time, average speed, and re-entry count. Our analysis investigates the impact of path width and length on performance. This work proposes three candidate models that incorporate gaze characteristics, which achieve a superior fit (R² > 0.964) compared to the original Steering Law, improving the accuracy of time prediction, AIC, and BIC by 7%, 26%, and 10%, respectively. These models offer valuable insights for game and interface designers who implement gaze-based controls in VR environments.},
keywords = {eye gaze, steering},
}
@misc{bashar2025depth3dsketch,
title = {Depth3DSketch: Freehand Sketching Out of Arm's Reach in Virtual Reality},
author = {Bashar*, Mohammad Raihanul and Amini*, Mohammadreza and Stuerzlinger, Wolfgang and Sarac, Mine and Pfeuffer, Ken and Barrera Machuca, Mayra D. and Batmaz, Anil Ufuk},
booktitle = {Extended Abstracts of the CHI Conference on Human Factors in Computing Systems},
publisher = {ACM},
series = {CHI EA '25},
howpublished = {Extended Abstract},
year = {2025},
month = {Apr},
articleno = {175},
pages = {1-8},
doi = {https://doi.org/10.1145/3706599.3719717},
pdf = {papers/depth3dsketch.pdf},
abstract = {Due to the increasing availability and popularity of virtual reality (VR) systems, 3D sketching applications have also boomed. Most of these applications focus on peripersonal sketching, e.g., within arm's reach. Yet, sketching in larger scenes requires users to walk around the virtual environment while sketching or to change the sketch scale repeatedly. This paper presents Depth3DSketch, a 3D sketching technique that allows users to sketch objects up to 2.5 m away with a freehand sketching technique. Users can select the sketching depth with three interaction methods: using the joystick on a single controller, the intersection from two controllers, or the intersection from the controller ray and the user's gaze. We compared these interaction methods in a user study. Results show that users preferred the joystick to select visual depth, but there was no difference in user accuracy or sketching time between the three methods.},
keywords = {eye gaze, 3D modeling, depth selection},
}
@misc{lu2025designinguiwithaiworkshop,
title = {Designing and Developing User Interfaces with AI: Advancing Tools, Workflows, and Practices},
author = {Lu*, Yuwen and Jiang*, Yue and Knearem, Tiffany and Kliman-Silver, Clara and Lutteroth, Christof and Nichols, Jeffery and Stuerzlinger, Wolfgang},
booktitle = {Extended Abstracts of the CHI Conference on Human Factors in Computing Systems},
publisher = {ACM},
series = {CHI EA '25},
howpublished = {Extended Abstract},
year = {2025},
month = {Apr},
articleno = {774},
pages = {1-7},
doi = {https://doi.org/10.1145/3706599.3706736},
pdf = {papers/designinguiwithaiworkshop25.pdf},
abstract = {Designing and developing user-friendly interfaces has long been a cornerstone of HCI research. However, we are now at a turning point for how user interfaces can be designed and evaluated with new AI-based models and tools. The latest AI models have shown capabilities to model user behaviors, automate end-user tasks, and even generate user interfaces. We are at a pivotal moment to reflect on current UI design and development practices and discuss the opportunities, challenges, and risks brought by AI. Both incremental improvements and transformative opportunities exist for designers, developers, and the hand-off process in between. In this proposed workshop, we encourage participants to envision AI-enabled UI prototyping tools, workflows, and practices. By bringing together academic researchers and industry practitioners, we aim to identify opportunities to enhance prototyping tools and reshape UI creation workflows for the future as well as discuss potential negative consequences of these tools.},
keywords = {GUI, layout, constraints},
}
@misc{lee2025personalizednav,
title = {Towards Personalized Navigation in XR: A User-Centered Approach to Accessibility},
author = {Lee, Jong-In and Stuerzlinger, Wolfgang},
booktitle = {Workshop on Locomotion and Wayfinding in XR, VR Adjunct Proceedings},
publisher = {IEEE},
series = {LocXR '25},
year = {2025},
month = {Mar},
pages = {241-245},
doi = {https://doi.org/10.1109/VRW66409.2025.00059},
pdf = {papers/personalizednav.pdf},
abstract = {Navigation interfaces in Extended Reality (XR) have traditionally targeted universal solutions that perform well for all users. However, research has shown that users exhibit distinct preferences and performance patterns when using different navigation techniques. This position paper argues for the necessity of and strategies for designing personalized navigation interfaces that accommodate individual differences in spatial abilities, navigation strategies, and accessibility needs. Drawing from empirical findings across multiple user studies investigating locomotion and wayfinding techniques and research in spatial cognition and navigation, we demonstrate how different user groups respond uniquely to navigation interface components. Based on these insights, we propose a framework for developing adaptive navigation interfaces that cater to individual user characteristics while maintaining usability. Furthermore, we discuss opportunities for standardization in user assessment, interface adaptation, and accessibility support. This approach could lead to more inclusive and effective navigation solutions for XR environments.},
keywords = {3D navigation, accessibility, virtual reality, augmented reality},
}
@misc{zhao2024barehandposter,
title = {A Novel Bare-Handed and Widget-based Manipulation Technique for Distant Objects in Virtual Reality},
author = {Zhao*, Di Bill and Stuerzlinger, Wolfgang},
booktitle = {ISMAR Adjunct Proceedings},
series = {ISMAR '24},
howpublished = {Poster},
year = {2024},
month = {Oct},
pages = {525-528},
doi = {https://doi.org/10.1109/ISMAR-Adjunct64951.2024.00152},
commented-pdf = {papers/barehandposter.pdf},
commented-teaser = {teasers/barehandposter.png},
abstract = {Recent advancements in bare-hand tracking technology in VR headsets enable intuitive hand interaction for proximate 3D object manipulation. This paper explores two-handed bare-hand interaction for distant 3D objects, by using the non-dominant hand as an interaction surface to enable adept manipulation of a distant 3D object's position and rotation. A user study demonstrated markedly higher precision in complex manipulation tasks compared to traditional methods while maintaining comparable efficiency and accuracy for simpler tasks. Our method also received a good usability rating, illustrating its user-centric and intuitive nature. We discuss insights on error prevention, constraint integration, and consistent interaction for future VR interaction methods.},
keywords = {3D interaction, 3D manipulation, hand tracking},
}
@misc{jiang2024computationaluiworkshop24,
title = {Computational Methodologies for Understanding, Automating, and Evaluating User Interfaces},
author = {Jiang*, Yue and Lu*, Yuwen and Knearem, Tiffany and Kliman-Silver, Clara and Lutteroth, Christof and Li, Toby Jia-Jun and Nichols, Jeffery and Stuerzlinger, Wolfgang},
booktitle = {Extended Abstracts of the CHI Conference on Human Factors in Computing Systems},
publisher = {ACM},
series = {CHI EA '24},
howpublished = {Extended Abstract},
year = {2024},
month = {May},
articleno = {462},
pages = {1-7},
doi = {https://doi.org/10.1145/3613905.3636316},
pdf = {papers/computationaluiworkshop24.pdf},
abstract = {Building on the success of the first two workshops on user interfaces (UIs) at CHI 2022 and CHI 2023, this workshop aims to advance the research field by further exploring current research trends, such as applying large language models and visual language models.
Previous work has explored computational approaches to understand and adapt UIs using constraint-based optimization models and machine learning-based data-driven approaches. In addition to further delving into these established UI research areas, we aim to trigger the exploration into the application of the latest advancements in general-purpose large language and vision-language models within the UI domain.
We will encourage participants to explore novel methods for understanding, automating, and evaluating UIs.
The proposed workshop seeks to bring together academic researchers and industry practitioners interested in computational approaches for UIs to discuss the needs and opportunities for future user interface algorithms, models, and applications.},
keywords = {GUI, layout, constraints},
}
@misc{kasahara2023crossingthroughput,
title = {Throughput and Effective Parameters in Crossing},
author = {Kasahara*, Nobuhito and Oba*, Yosuke and Yamanaka, Shota and Stuerzlinger, Wolfgang and Miyashita, Homei},
booktitle = {Extended Abstracts of the CHI Conference on Human Factors in Computing Systems},
publisher = {ACM},
series = {CHI EA '23},
howpublished = {Extended Abstract},
year = {2023},
month = {Apr},
articleno = {282},
numpages = {9},
doi = {https://doi.org/10.1145/3544549.3585817},
pdf = {papers/crossingthroughput.pdf},
abstract = {In pointing, throughput TP is used as a performance metric for the input device and operator. Based on the calculation of effective parameters (width We and amplitude Ae), TP should be independent of the speed-accuracy tradeoff. To examine the validity of TP and effective parameters for crossing actions, we conducted two experiments using two established crossing tasks. Our results demonstrate that applying effective parameters to Fitts’ law model improves the fit to the data for mixed biases in both tasks. Besides, we observed that effective parameters smoothed TPs across biases. However, unlike pointing, TP was observed to be unstable across IDs in one task, while was stable across IDs in the other task. Analyzing speed profiles showed that this was likely due to the fact that one of the tasks could be completed with a ballistic movement at low IDs, whereas this was impossible for the other task.},
keywords = {throughput, crossing},
}
@misc{mutasim2023repeatedtyping,
title = {Does Repeatedly Typing the Same Phrase Provide a Good Estimate of Expert Text Entry Performance?},
author = {Mutasim*, Aunnoy K and Hudhud Mughrabi+, Moaaz and Batmaz, Anil Ufuk and Stuerzlinger, Wolfgang},
booktitle = {Extended Abstracts of the CHI Conference on Human Factors in Computing Systems},
publisher = {ACM},
series = {CHI EA '23},
howpublished = {Extended Abstract},
year = {2023},
month = {Apr},
articleno = {90},
numpages = {8},
doi = {https://doi.org/10.1145/3544549.3585647},
pdf = {papers/repeatedtyping.pdf},
abstract = {To identify if novel/unfamiliar keyboard layouts like OPTI can outperform QWERTY, lengthy training through longitudinal studies is typically required. To reduce this logistical bottleneck, a popular approach in the literature requires participants to type the same phrase repeatedly. However, it is still unknown whether this approach provides a good estimate of expert performance. To validate this method, we set up a study where participants were tasked with typing the same phrase 96 times for both OPTI and QWERTY. Results showed that this approach has the potential to estimate expert performance for novel/unfamiliar keyboards faster than the traditional approach with different phrases. Yet, we also found that accurate estimates still require training over several days and, therefore, do not eliminate the need for a longitudinal study. Our findings thus show the need for research on faster, easier, and more reliable empirical approaches to evaluate text entry systems.},
keywords = {text entry, touch typing},
}
@misc{hayatpur2023personalspaces,
title = {Designing Collaborative Parsons Problems with Personal-Spaces},
author = {Hayatpur*, Devamardeep and Helfenbaum*, Tehilla and Xia, Haijun and Stuerzlinger, Wolfgang and Gries, Paul},
booktitle = {Extended Abstracts of the CHI Conference on Human Factors in Computing Systems},
publisher = {ACM},
series = {CHI EA '23},
howpublished = {Extended Abstract},
year = {2023},
month = {Apr},
articleno = {263},
numpages = {7},
doi = {https://doi.org/10.1145/3544549.3585630},
pdf = {papers/personalspaces.pdf},
video = {videos/personalspaces.mp4},
teaser = {teasers/personalspaces.png},
abstract = {Pair programming has proven to be a successful pedagogical technique. However, its effectiveness depends on the frequency and quality of communication of the driver. In this work, we explore an alternative collaboration paradigm that tackles the imbalance in pair programming through Parsons problems: students are given fragments of code out of order and tasked with re-organizing them into the correct order. We then create an interdependence between students by assigning each learner to a different sub-problem in their space, termed Personal-spaces. Students must engage in dialog to negotiate, exchange, and use fragments from the same pool. In an exploratory study with nine pairs of undergraduate students, we find evidence pointing to affordances of different coordination conditions: Personal-spaces promoted ownership and engagement, while Turn taking (akin to pair programming) helped maintain a consistent train of thought. We provide guidelines for design of appropriate problem sets and collaboration tools to structure conversations.},
keywords = {pair programming, parsons problems, programming education},
}
@misc{jiang2023futureuiworkshop,
title = {The Future of Computational Approaches for Understanding and Adapting User Interfaces},
author = {Jiang*, Yue and Lu*, Yuwen and Lutteroth, Christof and Li, Toby Jia-Jun and Nichols, Jeffery and Stuerzlinger, Wolfgang},
booktitle = {Extended Abstracts of the CHI Conference on Human Factors in Computing Systems},
publisher = {ACM},
series = {CHI EA '23},
howpublished = {Extended Abstract},
year = {2023},
month = {Apr},
articleno = {367},
numpages = {5},
doi = {https://doi.org/10.1145/3544549.3573805},
pdf = {papers/futureuiworkshop.pdf},
abstract = {Building on the success of the first workshop on understanding, generating, and adapting user interfaces at CHI2022, this workshop will advance this research area further by looking at existing results and exploring new research directions. Computational approaches for user interfaces have been used in adapting interfaces for different devices, modalities, and user preferences. Recent work has made significant progress in understanding and adapting user interfaces with traditional constraint/rule-based optimization and machine learning-based data-driven approaches; however, these two approaches remain separate. Combining the two approaches has great potential to advance the area but remains under-explored and challenging. Other contributions, such as datasets for potential applications, novel representations of user interfaces, the analysis of human traces, and models with multi-modalities, will also open up future research options. The proposed workshop seeks to bring together researchers interested in computational approaches for user interfaces to discuss the needs and opportunities for future user interface algorithms, models, and applications.},
keywords = {GUI, layout, constraints},
}
@misc{hudhud23effectiveehct,
title = {On the Effectiveness of Virtual Eye-Hand Coordination Training with Head Mounted Displays},
author = {Hudhud Mughrabi+, Moaaz and Kaya+, Furkan and Batmaz, Anil Ufuk and Aliza*, Aliza and Stuerzlinger, Wolfgang and Borazan+, Baris and Tonyali+, Emir and Sarac, Mine},
booktitle = {Workshop on 3D Content Creation for Simulated Training in eXtended Reality, VR Adjunct Proceedings},
publisher = {IEEE},
series = {TrainingXR '23},
year = {2023},
month = {Mar},
numpages = {8},
doi = {https://doi.org/10.1109/VRW58643.2023.00014},
pdf = {papers/effectiveehct.pdf},
abstract = {Eye-hand coordination training systems are used to train participants' motor skills and visual perception. Such systems have already been tested in Virtual Reality, and the results revealed that Head Mounted Displays have the potential to improve the motor training. However, this was only investigated in an hour-long study. In the longitudinal study reported here, we analyzed the motor performance of three participants in ten sessions with three different assessment criteria, where participants were instructed to focus on speed, error rate, or complete the training freely (with no instructions). We also assessed the effective throughput performance of the participants. Our results indicate that participants focusing on speed might need less number of learning sessions. We hope that our results will help practitioners and developers design efficient Virtual Reality training systems.},
keywords = {3D pointing, gaze tracking, eye-hand coordination},
}
@misc{taylor2022litports,
title = {LitPorts: On-demand Illuminated Ports to Facilitate Inter-device Connections in Low-light Conditions},
author = {Taylor*, Tiffany E. and Stuerzlinger, Wolfgang},
booktitle = {Australian Conference on Human-Computer Interaction},
series = {OzCHI '22},
howpublished = {Late-Breaking Work},
year = {2022},
month = {Nov},
pages = {51-57},
doi = {https://doi.org/10.1145/3572921.3572932},
commented-url = {http://www.ozchi.org/2022/poster_lbw1027.html},
pdf = {papers/litports.pdf},
video = {videos/litports.mp4},
teaser = {teasers/litports.png},
abstract = {Plugging a cable or peripheral into a device is an integral aspect of daily use of computing devices for most users. Yet, in low-light or constrained-visibility conditions the simple act of finding the receptacle to connect the cable to can be challenging and lead to user frustration. To alleviate this frustration we present LitPorts, a technology that illuminates receptacles in low-light conditions when a compatible plug is in proximity, making plugging a cable in substantially easier leading to a better all-around user experience. We also present user feedback from our prototype testing demonstrating the broad appeal and applicability of LitPorts.},
keywords = {device connectivity, ports, receptacles, illumination},
}
@misc{rajabiseraji2022xvcollab,
title = {XVCollab: An Immersive Analytics Tool for Asymmetric Collaboration across the Virtuality Spectrum},
author = {Rajabi Seraji*, Mohammad and Stuerzlinger, Wolfgang},
booktitle = {Workshop on Visual Analytics in Immersive Environments, ISMAR Adjunct Proceedings},
series = {VAinIE '22},
year = {2022},
month = {Oct},
pages = {146-154},
doi = {https://doi.org/10.1109/ISMAR-Adjunct57072.2022.00035},
pdf = {papers/xvcollab.pdf},
teaser = {teasers/xvcollab.png},
abstract = {Research has shown that when a group of people collaborate in decision-making scenarios, they can be more effective than when they work alone. Studies also show that in a data analytics context, using immersive technologies could make users perform better in data understanding, pattern recognition, and finding connections. In this work, we are leveraging previous knowledge in Collaborative Immersive Analytics (CIA) and Cross-virtuality Analytics (XVA) to develop an asymmetric system that enables two groups from different places on the Virtuality-Reality spectrum to simultaneously work on analyzing data. We divide users into two groups: the non-immersive desktop group and the immersive AR group. These two groups can both author and modify visualizations in their virtuality and share it with the other group when they see fit. For this, we designed a non-interruptive interface for both groups to transform a visualization from non-immersive 2D to immersive AR and vice-versa. We also provide multiple awareness cues in the system that keep either group aware of the other and their actions. We designed these features to boost user performance and ease of use in a collaborative setting and incentivize them to rely on the other group for visualization tasks that are difficult to perform on their end of the virtuality spectrum. Our limited pilot study shows that users find the system engaging, easy to use, and helpful in their data-understanding journey within the collaborative context. Going forward, we plan to conduct more rigorous studies to verify our claims and explore other research questions on this topic.},
keywords = {immersive analytics, cross-reality, augmented reality, collaboration},
}
@misc{rajabiseraji2022hybridaxes,
title = {HybridAxes: An Immersive Analytics Tool With Interoperability Between 2D and Immersive Reality Modes},
author = {Rajabi Seraji*, Mohammad and Stuerzlinger, Wolfgang},
booktitle = {Workshop on Prototyping Cross-Reality Systems, ISMAR Adjunct Proceedings},
series = {PCRS '22},
year = {2022},
month = {Oct},
pages = {155-160},
doi = {https://doi.org/10.1109/ISMAR-Adjunct57072.2022.00036},
pdf = {papers/hybridaxes.pdf},
teaser = {teasers/hybridaxes.png},
abstract = {Throughout the visual analytics process, users create visualizations with different dimensionalities. Research shows that in this process users benefit from being able to simultaneously see 2D and 3D modes of their data visualizations. Towards supporting this potential need, we introduce HybridAxes, an immersive visual analytics tool that allows the users to conduct their analysis at either end of the reality spectrum - either in 2D on desktop monitors or 3D in an immersive AR/VR environment - while enabling them to seamlessly switch between the two modes. We believe that by using our system, users will find it easier and faster to understand and analyze multi-dimensional data. An initial pilot test indicates positive trends in terms of users' performance time and usability metrics compared to the standalone desktop or XR counterparts. Our preliminary results also suggest that users experience a lower cognitive load while task-switching between these reality modes. This reduction in mental effort causes them to perceive the system to be unobtrusive and pleasant to work with. Going forward, we plan to conduct more rigorous studies to verify our claims and to explore other research questions on this topic.},
keywords = {immersive analytics, cross-reality, augmented reality},
}
@misc{bao2022errorsspeechtranscription,
title = {The Effects of Errors in Speech Transcription: A User Study},
author = {Bao*, Tianyi Vera and Ahmed+, Afshan and Stuerzlinger, Wolfgang},
booktitle = {TEXT2030: Shaping Text Entry Research in 2030, Workshop at MobileHCI '22},
commented-publisher = {ACM},
series = {TEXT '22},
year = {2022},
month = {Oct},
numpages = {6},
pdf = {papers/respeak.pdf},
url = {http://text2030.textentry.org.uk/papers/6.pdf},
abstract = {This paper investigates how errors that occur during speech recognition affect users’ text entry performance. To study this, we implemented a speech recognition system that injects believable errors in a controlled manner. In our user study, participants were asked to transcribe a set of phrases using our speech recognition system, either with or without the insertion of errors. The results show that inducing 33% errors in a speech-based transcription task does not seem to affect users’ performance and experience in a significant manner. Yet, according to participants’ interview responses, our result might have been caused by the phrase set we used in the study. Our work thus motivates future research to develop a phrase set more suitable for speech-based transcription tasks.},
keywords = {text entry, speech recognition, errors},
}
@misc{kneifel2022autocorrectpersonality,
title = {Effects of Personality Type on Trust in Autocorrect and Preferences},
author = {Kneifel*, Johanna and Spaeth, Dominic and Stuerzlinger, Wolfgang},
booktitle = {TEXT2030: Shaping Text Entry Research in 2030, Workshop at MobileHCI '22},
commented-publisher = {ACM},
series = {TEXT '22},
year = {2022},
month = {Oct},
numpages = {6},
pdf = {papers/autocorrectpersonality.pdf},
url = {http://text2030.textentry.org.uk/papers/3.pdf},
abstract = {User acceptance of a given feature depends upon its perceived trustworthiness. Despite imperfections, trust seems to be evenly split for autocorrect. In this study, we use the Big Five personality test and text entry tasks to investigate the effect of users’ personality type on their trust in autocorrect when encountering autocorrect errors. Results indicate that individuals ranking higher in neuroticism distrust autocorrect more. Our qualitative observations showed frustrated behaviors for autocorrect errors during the text entry tasks. Half of our participants reporting distrust in autocorrect still had the feature on. The results lend insights into connections between personality type and preferred text-based communication methods, which needs to be investigated further in future work.},
keywords = {text entry, autocorrect, trust, personality, errors},
}
@misc{kneifel2022speechvstyping,
title = {Speech Recognition Versus Typing: A Mixed-Methods Evaluation},
author = {Kneifel*, Johanna and Alharbi, Ohoud and Stuerzlinger, Wolfgang},
booktitle = {TEXT2030: Shaping Text Entry Research in 2030, Workshop at MobileHCI '22},
commented-publisher = {ACM},
series = {TEXT '22},
year = {2022},
month = {Oct},
numpages = {7},
pdf = {papers/speechvstyping.pdf},
url = {http://text2030.textentry.org.uk/papers/4.pdf},
abstract = {Mobile text entry has become a main mode of communication. To make text entry as efficient as possible, helpful features, such as autocorrect and speech recognition have been developed. In our study, we confirmed previous work in that speech recognition was faster, while the error rate for typing was lower. To analyze this in more depth, we performed semi-structured interviews about participants’ text-entry preferences, specific pain points that occur, and potential suggestions for improving the editing experience.},
keywords = {text entry, speech recognition, errors},
}
@misc{lee2022multiscalenavposter,
title = {A Comparison of Zoom-In Transition Methods for Multiscale VR},
author = {Lee*, Jong-In and Asente, Paul and Stuerzlinger, Wolfgang},
booktitle = {SIGGRAPH 2022 Posters},
publisher = {ACM},
series = {SIGGRAPH '22},
howpublished = {Poster},
year = {2022},
month = {Aug},
articleno = {22},
numpages = {2},
doi = {https://doi.org/10.1145/3532719.3543237},
pdf = {papers/zoomintransition.pdf},
abstract = {When navigating within an unfamiliar virtual environment in virtual reality, transitions between pre-defined viewpoints are known to facilitate spatial awareness of a user. In the past, different viewpoint transition techniques had been investigated in VR 3D UI research, but mainly for single-scale environments. We present a comparative study of zoom-in transition techniques, where the viewpoint of a user is being smoothly transitioned from a large level of scale (LoS) to a smaller LoS in a multiscale virtual environment (MVE) with a nested structure. We identify that orbiting first before zooming in is preferred over other alternatives when transitioning to a viewpoint at a small LoS.},
keywords = {3D navigation, multiscale virtual environment, viewpoint transition},
}
@misc{kaya2022depthrole,
title = {The Role of the Depth Dimension in 3D Visualizations for Dense Data Understanding},
author = {Kaya+, Furkan and Batmaz, Anil Ufuk and Mutasim*, Aunnoy K and Stuerzlinger, Wolfgang},
booktitle = {European Conference on Visual Perception},
commented-publisher = {Sage},
series = {ECVP '22},
howpublished = {Abstract},
year = {2022},
month = {Aug},
pages = {183-184},
doi = {https://doi.org/10.1177/03010066221141167},
abstract = {Visual attributes, such as size, shape, or colour, play a crucial role in the interpretation of data visualizations and can be used to represent the data at different scales. On 2D displays, human viewers then perceive the differences between scales based on such visual attributes. While it can be challenging for human to interpret data in dense visualizations in 2D, the additional depth dimension offered by 3D could make some aspects of data more visible.
To analyze the potential impact of depth perception on dense data visualization, we developed a novel visualization method and visualized dense COVID-19 time-series data of four European countries (France, Germany, United Kingdom, and Turkey). In our novel visualization, we aimed to increase the visibility of individual data points to ease visual perception and visualized daily total cases in the depth dimension.
We conducted a user study with 20 participants where we compared a conventional 2D visualization with the proposed novel 3D visualization method for COVID-19 data.
The results show that the novel 3D visualization method facilitated understanding of the complexity of COVID-19 case data and decreased misinterpretations by 40%. Overall, 13 out of 20 participants preferred to see the COVID-19 data with the proposed method. Participants’ comments on the novel visualization method revealed that the increased visibility of individual data points decreases the cognitive load of the participants, which might explain the outcome.
The results of our work identify that the depth dimension offered by 3D visualizations can assist users in understanding dense data.},
keywords = {3D visualization, perception},
}
@misc{dunlop2022textworkshop,
title = {TEXT2030 - Shaping Text Entry Research in 2030},
author = {Dunlop, Mark and Stuerzlinger, Wolfgang and Arif, Ahmed Sabbir and Alharbi, Ohoud and Komninos, Andreas},
booktitle = {International Conference on Human-Computer Interaction with Mobile Devices and Services},
publisher = {ACM},
series = {MobileHCI '22},
howpublished = {Workshop Abstract},
year = {2022},
month = {Sep},
articleno = {3},
numpages = {4},
doi = {https://doi.org/10.1145/3528575.3551429},
pdf = {papers/text2030ws.pdf},
url = {http://text2030.textentry.org.uk},
abstract = {We propose a workshop on the theme of ubiquitous text entry research. Our aim is to address the methodological challenges arising from several decades of experience in this research community. We hope to solicit views, experiences and ideas from researchers across a range of backgrounds, with a view to formulate concrete action plans to move community practices into a strengthened position by 2030.},
keywords = {text entry, methodological challenges},
}
@misc{jiang2022computationaluiworkshop,
title = {Computational Approaches for Understanding, Generating, and Adapting User Interfaces},
author = {Jiang*, Yue and Lu*, Yuwen and Nichols, Jeffery and Stuerzlinger, Wolfgang and Yu, Chun and Lutteroth, Christof and Li, Yang and Kumar, Ranjitha and Li, Toby Jia-Jun},
booktitle = {Extended Abstracts of the CHI Conference on Human Factors in Computing Systems},
publisher = {ACM},
series = {CHI EA '22},
howpublished = {Extended Abstract},
year = {2022},
month = {May},
articleno = {74},
numpages = {6},
doi = {https://doi.org/10.1145/3491101.3504030},
pdf = {papers/computationaluiworkshop.pdf},
abstract = {Computational approaches for user interfaces have been used in adapting interfaces for different modalities, usage scenarios and device form factors, understanding screen semantics for accessibility, task-automation, information extraction, and in assisting interface design. Recent advances in machine learning (ML) have drawn considerable attention across HCI and related fields such as computer vision and natural language processing, leading to new ML-based user interface approaches. Similarly, significant progress has been made with more traditional optimization- and planning-based approaches to accommodate the need for adapting UIs for screens with different sizes, orientations and aspect ratios, and in emerging domains such as VR/AR and 3D interfaces. The proposed workshop seeks to bring together researchers interested in all kinds of computational approaches for user interfaces across different sectors as a community, including those who develop algorithms and models and those who build applications, to discuss common issues including the need for resources, opportunities for new applications, design implications for human-AI interaction in this domain, and practical challenges such as user privacy.},
keywords = {GUI, layout, constraints},
}
@misc{batmaz2021year1covid,
title = {Researchers’ and Participants’ Experiences on Distributed User Studies Conducted in the First Year of COVID-19 Pandemic},
author = {Batmaz, Anil Ufuk and Mifsud*, Domenick and Steed, Anthony and Stuerzlinger, Wolfgang and Ortega, Francisco},
booktitle = {First XR Remote Research Workshop at CHI '21},
year = {2021},
month = {May},
numpages = {3},
pdf = {papers/covidyear1ws.pdf},
url = {http://www.mat.qmul.ac.uk/xr-chi-2021},
abstract = {COVID-19 has raised significant challenges to the conduct of Virtual Reality (VR) and Augmented Reality (AR) studies. Previously, most VR and AR academic research happened in research labs at universities, where the experiments were conducted in controlled environments with specific installations and instrumentation. With the ongoing pandemic, many VR/AR researchers switched by necessity to distributed studies, where the participants participate in the studies from their own living or working spaces. This change created novel challenges for participants and experimenters. In this paper, we report some experiences with VR/AR studies conducted in the first year of COVID-19 and present recommendations for future, distributed VR/AR studies.},
keywords = {3D user interfaces, COVID-19, extended reality, virtual reality, augmented reality},
}
@misc{malekmakan2020analyzing,
title = {Analyzing the Trade-off between Selection and Navigation in VR},
author = {Malekmakan*, Morteza and Stuerzlinger, Wolfgang and Riecke, Bernhard},
booktitle = {26th Symposium on Virtual Reality Software and Technology},
publisher = {ACM},
series = {VRST '20},
howpublished = {Poster},
year = {2020},
month = {Nov},
articleno = {42},
numpages = {3},
doi = {https://doi.org/10.1145/3385956.3422123},
pdf = {papers/navseltradeoffposter.pdf},
video = {https://www.youtube.com/watch?v=8w53gKhPjWs},
abstract = {Navigation and selection are critical in very large virtual environments, such as a model of a whole city. In practice, many VR applications require both of these modalities to work together. We compare different combinations of two navigation and two selection methods in VR on selection tasks involving distant targets in a user study. The aim of our work is to discover the trade-off between navigation and selection techniques and to identify which combination leads to better interaction performance in large virtual environments. The results showed that users could complete the task faster with the fly/drive method and traveled less, compared to the teleportation method. Additionally, raycasting exhibited a better performance in terms of time and (less) distance traveled, however, it significantly increased the error rate for the selection of targets.},
keywords = {3D pointing, 3D navigation},
}
@misc{wagner2020designing,
title = {Designing Efficient Immersive Analytics Environments for Spatio-Temporal Data},
author = {Wagner Filho*, Jorge and Stuerzlinger, Wolfgang and Nedel, Luciana},
booktitle = {SIBGRAPI Workshop on Visual Analytics, Information Visualization and Scientific Visualization},
series = {WVIS '20},
howpublished = {Abstract},
year = {2020},
month = {Oct},
numpages = {1},
abstract = {The ever-growing amount of human movement data challenges us to develop new visualization techniques and to revisit existing ones with different perspectives. Traditional 2D movement visualizations focus either on the spatial or temporal aspects of the data, potentially hindering the observation of relevant features. Emerging Immersive Analytics approaches offer the opportunity to revisit a three-dimensional visualization that allows the integrated analysis of both. With the aid of stereoscopic virtual reality and 3D user interfaces, an immersive Space-Time Cube might overcome challenges that limited its adoption in the past. In this talk, we will present an overview of our ongoing research on this immersive representation, preliminary insights obtained with different navigation and interaction approaches, and our next planned steps.},
keywords = {visual analytics, immersive analytics, space-time cube, 3D visualization},
}
@misc{wagner2020visualizing,
title = {Visualizing Movement Trajectories in an Immersive Space Time-Cube},
author = {Wagner Filho*, Jorge and Stuerzlinger, Wolfgang and Nedel, Luciana},
booktitle = {VIS 2020 Workshop on Information Visualization of Geospatial Networks, Flows and Movement},
publisher = {IEEE},
series = {MoVis '20},
howpublished = {Extended Abstract},
year = {2020},
month = {Oct},
numpages = {3},
abstract = {The ever-growing amount of human movement data challenges us to develop new visualization techniques and to revisit existing ones with different perspectives. Traditional 2D movement visualizations focus either on the spatial or temporal aspects of the data, potentially hindering the observation of relevant features. Emerging Immersive Analytics approaches offer the opportunity to revisit a three-dimensional visualization that allows the integrated analysis of both. With the aid of stereoscopic virtual reality and 3D user interfaces, an immersive Space-Time Cube might overcome challenges that limited its adoption in the past. In this paper, we provide an overview of the results obtained in our ongoing research on this immersive representation. We also discuss insights obtained with different navigation and interaction approaches, and our next planned steps.},
keywords = {visual analytics, immersive analytics, space-time cube, 3D visualization},
}
@comment{c, c={currently commented out. If the corresponding journal article goes converts to misc, I might put this back in}}
@comment{steed2020covidblog,
author = {Steed, Anthony and Ortega, Francisco and Williams, Adam and Kruijff, Ernst and Stuerzlinger, Wolfgang and Batmaz, Anil Ufuk and Won, Andrea and Suma Rosenberg, Evan and Simeone, Adalberto and Hayes, Aleshia},
title = {Evaluating Immersive Experiences During COVID-19 and Beyond},
booktitle = {Interactions Blog},
month = {May},
year = {2020},
url = {http://interactions.acm.org/blog/view/enlightenment-by-lesson-},
howpublished = {Blog entry},
keywords = {3D user interfaces},
}
@misc{batmaz2020effect,
title = {Effect of Fixed and Infinite Ray Length on Distal {3D} Pointing in Virtual Reality},
author = {Batmaz, Anil Ufuk and Stuerzlinger, Wolfgang},
booktitle = {Extended Abstracts of the CHI Conference on Human Factors in Computing Systems},
publisher = {ACM},
series = {CHI EA '20},
howpublished = {Extended Abstract},
year = {2020},
month = {Apr},
numpages = {10},
doi = {https://doi.org/10.1145/3334480.3382796},
pdf = {papers/raylength.pdf},
abstract = {Ray casting is frequently used to point and select distant targets in Virtual Reality (VR) systems. In this work, we evaluate user performance in 3D pointing with two different ray casting versions: infinite ray casting, where the cursor is positioned on the surface of the first object along the ray that said ray points at, and finite ray-casting, where the cursor is attached to the ray at a fixed distance from the controller. Twelve subjects performed a Fitts' law experiment where the targets were placed 1, 2, or 3 meters away from the user. According to the results, subjects were faster and made fewer errors with the infinite ray length. Interestingly, their (effective) pointing throughput was higher when the ray length was constrained. We illustrate the advantages of both methods in immersive VR applications and provide information for practitioners and developers to choose the most appropriate ray-casting-based selection method for VR.},
keywords = {3D pointing, mid-air},
}
@misc{mutazim2020gaze,
title = {Gaze Tracking for Eye-Hand Coordination Training Systems in Virtual Reality},
author = {Mutasim*, Aunnoy K. and Stuerzlinger, Wolfgang and Batmaz, Anil Ufuk},
booktitle = {Extended Abstracts of the CHI Conference on Human Factors in Computing Systems},
publisher = {ACM},
series = {CHI EA '20},
howpublished = {Extended Abstract},
year = {2020},
month = {Apr},
numpages = {9},
doi = {https://doi.org/10.1145/3334480.3382924},
pdf = {papers/gazesportstrain.pdf},
abstract = {Eye-hand coordination training systems are used to improve user performance during fast movements in sports training. In this work, we explored gaze tracking in a Virtual Reality (VR) sports training system with a VR headset. Twelve subjects performed a pointing study with or without passive haptic feedback. Results showed that subjects spent an average of 0.55 s to visually find and another 0.25 s before their finger selected a target. We also identified that, passive haptic feedback did not increase the performance of the user. Moreover, gaze tracker accuracy significantly deteriorated when subjects looked below their eye level. Our results also point out that practitioners/trainers should focus on reducing the time spent on searching for the next target to improve their performance through VR eye-hand coordination training systems. We believe that current VR eye-hand coordination training systems are ready to be evaluated with athletes.},
keywords = {3D pointing, gaze tracking, eye-hand coordination},
}
@misc{murad2019,
title = {Effects of WER on ASR Correction Interfaces for Mobile Text Entry},
author = {Murad*, Christine and Munteanu, Cosmin and Stuerzlinger, Wolfgang},
booktitle = {International Conference on Human-Computer Interaction with Mobile Devices and Services},
publisher = {ACM},
series = {MobileHCI '19},
howpublished = {Poster},
year = {2019},
month = {Oct},
articleno = {56},
numpages = {6},
doi = {https://doi.org/10.1145/3338286.3344404},
pdf = {papers/speecheffect.pdf},
abstract = {Speech is increasingly being used as a method for text entry, especially on commercial mobile devices such as smartphones. While automatic speech recognition has seen great advances, factors like acoustic noise, differences in language or accents can affect the accuracy of speech dictation for mobile text entry. There has been some research on interfaces that enable users to intervene in the process, by correcting speech recognition errors. However, there is currently little research that investigates the effect of Automatic Speech Recognition (ASR) metrics, such as word error rate, on human performance and usability of speech recognition correction interfaces for mobile devices. This research explores how word error rates affect the usability and usefulness of touch-based speech recognition correction interfaces in the context of mobile device text entry.},
keywords = {speech recognition, text entry, errors},
}
@misc{batmaz2019effect,
title = {The Effect of Rotational Jitter on {3D} Pointing Tasks},
author = {Batmaz, Anil Ufuk and Stuerzlinger, Wolfgang},
booktitle = {Extended Abstracts of the CHI Conference on Human Factors in Computing Systems},
publisher = {ACM},
series = {CHI EA '19},
howpublished = {Extended Abstract},
year = {2019},
month = {May},
articleno = {LBW2112},
numpages = {6},
doi = {https://doi.org/10.1145/3290607.3312752},
pdf = {papers/rotjitterpointing.pdf},
abstract = {Even when in a static position, data acquired from 6 Degrees of Freedom (DoF) trackers is affected by noise, which is typically called jitter. In this study, we analyzed the effects of 3D rotational jitter on Virtual Reality (VR) controllers in a 3D Fitts' law experiment, which explored how such jitter affects user performance. Eight subjects performed a Fitts' law experiment with or without additional jitter on the cursor. Results show that while error rate significantly increased above ±0.5° jitter and subjects' effective throughput started to decrease significantly above ±1° jitter, there was no significant effect on users' movement time. Further, the Fitts's law movement time model was affected when ±2° jitter was applied to the tracker. According to these results, ±0.5° jitter on the controller does not significantly affect user performance for the tasks explored here. The results of our study can guide the design of 3D controller and tracking systems for 3D user interfaces.},
keywords = {3D pointing, jitter},
}
@misc{mutasim2019detection,
title = {Detection of Error Potentials using the Muse Headband},
author = {Mutasim*, Aunnoy K. and Stuerzlinger, Wolfgang},
booktitle = {EMBS Conference On Neural Engineering},
publisher = {IEEE},
series = {NER '19},
howpublished = {Poster},
year = {2019},
month = {Mar},
articleno = {FrPO.120},
numpages = {1},
abstract = {The detection of Error Potentials (ErrPs) has found promising applications in both neurophysiological and brain-computer interface (BCI) domains. However, the EEG acquisition devices used in such studies are mostly medical-grade and therefore expensive. Here, we propose to detect ErrPs using the cost-effective Muse headband.},
keywords = {EEG, errors},
}
@misc{nguyenvo2018actual,
title = {Do We Need Actual Walking in VR? Leaning with Actual Rotation Might Suffice for Efficient Locomotion},
author = {Nguyen-Vo*, Thinh and Pham*, Duc-Minh and Riecke, Bernhard E. and Stuerzlinger, Wolfgang and Kruijff, Ernst},
booktitle = {Spatial Cognition},
series = {SC '18},
howpublished = {Poster},
year = {2018},
month = {Sep},
abstract = {Walking has always been the most common locomotion mode for humans in the real world. For this reason, walking has also been considered as the ideal condition in a large body of VR research involving navigation. Physical walking provides body-based sensory information about both the translational and rotational components of locomotion. Though the rotational body-based information has been shown to be important for several spatial tasks, the benefit of the translational component is still unclear with mixed results from previous studies. In this study, we aim to investigate how much translational body-based sensory information is required for people to efficiently navigate the virtual world, given full rotational information. Depending on the locomotion interface used, more or less translational body-based information might be provided at different levels of accuracy. The current mixed method study investigated how different levels of translational body-based information might influence the performance of participants in a navigational search task in a HMD-based virtual environment. Participants were asked to find eight balls hidden in 16 target boxes randomly positioned in a two-meter radius circular area. To check whether there is a ball inside a target box, participants must stand right in front of the box within 0.80 meter and look at it. If there is a ball, they can collect it by touching the ball with a wand controller. The environment has been designed not to provide any additional orientation cue other than the optic flow from the fireflies. Participants could not see targets farther than two meter from them. In other words, they were not able to see all targets at a time, hence, they had to build up their spatial awareness gradually along with their locomotion. In this within-subject experiment, there were four levels of translational body-based information: none (participants used the trackpad of an HTC Vive wand controller to visually translate), upper-body leaning (participants sitting on a Swopper chair, used their upper-body leaning to control their visual translation), whole-body leaning (participants standing on a platform called NaviBoard, used their whole body leaning or stepping to navigate the virtual environment), and actual walking (participants physically walk with a wireless HMD on). Every participant performed a navigational search task once in every condition in a counter-balance order. All 24 participants finished all four trials (even with more or less fatigue). Results showed that locomotion mode had significant effects on various measures including task performance, task load, and simulator sickness. While participants performed significantly worse when they used joystick-based interface with no body-based information, compared to the other conditions, there was no significant difference between leaning-based interfaces and actual walking. More data in other measures are still in need for a more concrete conclusion. However, current results also suggested that body-based information from a leaning-based interface might suffice for a cost-effective alternative to actual walking in spatial cognition research and applications in VR.},
keywords = {3D navigation},
}
@misc{zaman2018gemniplus,
title = {{GEM-NI}+: Leveraging Difference Visualization and Multiple Displays for Supporting Multiple Complex Generative Design Alternatives},
author = {Zaman, Loutfouz and Neugebauer+, Christian and Stuerzlinger, Wolfgang and Woodbury, Robert},
booktitle = {Extended Abstracts of the CHI Conference on Human Factors in Computing Systems},
publisher = {ACM},
series = {CHI EA '18},
howpublished = {Extended Abstract},
year = {2018},
month = {Apr},
articleno = {LBW106},
numpages = {6},
doi = {https://doi.org/10.1145/3170427.3188593},
pdf = {papers/gem-ni+.pdf},
abstract = {In the conceptual design phase, designers routinely generate dozens of alternatives based on a single idea. This is especially relevant in generative design where an algorithm can generate a large number of viable design options. While solutions for creating and managing a small number of simple alternatives have been proposed, practical applications of these solutions are liMassachusetts Institute of Technologyed. As a result, we present GEM-NI+, an extension to the original GEM-NI system for creating and managing alternatives in generative design. GEM-NI+ is designed to enable editing, managing and comparing up to 24 alternatives simultaneously using a multi-monitor setup. GEM-NI+ also features a new "jamming spaces" technique for assigning individual monitors into different visualization states, which makes organization of a large workspace easier. Finally, GEM-NI+ enables comparison of complex alternatives using recursive group node difference visualization.},
keywords = {alternatives, design},
}
@misc{machuca2018stereo,
title = {Do Stereo Display Deficiencies Affect {3D} Pointing?},
author = {Barrera Machuca*, Mayra D. and Stuerzlinger, Wolfgang},
booktitle = {Extended Abstracts of the CHI Conference on Human Factors in Computing Systems},
publisher = {ACM},
series = {CHI EA '18},
howpublished = {Extended Abstract},
year = {2018},
month = {Apr},
articleno = {LBW126},
numpages = {6},
doi = {https://doi.org/10.1145/3170427.3188540},
abstract = {Previous work has documented that limitations of current stereo display systems affect depth perception. We performed an experiment to understand if such stereo display deficiencies affect 3D pointing for targets in front of a screen and close to the user, i.e., in peri-personal space. Our experiment compares isolated movements with and without a change in visual depth for virtual targets. Results indicate that selecting targets along the depth axis is slower and has less throughput than laterally positioned targets.},
keywords = {3D pointing, mid-air, stereo},
}
@misc{hashemian2018investigating,
title = {Investigating a Sparse Peripheral Display in a Head-Mounted Display for VR Locomotion},
author = {Hashemian*, Abraham and Kitson*, Alexandra and Nguyen-Vo*, Thinh and Benko, Hrvoje and Stuerzlinger, Wolfgang and Riecke, Bernhard E.},
booktitle = {Conference on Virtual Reality and {3D} User Interfaces},
publisher = {IEEE},
series = {VR '18},
howpublished = {Poster},
year = {2018},
month = {Mar},
pages = {571-572},
doi = {https://doi.org/10.1109/VR.2018.8446345},
abstract = {Head-Mounted Displays (HMDs) provide immersive experiences for virtual reality. However, their field of view (FOV) is still relatively small compared to the human eye, which adding sparse peripheral displays (SPDs) could address. We designed a new SPD, SparseLightVR2, which increases the HMD's FOV to 180° horizontally. We evaluated SparseLightVR2 with a study (N=29) by comparing three conditions: 1) no SPD, where the peripheral display (PD) was inactive; 2) extended SPD, where the PD provided visual cues consistent with and extending the HMD's main screen; and 3) counter-vection SPD, where the PD's visuals were flipped horizontally during VR travel to provide optic flow in the opposite direction of the travel. The participants experienced passive motion on a linear path and reported introspective measures such as sensation of self-motion. Results showed, compared to no SPD, both extended and counter-vection SPDs provided a more natural experience of motion, while extended SPD also enhanced vection intensity and believability of movement. Yet, visually induced motion sickness (VIMS) was not affected by display condition. To investigate the reason behind these non-significant results, we conducted a follow-up study and had users increase peripheral counter-vection visuals on the central HMD screen until they nulled out vection. Our results suggest extending HMDs through SPDs enhanced vection, naturalness, and believability of movement without enhancing VIMS, but reversed SPD motion cues might not be strong enough to reduce vection and VIMS.},
keywords = {3D navigation},
}
@misc{sun2018selecting,
title = {Selecting Invisible Objects},
author = {Sun*, Junwei and Stuerzlinger, Wolfgang},
booktitle = {Conference on Virtual Reality and {3D} User Interfaces},
publisher = {IEEE},
series = {VR '18},
howpublished = {Poster},
year = {2018},
month = {Mar},
pages = {697-698},
doi = {https://doi.org/10.1109/VR.2018.8446199},
abstract = {We augment 3D user interfaces with a new technique that enables users to select objects that are invisible from the current viewpoint. We present a layer-based method for selecting invisible objects, which works for arbitrary objects and scenes. The user study shows that with our new techniques users can easily select hidden objects.},
keywords = {3D positioning, transparency},
}
@misc{machuca2017multiplanes,
title = {Multiplanes: Assisted Freehand VR Drawing},
author = {Barrera Machuca*, Mayra D. and Asente, Paul and Lu*, Jingwan and Kim, Byungmoon and Stuerzlinger, Wolfgang},
booktitle = {Adjunct Publication of the 30th Annual ACM Symposium on User Interface Software and Technology},
publisher = {ACM},
series = {UIST '17},
howpublished = {Demonstration},
year = {2017},
month = {Oct},
pages = {1-3},
doi = {https://doi.org/10.1145/3131785.3131794},
abstract = {Multiplanes is a virtual reality (VR) drawing system that provides users with the flexibility of freehand drawing and the ability to draw perfect shapes. Through the combination of both beautified and 2D drawing, Multiplanes addresses challenges in creating 3D VR drawings. To achieve this, the system beautifies user's strokes based on the most probable, intended shapes while the user is drawing them. It also automatically generates snapping planes and beautification trigger points based on previous and current strokes and the current controller pose. Based on geometrical relationships to previous strokes, beautification trigger points act as guides inside the virtual environment. Users can hit these points to (explicitly) trigger a stroke beautification. In contrast to other systems, when using Multiplanes, users do not need to manually set or do any kind of special gesture to activate, such guides allowing the user to focus on the creative process.},
keywords = {3D sketching, 3D drawing, 3D modeling, 3D user interfaces},
}
@misc{machuca2018fluidvr,
title = {Fluid VR: Extended Object Associations for Automatic Mode Switching in Virtual Reality},
author = {Barrera Machuca*, Mayra D. and Sun*, Junwei and Pham*, Duc-Minh and Stuerzlinger, Wolfgang},
booktitle = {Conference on Virtual Reality and {3D} User Interfaces},
publisher = {IEEE},
series = {3DUI '18},
howpublished = {3DUI contest entry},
year = {2018},
month = {Mar},
pages = {846-847},
doi = {https://doi.org/10.1109/VR.2018.8446437},
abstract = {Constrained interaction and navigation methods for virtual reality reduce the complexity of the interaction. Yet, with previously presented solutions, users need to learn new interaction tools or remember different actions for changing between different interaction methods. In this paper, we propose Fluid VR, a new 3D user interface for interactive virtual environments that lets users seamlessly transition between navigation and selection. Based on the selected object's properties, Fluid VR applies specific constraints to the interaction or navigation associated with the object. This way users have a better control of their actions, without having to change tools or activate different modes of interaction.},
keywords = {3D manipulation},
}
@misc{nguyenvo2017investigating,
title = {Investigating the Effect of Simulated Reference Frames on Spatial Orientation in Virtual Reality},
author = {Nguyen-Vo*, Thinh and Riecke, Bernhard E. and Stuerzlinger, Wolfgang},
booktitle = {Second Workshop on Models and Representations in Spatial Cognition},
series = {SC '17},
howpublished = {Poster},
year = {2017},
month = {Apr},
url = {https://osf.io/bs5ug},
abstract = {Despite recent advances in virtual reality, locomotion in a virtual environment is still restricted because of spatial disorientation. Previous research has shown the benefits of reference frames in maintaining spatial orientation. Here, we propose using a visually simulated reference frame in virtual reality to provide users with a better sense of direction in landmark-free virtual environments. Visually overlaid rectangular frames simulate different variations of frames of reference. We investigated how two different types of visually simulated reference frames might benefit in a navigational search task through a mixed-method study. Results showed that the presence of a reference frame significantly affects participants' performance in a navigational search task. Though the egocentric frame of reference (simulated CAVE) that translates with the observer did not significantly help, an allocentric frame of reference (a simulated stationary room) significantly improved user performance both in navigational search time and overall travel distance. Our study suggests that adding a variation of the reference frame to virtual reality applications might be a cost-effective solution to enable more effective locomotion in virtual reality.},
keywords = {cave, 3D navigation},
}
@misc{nguyenvo2017moving,
title = {Moving in a Box: Improving Spatial Orientation in Virtual Reality using Simulated Reference Frames},
author = {Nguyen-Vo*, Thinh and Riecke, Bernhard E. and Stuerzlinger, Wolfgang},
booktitle = {Symposium on {3D} User Interfaces},
publisher = {IEEE},
series = {3DUI '17},
howpublished = {Poster},
year = {2017},
month = {Mar},
pages = {846-847},
doi = {https://doi.org/10.1109/3DUI.2017.7893344},
abstract = {Despite recent advances in virtual reality, locomotion in a virtual environment is still restricted because of spatial disorientation. Previous research has shown the benefits of reference frames in maintaining spatial orientation. Here, we propose using a visually simulated reference frame in virtual reality to provide users with a better sense of direction in landmark-free virtual environments. Visually overlaid rectangular frames simulate different variations of frames of reference. We investigated how two different types of visually simulated reference frames might benefit in a navigational search task through a mixed-method study. Results showed that the presence of a reference frame significantly affects participants' performance in a navigational search task. Though the egocentric frame of reference (simulated CAVE) that translates with the observer did not significantly help, an allocentric frame of reference (a simulated stationary room) significantly improved user performance both in navigational search time and overall travel distance. Our study suggests that adding a variation of the reference frame to virtual reality applications might be a cost-effective solution to enable more effective locomotion in virtual reality.},
keywords = {cave, 3D navigation},
}
@misc{teather2016tutorial,
title = {SIVARG: Spatial Interaction in Virtual/Augmented Reality and Games},
author = {Teather, Robert and Stuerzlinger, Wolfgang},
booktitle = {International Conference on Interactive Surfaces and Spaces},
publisher = {ACM},
series = {ISS '16},
howpublished = {Tutorial},
year = {2016},
month = {Nov},
pages = {525–528},
doi = {https://doi.org/10.1145/2992154.2996364},
abstract = {We propose a workshop soliciting submissions on the topics of spatial and 3D interaction in highly fidelity graphical interactive systems, especially video games and virtual reality systems. Topics will cover all aspects of interaction in these systems, including input-related issues such as efficient control mappings, spatial input device features (e.g., low latency, input noise, etc.), as well as output-related issues such as display hardware features (e.g., stereoscopic rendering, head-tracking), and information visualization (e.g., game HUDs for status information). We propose to include both position papers, as well as papers including at least preliminary studies on issues in these areas.},
keywords = {3D user interface},
}
@misc{sun2016shiftsliding,
title = {{Shift-Sliding} and {Depth-Pop} for {3D} Positioning},
author = {Sun*, Junwei and Stuerzlinger, Wolfgang and Shuralyov*, Dmitri},
booktitle = {Symposium on Spatial User Interaction},
publisher = {ACM},
series = {SUI '16},
howpublished = {Demonstration},
year = {2016},
month = {Oct},
pages = {165-165},
doi = {https://doi.org/10.1145/2983310.2991067},
abstract = {We introduce two new 3D positioning methods. The techniques enable rapid, yet easy-to-use positioning of objects in 3D scenes. With SHIFT-Sliding, the user can override the default assumption of contact and non-collision for sliding, and lift objects into the air or make them collide with other objects. DEPTH-POP maps mouse wheel actions to all object positions along the mouse ray, where the object meets the default assumptions for sliding. We will demonstrate the two methods in a desktop environment with the mouse and keyboard as interaction devices. Both methods use frame buffer techniques for efficiency.},
keywords = {3D manipulation, 3D positioning},
}
@misc{machuca2016history,
title = {{3D} Camera Pose History Visualization},
author = {Barrera Machuca*, Mayra D. and Stuerzlinger, Wolfgang},
booktitle = {Symposium on Spatial User Interaction},
publisher = {ACM},
series = {SUI '16},
howpublished = {Poster},
year = {2016},
month = {Oct},
pages = {183-183},
doi = {https://doi.org/10.1145/2983310.2989185},
abstract = {We present a 3D camera pose history visualization that can assist users of CAD software's, virtual worlds and scientific visualizations to revisit their navigation history. The contribution of this system is to enable users to move more efficiently through the virtual environment so they can focus on their main activity.},
keywords = {3D navigation},
}
@misc{sun2016floatsliding,
title = {{FLOAT}-Sliding for {3D} Positioning},
author = {Sun*, Junwei and Stuerzlinger, Wolfgang},
booktitle = {Graphics Interface},
series = {GI '16},
howpublished = {Poster},
year = {2016},
month = {Jun},
numpages = {2},
abstract = {We describe a new technique for 3D positioning, based on the typical sliding technique. We assume that by default object stay in contact with the scene's front surfaces and do not interpenetrate other objects. To ensure precision, we permit manipulation only for at least partially visible objects. With our new FLOAT-Sliding method the user can override the default contact assumption and lift objects into the air or make them collide with other objects. For efficiency, FLOAT-Sliding uses frame buffer techniques.},
keywords = {3D manipulation, 3D positioning},
}
@misc{seim2016passive,
title = {Can Passive Haptic Learning Help Users Become More Skilled Keyboard Typists?},
author = {Seim*, Caitlyn and Doering+, Nick and Stuerzlinger, Wolfgang and Starner, Thad},
booktitle = {CHI 2016 Workshop on Inviscid Text Entry and Beyond},
series = {Textentry '16},
howpublished = {Extended Abstract},
year = {2016},
month = {May},
numpages = {4},
url = {http://www.textentry.org/chi2016},
abstract = {Passive Haptic Learning (PHL) can be used to teach text entry systems such as Braille and Morse code where each finger controls at most one key. However, most keyboards have a spatial layout where each finger controls multiple keys, and each key is labeled. Can PHL help users improve their skill at these text entry systems? We are investigating these questions by using passive stimuli to help users learn a randomized layout of the number pad. This research is aimed at laying the groundwork for creating a system to help individuals improve their QWERTY keyboard typing.},
keywords = {haptics, learning},
}
@misc{bjerre2015transition,
title = {Transition Times for Manipulation Tasks in Hybrid Interfaces},
author = {Bjerre+, Per and Christensen+, Allan and Pedersen+, Simon André and Pedersen+, Andreas Køllund and Stuerzlinger, Wolfgang},
booktitle = {3rd Symposium on Spatial User Interaction},
publisher = {ACM},
series = {SUI '15},
howpublished = {Poster},
year = {2015},
month = {Aug},
pages = {137-137},
doi = {https://doi.org/10.1145/2788940.2794358},
pdf = {papers/transitionsposter.pdf},
abstract = {Previous work has shown that uninstrumented in-air interaction is slower and not as precise for pointing tasks compared to the mouse. Yet, there are interaction scenarios where it is preferable or advantageous to use in-air input. Therefore, we examine a three-device hybrid setup involving the mouse, keyboard, and a Leap Motion. We performed a user study to quantify the costs associated with transitioning between these interaction devices and also for performing simple 2D manipulation tasks using the mouse and Leap Motion. We discovered that transitioning to and from the Leap Motion takes on average 0.87 seconds longer than transitions between the mouse and keyboard.},
keywords = {3D manipulation, 3D positioning},
}
@misc{arif2015smart,
title = {A Smart-Restorable Backspace to Facilitate Text Entry Error Correction},
author = {Arif, Ahmed Sabbir and Stuerzlinger, Wolfgang and Mazalek, Ali and Kim, Sunjun and Lee, Geehyuk},
booktitle = {CHI 2015 Workshop on Text Entry on the Edge},
series = {Textentry '15},
howpublished = {Extended Abstract},
year = {2015},
month = {Apr},
numpages = {4},
url = {http://www.textentry.org/chi2015},
abstract = {Selection is one of the most basic interaction methods in 3D user interfaces. Previous work has shown that visual feedback improves such actions. However, haptic feedback can increase the realism or also help for occluded targets. Here we investigate if 3D virtual hand selection benefits from electrical muscle stimulation (EMS) and vibration. In our experiment we used a 3D version of a Fitts' task to compare visual, EMS, vibration, and no feedback. The results demonstrate that both EMS and vibration are reasonable alternatives to visual feedback. We also found good user acceptance for both technologies.},
keywords = {text entry, errors, backspace},
}
@misc{pfeiffer2015ems,
title = {{3D} Virtual Hand Selection with {EMS} and Vibration Feedback},
author = {Pfeiffer*, Max and Stuerzlinger, Wolfgang},
booktitle = {33rd Annual Conference Extended Abstracts on Human Factors in Computing Systems},
publisher = {ACM},
series = {CHI EA '15},
howpublished = {Extended Abstract},
year = {2015},
month = {Apr},
pages = {1361-1366},
doi = {https://doi.org/10.1145/2702613.2732763},
abstract = {Selection is one of the most basic interaction methods in 3D user interfaces. Previous work has shown that visual feedback improves such actions. However, haptic feedback can increase the realism or also help for occluded targets. Here we investigate if 3D virtual hand selection benefits from electrical muscle stimulation (EMS) and vibration. In our experiment we used a 3D version of a Fitts' task to compare visual, EMS, vibration, and no feedback. The results demonstrate that both EMS and vibration are reasonable alternatives to visual feedback. We also found good user acceptance for both technologies.},
keywords = {3D positioning, haptics},
}
@misc{stuerzlinger2015tivs,
title = {TIVS: Temporary Immersive Virtual Environment at Simon Fraser University: A Non-permanent CAVE},
author = {Stuerzlinger, Wolfgang and Pavlovych*, Andriy and Nywton+, Dayson},
booktitle = {1st Workshop on Everyday Virtual Reality},
publisher = {IEEE},
series = {WEVR '15},
year = {2015},
month = {Mar},
pages = {23-28},
doi = {https://doi.org/10.1109/WEVR.2015.7151691},
pdf = {papers/tivs.pdf},
video = {videos/TIVS.mp4},
abstract = {CAVE systems are an immersive environment that surrounds one or more viewers with multiple large screens, which portray a virtual 3D environment. CAVEs use generally between three and six sides and are thus effectively permanent installations, due to the required floor and room space. We describe TIVS, the Temporary Immersive Virtual environment at Simon Fraser University, a system whose defining feature is that it does not consume any permanent floor space. Yet, TIVS can be in operation in less than a minute. Viewers sit on swivel chairs in the center of an 8' × 6' space, where TIVS's frame is mounted onto the ceiling. The bottom of said frame is 7' above the ground, making it easy for people to walk below it. The screens mounted on the frame are rolled down whenever the system is being used and are otherwise stowed away. That frees the floor space for other uses when the system is not in use. The projection geometry ensures that people sitting in the center area of the space do not cast shadows onto the screens. A tracking system attached to the frame provides for head tracking. Overall, the non-permanent nature of the system makes it surprisingly easy to integrate Virtual Reality into everyday environments.},
keywords = {immersive display system, large display system, cave},
}
@misc{codddowney2014leaplook,
title = {{LeapLook}: A Free-hand Gestural Travel Technique using the Leap Motion Finger Tracker},
author = {Codd-Downey*, Robert and Stuerzlinger, Wolfgang},
booktitle = {2nd Symposium on Spatial User Interaction},
publisher = {ACM},
series = {SUI '14},
howpublished = {Poster},
year = {2014},
month = {Oct},
pages = {153-153},
doi = {https://doi.org/10.1145/2659766.2661218},
abstract = {Contactless motion sensing devices enable a new form of input that does not encumber the user with wearable tracking equipment. We present a novel travel technique using the Leap Motion finger tracker which adopts a 2DOF steering metaphor used in traditional mouse and keyboard navigation in many 3D computer games.},
keywords = {3D navigation},
}
@misc{teather2014depthcues,
title = {Depth Cues and Mouse-Based {3D} Target Selection},
author = {Teather*, Robert J. and Stuerzlinger, Wolfgang},
booktitle = {2nd Symposium on Spatial User Interaction},
publisher = {ACM},
series = {SUI '14},
howpublished = {Poster},
year = {2014},
month = {Oct},
pages = {156-156},
doi = {https://doi.org/10.1145/2659766.2661221},
abstract = {We investigated mouse-based 3D selection using one-eyed cursors, evaluating stereo and head-tracking. Stereo cursors significantly reduced performance for targets at different depths, but the one-eyed cursor yielded some discomfort.},
keywords = {3D pointing},
}
@misc{pavlovych2014tivx,
title = {TIVX: Temporary Immersive Virtual Environment: A Non-Permanent CAVE},
author = {Pavlovych*, Andriy and Nywton+, Dayson and Stuerzlinger, Wolfgang},
booktitle = {GRAND NCE Conference},
series = {GRAND '14},
howpublished = {Demonstration},
year = {2014},
month = {May},
url = {http://grand-nce.ca/archives/annual-conference/grand-2014/program/poster-demo-experiences.html},
keywords = {immersive display system, cave},
}
@misc{arif2014howdo,
title = {How Do Users Interact with an Error Prone In-air Gesture Recognizer?},
author = {Arif*, Ahmed Sabbir and Stuerzlinger, Wolfgang and de Mendonça Filho+, Euclides José and Gordynski, Alec},
booktitle = {CHI Workshop on Gesture-based Interaction Design: Communication and Cognition},
howpublished = {Extended Abstract},
year = {2014},
month = {May},
numpages = {4},
pdf = {papers/errorpronegestures.pdf},
abstract = {We present results of two pilot studies that investigated human error behaviours with an error prone in-air gesture recognizer. During the studies, users performed a small set of simple in-air gestures. In the first study, these gestures were abstract. The second study associated concrete tasks with each gesture. Interestingly, the error patterns observed in the two studies were substantially different.},
keywords = {gestures, errors, mid-air},
}
@misc{arif2014error,
title = {Error Behaviours in an Unreliable In-Air Gesture Recognizer},
author = {Arif*, Ahmed Sabbir and Stuerzlinger, Wolfgang and de Mendonça Filho+, Euclides José and Gordynski, Alec},
booktitle = {Extended Abstracts on Human Factors in Computing Systems},
publisher = {ACM},
series = {CHI EA '14},
howpublished = {Extended Abstract},
year = {2014},
month = {May},
pages = {1603–1608},
doi = {https://doi.org/10.1145/2559206.2581188},
pdf = {papers/unreliableairgestures.pdf},
abstract = {This article presents results of two pilot studies that investigated error behaviours with an unreliable in-air gesture recognizer. During the studies, users performed a small set of simple in-air gestures. In the first study, these gestures were abstract. The second study associated concrete tasks with each gesture. The error patterns in the two studies were substantially different.},
keywords = {mid-air, gestures, errors},
}
@misc{teather2014fishtank,
title = {Fishtank Fitts: A Desktop VR Testbed for Evaluating {3D} Pointing Techniques},
author = {Teather*, Robert J. and Stuerzlinger, Wolfgang and Pavlovych*, Andriy},
booktitle = {Extended Abstracts on Human Factors in Computing Systems},
publisher = {ACM},
series = {CHI EA '14},
howpublished = {Extended Abstract},
year = {2014},
month = {May},
pages = {519–522},
doi = {https://doi.org/10.1145/2559206.2574810},
pdf = {papers/fishtankfittsdemo.pdf},
video = {videos/3DfishTankFitts.mp4},
abstract = {We present a desktop or "fish tank" virtual reality system for evaluating 3D selection techniques. Motivated by the successful application of Fitts' law to 2D pointing evaluation, the system provides a testbed for consistent evaluation of 3D point-selection techniques. The primary design consideration of the system was to enable direct and fair comparison between 2D and 3D pointing techniques. To this end, the system presents a 3D version of the ISO 9241-9 pointing task. Targets can be displayed stereoscopically, with head-coupled viewing, and at varying depths. The system also supports various input devices, including the mouse as well as 3D trackers in direct touch and remote pointing modes.},
keywords = {3D pointing},
}
@misc{stuerzlinger2013considerations,
title = {Considerations for Targets in {3D} Pointing Experiments},
author = {Stuerzlinger, Wolfgang},
booktitle = {Interactive Surfaces for Interaction with Stereoscopic {3D}},
series = {ISIS3D '13},
howpublished = {Extended Abstract},
year = {2013},
month = {Oct},
numpages = {4},
pdf = {papers/3Dtargets.pdf},
abstract = {We identify various tradeoffs around 3D pointing experiments based on Fitts' law and the ISO9241-9 methodology. The advantages and disadvantages of each approach are analyzed and compared against each other. We present some recommendations for 3D pointing experiments and avenues of future work.},
keywords = {3D pointing},
}
@misc{laldin2013up,
title = {Up- and Downwards Motions in {3D} Pointing},
author = {Laldin*, Sidrah and Teather*, Robert J. and Stuerzlinger, Wolfgang},
booktitle = {Symposium on Spatial User Interaction},
series = {SUI '13},
howpublished = {Poster},
year = {2013},
month = {Jul},
pages = {89-89},
doi = {https://doi.org/10.1145/2491367.2491393},
pdf = {papers/updownpointing.pdf},
abstract = {We present an experiment that examines 3D pointing in fish tank VR using the ISO 9241-9 standard. The experiment used three pointing techniques: mouse, ray, and touch using a stylus. It evaluated user pointing performance with stereoscopically displayed varying height targets above an upward-facing display. Results show differences in upwards and downwards motions for the 3D touch technique.},
keywords = {3D pointing},
}
@misc{bajer2013effects,
title = {Effects of Stereo and Head Tracking in {3D} Selection Tasks},
author = {Bajer*, Bartosz and Teather*, Robert J. and Stuerzlinger, Wolfgang},
booktitle = {Symposium on Spatial User Interaction},
series = {SUI '13},
howpublished = {Poster},
year = {2013},
month = {Jul},
pages = {77-77},
doi = {https://doi.org/10.1145/2491367.2491392},
pdf = {papers/headstereopointing.pdf},
abstract = {We report a 3D selection study comparing stereo and head-tracking with both mouse and pen pointing. Results indicate stereo was primarily beneficial to the pen mode, but slightly hindered mouse speed. Head tracking had fewer noticeable effects.},
keywords = {3D pointing},
}
@misc{stuerzlinger2013keynote,
title = {Modern Spatial and {3D} User Interfaces},
author = {Stuerzlinger, Wolfgang},
booktitle = {International Conference on Information Society},
publisher = {IEEE},
series = {iSociety '13},
howpublished = {Keynote abstract},
year = {2013},
month = {Jun},
pages = {9-9},
url = {https://ieeexplore.ieee.org/abstract/document/6636326},
abstract = {Three-dimensional (3D) user interfaces are popular in movies. Many current technologies enable people to interact with 3D content, also in computer games. I review the main ideas behind 3D user interfaces and present innovative solutions based on the capabilities and limitations of both humans and technologies.},
keywords = {3D user interfaces},
}
@comment{c, c={this has to be before the GRAND poster entry, as it attracted more citations than the poster}}
@misc{scheurich2013onehandedmating,
title = {A One-Handed Multi-Touch Mating Method for {3D} Rotations},
author = {Scheurich*, Doug and Stuerzlinger, Wolfgang},
booktitle = {Extended Abstracts on Human Factors in Computing Systems},
publisher = {ACM},
series = {CHI EA '13},
howpublished = {Extended Abstract},
year = {2013},
month = {Apr},
pages = {1623-1628},
doi = {https://doi.org/10.1145/2468356.2468646},
pdf = {papers/touchrotwip.pdf},
abstract = {Rotating 3D objects is a difficult task. We present a new rotation technique based on collision-free "mating" to expedite 3D rotations. It is specifically designed for one-handed interaction on tablets or touchscreens. A user study found that our new technique decreased the time to rotate objects in 3D by more than 60% in situations where objects align. We found similar results when users translated and rotated objects in a 3D scene. Also, angle errors were 35% less with mating. In essence, our new rotation technique improves both the speed and accuracy of common 3D rotation tasks.},
keywords = {3D manipulation},
}
@misc{scheurich2013mating,
title = {A One-Handed Multi-Touch Mating Method for {3D} Rotations},
author = {Scheurich*, Doug and Stuerzlinger, Wolfgang},
booktitle = {GRAND NCE Conference},
series = {GRAND '13},
howpublished = {Poster},
year = {2013},
month = {May},
abstract = {Rotating 3D objects is a difficult task. We present a new rotation technique based on collision-free "mating" to expedite 3D rotations. It is specifically designed for one-handed interaction on tablets or touchscreens. A user study found that our new technique decreased the time to rotate objects in 3D by more than 60% in situations where objects align. We found similar results when users translated and rotated objects in a 3D scene. Also, angle errors were 35% less with mating. In essence, our new rotation technique improves both the speed and accuracy of common 3D rotation tasks.},
keywords = {3D manipulation},
}
@misc{teather2013pointingtargets,
title = {Pointing at {3D} Target Projections with One-Eyed and Stereo Cursors},
author = {Teather*, Robert J. and Stuerzlinger, Wolfgang},
booktitle = {GRAND NCE Conference},
series = {GRAND '13},
howpublished = {Poster},
year = {2013},
month = {May},
abstract = {We present a study of cursors for selecting 2D-projected 3D targets. We compared a stereo- and mono-rendered (one-eyed) cursor using two mouse-based and two remote pointing techniques in a 3D Fitts' law pointing experiment. The first experiment used targets at fixed depths. Results indicate that one-eyed cursors only improve screen-plane pointing techniques, and that constant target depth does not influence pointing throughput. A second experiment included pointing between targets at varying depths and used only "screen-plane" pointing techniques. Our results suggest that in the absence of stereo cue conflicts, screen-space projections of Fitts' law parameters (target size and distance) yield constant throughput despite target depth differences and produce better models of performance.},
keywords = {3D pointing},
}
@misc{zaman2013alternatives,
title = {Alternatives in Generative Design},
author = {Zaman*, Loutfouz and Stuerzlinger, Wolfgang},
booktitle = {GRAND NCE Conference},
series = {GRAND '13},
howpublished = {Poster},
year = {2013},
month = {May},
keywords = {alternatives, design},
}
@misc{teather2012system,
title = {A System for Evaluating {3D} Pointing Techniques},
author = {Teather*, Robert J. and Stuerzlinger, Wolfgang},
booktitle = {18th Symposium on Virtual Reality Software and Technology},
publisher = {ACM},
series = {VRST '12},
howpublished = {Demonstration},
year = {2012},
month = {Dec},
pages = {209-210},
doi = {https://doi.org/10.1145/2407336.2407383},
pdf = {papers/3dpointingsystem.pdf},
abstract = {This demo presents a desktop VR system for evaluating human performance in 3D pointing tasks. The system supports different input devices (e.g., mouse and 6DOF remote pointer), pointing techniques (e.g., screen-plane and depth cursors), and cursor visualization styles (e.g., one-eyed and stereo 3D cursors). The objective is to comprehensively compare all combinations of these conditions. We especially focus in on fair and direct comparisons between 2D and 3D pointing tasks. Finally, our system includes a new pointing technique that outperforms standard ray pointing.},
keywords = {3D pointing},
}
@comment{c, c={leave the "_stuerzlinger" in the ID to enable umlaut-free search!}}
@misc{zeidler_stuerzlinger2012chinz,
title = {The Auckland Layout Editor: An Improved GUI Layout Specification Process},
author = {Zeidler*, Clemens and Lutteroth, Christof and Weber, Gerald and Stürzlinger, Wolfgang},
booktitle = {13th International Conference of the NZ Chapter of the ACM's Special Interest Group on Human-Computer Interaction},
series = {CHINZ '12},
howpublished = {Demonstration},
year = {2012},
month = {Jul},
pages = {103-103},
doi = {https://doi.org/10.1145/2379256.2379287},
abstract = {Constraint-based layout managers are more powerful than the common grid, grid-bag, and group layout managers. However, they are also more complex and come with potential problems such as over-constrained specifications and overlap in a GUI. Current GUI builders have little support for layout constraints, and it is not clear how such constraints can be made easily accessible to GUI designers. We will demonstrate a GUI builder - the Auckland Layout Editor (ALE) - that addresses these challenges, by allowing GUI designers to specify constraint-based layouts using only simple mouse operations. ALE guarantees that all operations lead to sound specifications, making sure that the layout is solvable and non-overlapping. To achieve the latter, we propose an algorithm that automatically generates the missing constraints that are necessary to keep a layout non-overlapping. Today's applications need to run on multiple devices with different screen sizes. For this a layout must have a good appearance at different sizes. To aid the designer in creating a layout with good resizing behavior, we propose a novel automatic layout preview, which displays the layout at its minimal and at an enlarged size chosen to visualize layout problems directly.},
keywords = {GUI, layout},
}
@misc{das2012comparing,
title = {Comparing Cognitive Effort in Spatial Learning of Text Entry Keyboards and {ShapeWriters}},
author = {Das*, Arindam and Stuerzlinger, Wolfgang},
booktitle = {Working Conference on Advanced Visual Interfaces},
series = {AVI '12},
howpublished = {Extended Abstract},
year = {2012},
month = {May},
pages = {649-652},
doi = {https://doi.org/10.1145/2254556.2254676},
pdf = {papers/effort2learn.pdf},
abstract = {Stable structured layouts of buttons are a primary means of control for input in current graphical user interfaces. Such layouts are ubiquitous - from tiny iPhone screens to large kiosk screens in the malls - they are found everywhere. Yet, there has been relatively little theoretical account that compares the impact of cognitive effort on learning such stable layouts. In this paper, we demonstrate that prior empirical results on cognitive effort in learning stable layouts are theoretically predictable through the memory activation model of a cognitive architecture, ACT-R. We go beyond previous work by quantitatively comparing the level of cognitive effort in terms of a newly introduced parameter in the declarative memory model of ACT-R. We theoretically compare the cognitive effort of two different layouts of graphical buttons with respect to their label representativeness in the domains of traditional keyboard and ShapeWriter.},
keywords = {text entry, learning},
}
@misc{teather2012cursors,
title = {Cursors for {3D} Pointing},
author = {Teather*, Robert J. and Stuerzlinger, Wolfgang},
booktitle = {The 3rd Dimension of CHI ({3DCHI}): Touching and Designing {3D} User Interfaces},
series = {3DCHI '12},
howpublished = {Extended Abstract},
year = {2012},
month = {May},
numpages = {8},
pdf = {papers/cursor3Dpointingshort.pdf},
abstract = {We present a study of cursors for 3D pointing/selection interfaces. We compared a stereo- and mono-rendered (one-eyed) cursor used with two mouse-based and two remote pointing techniques. This comparison was performed in a 3D Fitts' law pointing experiment with varying target depths. Results indicate that the one-eyed cursor is beneficial only for some pointing techniques. While the mouse-based techniques performed best, our new ray-screen technique outperforms traditional ray pointing. This is likely because it is less affected by target depth.},
keywords = {3D pointing},
}
@misc{arif2012how,
title = {How Do Users Adapt to a Faulty System?},
author = {Arif*, Ahmed Sabbir and Stuerzlinger, Wolfgang},
booktitle = {CHI Workshop on Designing and Evaluating Text Entry Methods},
series = {Textentry '12},
howpublished = {Extended Abstract},
year = {2012},
month = {May},
numpages = {4},
url = {http://www.textentry.org/chi2012},
pdf = {papers/faultysystemshort.pdf},
abstract = {We investigate how users gradually adapt to a faulty system and how the system error rate influences this adaptation process. We present results of a study that verifies that a user's learning rate to compensate for system errors depends on how erroneous that system is – they learn to avoid erroneous actions faster if errors occur more frequently.},
keywords = {gestures, errors},
}
@misc{stuerzlinger2012stereo,
title = {Stereo vs. One-Eyed Cursors for {3D} Pointing and Implications for Touch Interfaces},
author = {Stuerzlinger, Wolfgang and Teather*, Robert J.},
booktitle = {Touching the 3rd Dimension},
series = {Dagstuhl Seminar 12151},
howpublished = {Abstract},
year = {2012},
month = {Apr},
doi = {https://doi.org/10.4230/DagRep.2.4.1},
abstract = {We compare remote pointing and mouse pointing techniques using both a stereo- and mono-rendered cursor in a Fitts' law pointing experiment with varying target depths in a 3D scene. Results indicate that mouse-based techniques perform best and that the one-eyed cursor is beneficial only for some pointing techniques. We discuss the implications for 3D touch interfaces.},
keywords = {3D pointing},
}
@misc{zaman2012evaluation,
title = {Evaluation of a {3D} {UI} with Different Input Technologies},
author = {Zaman*, Loutfouz and Shuralyov*, Dmitri and Teather*, Robert J. and Stuerzlinger, Wolfgang},
booktitle = {Symposium on {3D} User Interfaces},
publisher = {IEEE},
series = {3DUI '12},
howpublished = {Extended Abstract},
year = {2012},
month = {Mar},
pages = {173-174},
doi = {https://doi.org/10.1109/3DUI.2012.6184217},
pdf = {papers/evalwiimouse.pdf},
abstract = {We present two studies of navigation and object manipulation in a virtual supermarket. The first study compared a mouse and keyboard setup to a game hardware setup using a Wii Remote, Wii Balance Board and a dancemat. The second study used more game-like software interfaces for both conditions and used only the Wii Remote and Nunchuk in the game-hardware setup. The mouse setup was around 36% faster in both studies. In the first study the mouse setup was 98% more accurate; no difference in accuracy was found in the second study.},
keywords = {3D pointing},
}
@misc{teather2012investigating,
title = {Investigating One-Eyed and Stereo Cursors for {3D} Pointing Tasks},
author = {Teather*, Robert J. and Stuerzlinger, Wolfgang},
booktitle = {Symposium on {3D} User Interfaces},
publisher = {IEEE},
series = {3DUI '12},
howpublished = {Extended Abstract},
year = {2012},
month = {Mar},
pages = {167-168},
doi = {https://doi.org/10.1109/3DUI.2012.6184214},
pdf = {papers/cursor3Dpointingposter.pdf},
abstract = {We compared two remote pointing techniques to two mouse pointing techniques using both with a stereo- and mono-rendered cursor. These were compared using a Fitts' law pointing experiment with varying target depths in a 3D scene. Results indicate that mouse-based techniques performed best and that the one-eyed cursor is beneficial only for some pointing techniques.},
keywords = {3D pointing},
}
@misc{stuerzlinger2011onoffline,
title = {On- and Off-Line User Interfaces for Collaborative Cloud Services},
author = {Stuerzlinger, Wolfgang},
booktitle = {CHI Workshop Designing Interaction for the Cloud},
howpublished = {Extended Abstract},
year = {2011},
month = {May},
numpages = {6},
pdf = {papers/cloudui.pdf},
abstract = {We describe a vision for user interfaces of cloud-based systems that permit seamless collaboration and provide also on- and off-line access to data. All individual components of this vision are currently available in various systems, but the sum of the components will satisfy user needs much more comprehensively.},
keywords = {GUI, cloud computing, off-line, collaboration},
}
@misc{pavlovych2011pursuit,
title = {Pursuit Tracking in Presence of Latency, Jitter, and Dropouts},
author = {Pavlovych*, Andriy and Stuerzlinger, Wolfgang},
booktitle = {GRAND NCE Conference},
series = {GRAND '11},
howpublished = {Poster},
year = {2011},
month = {May},
keywords = {latency, jitter, tracking},
}
@misc{zaman2011darls,
title = {DARLS: Differencing and Merging Diagrams Using Dual View Animation, Re-Layout, Layers and a Storyboard},
author = {Zaman*, Loutfouz and Kalra+, Ashish and Stuerzlinger, Wolfgang},
booktitle = {Extended Abstracts on Human Factors in Computing Systems},
publisher = {ACM},
series = {CHI EA '11},
howpublished = {Extended Abstract},
year = {2011},
month = {May},
pages = {1657-1662},
doi = {https://doi.org/10.1145/1979742.1979824},
pdf = {papers/darls.pdf},
abstract = {We present a new system for visualizing and merging differences in diagrams. It uses animation, dual views, a storyboard, relative re-layout, and layering to visualize differences. The system is also capable of differencing UML class diagrams. An evaluation produced positive results for animation and dual views with difference layer.},
keywords = {difference visualization},
}
@misc{shuralyov2011puzzle,
title = {A {3D} Desktop Puzzle Assembly System},
author = {Shuralyov*, Dmitri and Stuerzlinger, Wolfgang},
booktitle = {Symposium on {3D} User Interfaces},
publisher = {IEEE},
series = {3DUI '11},
howpublished = {3DUI contest entry},
year = {2011},
month = {Mar},
pages = {139-140},
doi = {https://doi.org/10.1109/3DUI.2011.5759244},
pdf = {papers/3dpuzzle.pdf},
video = {videos/Puzzle2x.mp4},
teaser = {teasers/3dpuzzle.png},
abstract = {We describe a desktop virtual reality system targeted at 3D puzzle assembly. The results of the evaluation show that all novices could successfully complete the puzzle within an average of about six minutes, while experts took about two minutes.},
keywords = {3D manipulation},
}
@misc{pavlovych2010effects,
title = {Effects of Latency Jitter and Dropouts in Pointing Tasks},
author = {Pavlovych*, Andriy and Stuerzlinger, Wolfgang},
booktitle = {GRAND NCE Conference},
series = {GRAND '10},
howpublished = {Poster},
year = {2010},
month = {Jul},
abstract = {Interactive computing systems frequently use pointing as an input modality, while also supporting other forms of input. We focus on pointing and investigate the effects of variations, i.e. jitter, in the input device latency, as well as dropouts, on 2D pointing speed and accuracy. First, we characterize the latency, latency jitter, and dropouts in several common input technologies. Then we present an experiment, where we systematically explore combinations of dropouts, latency, and latency jitter on a desktop mouse. The results indicate that latency and dropouts have a strong effect on human performance; moderate amounts of jitter in latency do not change performance in a significant way in most cases.},
keywords = {latency, jitter, pointing},
}
@misc{zaman2010interface,
title = {A New Interface for Cloning Objects in Drawing Systems},
author = {Zaman*, Loutfouz and Stuerzlinger, Wolfgang},
booktitle = {GRAND NCE Conference},
series = {GRAND '10},
howpublished = {Poster},
year = {2010},
month = {Jun},
abstract = {Cloning objects is a common operation in graphical user interfaces. A good example is calendar systems, where users commonly create and modify recurring events, i.e. repeated clones of a single event. Inspired by the calendar paradigm, we introduce a new cloning technique for 2D drawing programs. This technique allows users to clone objects by first selecting them and then dragging them to create clones along the dragged path. A novel approach for the generation of clones of clones is also presented. Moreover, the technique enables editing of the generated sequences of clones similar to the editing of calendar events.
We compared our new clone creation technique with generic duplication via copy-and-paste, smart duplication, and a dialog driven technique on a desktop system. The results show that the new cloning method is always faster than dialogs and faster than smart duplication for most conditions. We also compared our clone editing method against rectangular selection. The results show that our method is better in general. In situations where rectangle selection is effective, our method is still competitive. Participants preferred the new techniques overall, too.},
keywords = {cloning, drawing, copy, paste},
}
@misc{pavlovych2010effectslatency,
title = {Effects of Latency Jitter and Dropouts in Pointing Tasks},
author = {Pavlovych*, Andriy and Stuerzlinger, Wolfgang},
booktitle = {Graphics Interface},
series = {GI '10},
howpublished = {Poster},
year = {2010},
month = {May},
pages = {30-32},
abstract = {Interactive computing systems frequently use pointing as an input modality, while also supporting other forms of input. We focus on pointing and investigate the effects of variations, i.e. jitter, in the input device latency, as well as dropouts, on 2D pointing speed and accuracy. First, we characterize the latency, latency jitter, and dropouts in several common input technologies. Then we present an experiment, where we systematically explore combinations of dropouts, latency, and latency jitter on a desktop mouse. The results indicate that latency and dropouts have a strong effect on human performance; moderate amounts of jitter in latency do not change performance in a significant way in most cases.},
keywords = {latency, jitter, pointing},
}
@misc{arif2010mobile,
title = {Two New Mobile Touchscreen Text Entry Techniques},
author = {Arif*, Ahmed Sabbir and Lopez+, Mauricio H. and Stuerzlinger, Wolfgang},
booktitle = {Graphics Interface},
series = {GI '10},
howpublished = {Poster},
year = {2010},
month = {May},
abstract = {This article introduces two new mobile touchscreen text entry techniques. One is timeout-based and the other is pressure-based. Also, this work examines the effects of tactile feedback on text entry techniques. Empirical comparisons between conventional and proposed techniques show that the new techniques, as well as tactile feedback, enhance overall text entry performance.},
keywords = {text entry, mobile device},
}
@misc{agarwal2010widgetlens,
title = {{WidgetLens}: Interaction Through The Looking Glass},
author = {Agarwal*, Bhavna and Stuerzlinger, Wolfgang},
booktitle = {Graphics Interface},
series = {GI '10},
howpublished = {Poster},
year = {2010},
month = {May},
abstract = {Computer and mobile device screens are increasing in size and resolution. This increase in resolution causes problems with graphical user interfaces designed for lower resolution screens, as all information gets smaller and smaller. We present two novel techniques to make graphical user interfaces on high-resolutions screens more accessible and usable. We introduce a new in-place, localized zooming technique that works on a per widget basis. We also present a novel widget magnification technique that implements special modalities for common user interface elements, which affords widget-dependent magnification.},
keywords = {GUI, widget, magnification, layout},
}
@misc{dehmeshki2010design,
title = {Design of a Perceptual-Based Object Group Selection Technique},
author = {Dehmeshki*, Hoda and Stuerzlinger, Wolfgang},
booktitle = {Graphics Interface},
series = {GI '10},
howpublished = {Poster},
year = {2010},
month = {May},
abstract = {Selecting groups of objects is a common task in graphical user interfaces. Current selection techniques such as lasso and rectangle selection become time-consuming and error-prone in dense configurations or when the area covered by targets is large or hard to reach. This paper presents a new pen-based interaction technique that allows users to efficiently select perceptual groups formed by the Gestalt principle of good continuity.},
keywords = {group selection},
}
@misc{teather2010target,
title = {Target Pointing in {3D} User Interfaces},
author = {Teather*, Robert J. and Stuerzlinger, Wolfgang},
booktitle = {Graphics Interface},
series = {GI '10},
howpublished = {Poster},
year = {2010},
month = {May},
abstract = {We present two studies using ISO 9241-9 to evaluate target pointing in two different 3D user interfaces. The first study was conducted in a CAVE, and used the standard tapping task to evaluate passive haptic feedback. Passive feedback increased throughput significantly, but not speed or accuracy alone. The second experiment used a fish tank VR system, and compared tapping targets presented at varying heights stereoscopically displayed at or above the surface of a horizontal screen. The results indicate that targets presented closer to the physical display surface are generally easier to hit than those displayed farther away from the screen.},
keywords = {3D pointing},
}
@misc{ashtiani2009xnt,
title = {XNT: Object Transformation on Multi-Touch Surfaces},
author = {Ashtiani*, Behrooz and Stuerzlinger, Wolfgang},
booktitle = {Conference on Interactive Tabletops and Surfaces 2009},
series = {ITS '09},
howpublished = {Poster},
year = {2009},
month = {Nov},
numpages = {2},
pdf = {papers/xntposter.pdf},
video = {videos/XNT3D.mp4},
abstract = {We present and evaluate a new object transformation technique for multi-touch surfaces. Specifying complete object transformations for a two-dimensional space requires a minimum of four degrees of freedom (DOF): two for position, one for rotation, and another for scaling. Many existing techniques for object transformation are designed to function with traditional input devices such as mice, single-touch surfaces, or stylus pens. The challenge is then to compensate for the lack of DOF's. XNT is a new three-finger object transformation technique, designed specifically for multi-touch surface devices. It provides a natural interface for object manipulation and was experimentally found to be faster than previous techniques.},
keywords = {manipulation, touch},
}
@misc{teather2009coupling,
title = {Evaluating Visual/Motor Coupling in Fish Tank VR},
author = {Teather*, Robert J. and Allison, Robert and Stuerzlinger, Wolfgang},
booktitle = {CVR Conference},
series = {CVR '09},
howpublished = {Poster},
year = {2009},
month = {Jun},
keywords = {3D pointing},
}
@misc{teather2009effectslatency,
title = {Effects of Latency and Spatial Jitter on {2D} and {3D} Pointing},
author = {Teather*, Robert J. and Pavlovych*, Andriy and Stuerzlinger, Wolfgang},
booktitle = {Virtual Reality Conference},
publisher = {IEEE},
series = {VR '09},
howpublished = {Poster},
year = {2009},
month = {Mar},
pages = {229-230},
doi = {https://doi.org/10.1109/VR.2009.4811029},
abstract = {We investigate the effects of input device latency and spatial jitter on 2D pointing tasks and a 3D movement. First, we characterize jitter and latency in a 3D tracking device and an optical mouse used for baseline comparison. We present an experiment based on ISO 9241-9, which measures performance of pointing devices. We added latency and jitter to the mouse and compared it to a 3D tracker. Results indicate that latency has a stronger effect on performance than small spatial jitter. A second experiment found that erratic jitter "spikes" can affect 3D movement performance.},
keywords = {3D pointing, latency, jitter},
}
@misc{stuerzlinger2008nextgen,
title = {Next Generation {3D} Interaction Techniques},
author = {Stuerzlinger, Wolfgang and Wingrave*, Chad},
booktitle = {Virtual Realities},
series = {Dagstuhl Seminar 08231},
howpublished = {Abstract},
year = {2008},
month = {Jun},
url = {http://drops.dagstuhl.de/opus/volltexte/2008/1634},
abstract = {We present a set of guidelines for 3D positioning techniques. These guidelines are intended for developers of object interaction schemes in 3D games, modeling packages, computer-aided design systems, and virtual environments. The guidelines promote intuitive object movement techniques in these types of environments.},
keywords = {3D manipulation, 3D pointing},
}
@misc{das2008recall,
title = {Recall Accuracy Drive Visual Strategy Adaptation in Multi-tap Text Entry},
author = {Das*, Arindam and Stuerzlinger, Wolfgang},
booktitle = {Graphics Interface},
series = {GI '08},
howpublished = {Poster},
year = {2008},
month = {May},
abstract = {We present a cognitive model that demonstrates how the recall accuracy of letter positions on a cell phone keypad effects the transition from novice to expert behavior. In particular, we target multi-tap text entry methods and focus on the process of visually searching versus selecting (i.e. deciding) a letter on the keypad. The model predicts the probability of letter location recall by novice users through a cognitive architecture named ACT-R, and models learning as the user gradually gains cognitive expertise with practice, session after session. We then employ this probability within a model of strategy adaptation that encapsulates the effect of different visual exploration strategies: novice users search for a letter while the behavior of advanced users is modeled by the Hick-Hyman Law. The final output of our cognitive model is the entry speed for the key press for a letter in a letter-group containing multiple distinct letters.},
keywords = {text entry, learning},
}
@misc{dadgari2008analysis,
title = {Analysis of Merging Text Versions Using Differentiation Methods},
author = {Dadgari*, Darius and Stuerzlinger, Wolfgang},
booktitle = {Graphics Interface},
series = {GI '08},
howpublished = {Poster},
year = {2008},
month = {May},
abstract = {Comparing and selecting text from multiple versions of a document is a necessary task for a task-leader or group to undertake when users collaborate in writing a document, or when a single user generates different versions of a document to experiment with. Comparing multiple documents in an intuitive, efficient way allows a user to select the most appropriate portions of work from multiple sources quickly, to create a final document. Examination and even publications of text versioning methods are not documented in the literature, even though implementations of text versioning are abundant in a multitude of commercial and non-commercial software.
We propose new methods for text versioning, based on methods which have been previously shown to be effective for differentiating between objects. We plan to perform an extensive evaluation with these proposed methods to currently implemented ones in order to examine which methods are preferred by users and which show benefit in terms of error rate and completion time.},
keywords = {difference visualization},
}
@misc{dehmeshki2008using,
title = {Using Perceptual Grouping for Object Group Selection},
author = {Dehmeshki*, Hoda and Stuerzlinger, Wolfgang},
booktitle = {Graphics Interface},
series = {GI '08},
howpublished = {Poster},
year = {2008},
month = {May},
abstract = {Selection is a critical task in document processing systems, and is required for many manipulation operations such as deleting, moving, reusing, or re-formatting. Documents have usually a hierarchical structure. For example, books are naturally represented as a sequence of chapters, sections, subsections and so on until described completely in terms of basic component such as paragraphs, tabular material, and images. This structure is usually visualized using different formats (e.g. font sizes) or different views (e.g. outline views in Microsoft Words). Despite this inherent structure, to the best of our knowledge no selection technique systematically utilizes this structure in pen-based system. The multi-click approach is a standard selection method offered by many systems. Single, double, and triple clicking then selects the corresponding unit (e.g. word, line, and paragraph, respectively). This approach cannot select larger units than a paragraph and is not well suited for pen-based systems, as multi-clicking is unreliable for pens. Current selection techniques such as Rectangle, Lasso require users to explicitly define a selection scope by a pen movement. This can be time-consuming and error-prone when the target is large (e.g. multiple paragraphs) or spans more than a page. In the later case, the user has to select and scroll simultaneously. Moreover, these techniques are one directional, i.e. from the start point to the end point. The following common scenario describes potential problems: during a paragraph selection, the user decides to select the previous paragraph as well. She has two choices: either cancelling, relocating the mouse (pen), and re-starting a new selection, or selecting both paragraphs individually while using a phrasing technique (such as a Shift-key).
We propose a novel pen-based technique issues for selecting document components. Performing a pigtail gesture in a margin selects the nearby unit. Continuous pigtails extend selection to previous, next or both units according to the last pigtail orientation. Our technique automatically scrolls (or zooms out) when selecting off-screen targets.},
keywords = {group selection},
}
@misc{pavlovych2008effect,
title = {Effect of Group Size and Interaction Devices in Co-Located Computer Supported Collaborative Work},
author = {Pavlovych*, Andriy and Stuerzlinger, Wolfgang},
booktitle = {Graphics Interface},
series = {GI '08},
howpublished = {Poster},
year = {2008},
month = {May},
keywords = {large display interaction, collaboration, groupware, CSCW},
}
@misc{teather2008exaggerating,
title = {Exaggerating Head-Coupled Camera Motions in Fish Tank VR},
author = {Teather*, Robert J. and Stuerzlinger, Wolfgang},
booktitle = {Graphics Interface},
series = {GI '08},
howpublished = {Poster},
year = {2008},
month = {May},
abstract = {Virtually exaggerating head motions when using head-coupled viewing may be beneficial. This is especially important in environments where the user is sitting, such as in desktop or "fish-tank" VR. We present an evaluation of exaggerated head-coupled perspective for 3D assembly tasks. Three levels of exaggeration were compared to determine if exaggeration was beneficial compared to a direct mapping. The results suggest that there is some user preference towards modest levels of exaggeration. However, no significant differences by the experimental conditions were detected, other than a learning effect.},
keywords = {3D navigation},
}
@misc{dehmeshki2008intelligent,
title = {Intelligent Object Group Selection},
author = {Dehmeshki*, Hoda and Stuerzlinger, Wolfgang},
booktitle = {Extended Abstracts on Human Factors in Computing Systems},
publisher = {ACM},
series = {CHI EA '08},
howpublished = {Extended Abstract},
year = {2008},
month = {Apr},
pages = {3111-3116},
doi = {https://doi.org/10.1145/1358628.1358816},
pdf = {papers/gestaltclick.pdf},
abstract = {Current object group selection techniques such as lasso or rectangle selection can be time consuming and error prone. This is apparent when selecting distant objects on a large display or objects arranged along curvilinear paths in a dense area. We present a novel group selection technique based on the Gestalt principles of proximity and good continuity. The results of a user study show that our new technique outperforms lasso and rectangle selection for object groups in(curvi)linear arrangements or clusters, i.e. groups with an implicit structure.},
keywords = {group selection},
}
@misc{teather2008assessingeffects,
title = {Assessing the Effects of Orientation and Device on {3D} Positioning},
author = {Teather*, Robert J. and Stuerzlinger, Wolfgang},
booktitle = {Virtual Reality Conference},
publisher = {IEEE},
series = {VR '08},
howpublished = {Poster},
year = {2008},
month = {Mar},
pages = {293-294},
doi = {https://doi.org/10.1109/VR.2008.4480807},
pdf = {papers/move3dposter2.pdf},
abstract = {We present two studies to assess which physical factors of various input devices influence 3D object movement tasks. In particular, we evaluate the factors that seem to make the mouse a good input device for constrained 3D movement tasks. The first study examines the effect of a supporting surface across orientation of input device movement and display orientation. Surprisingly, no significant results were found for the effect of physical support for constrained movement techniques. Also, no significant difference was found between matching the orientation of the display to that of the input device movement. A second study found that the mouse outperformed all tracker conditions for speed, but the presence or absence of support had no significant effect when tracker movement is constrained to 2D.},
keywords = {3D pointing},
}
@misc{dehmeshki2007gestalt,
title = {Gestalt-Based Object Group Selection},
author = {Dehmeshki*, Hoda and Stuerzlinger, Wolfgang},
booktitle = {CVR Conference},
series = {CVR '08},
howpublished = {Poster},
year = {2007},
month = {Jun},
pdf = {papers/gestaltmodel2.pdf},
abstract = {Object grouping in graphical systems is supported by Lasso or Rectangle techniques which could require extra steps. This work presents a new approach to group objects by Gestalt principles of proximity, curve-linearity, similarity and common region. We demonstrate the results with several examples.},
keywords = {group selection},
}
@misc{teather2007challenge,
title = {The Challenge of {3D} Interaction: Guidelines for Intuitive {3D} Manipulation Techniques},
author = {Teather*, Robert J. and Stuerzlinger, Wolfgang},
booktitle = {Interacting with Immersive Worlds},
howpublished = {Abstract},
year = {2007},
month = {Jun},
numpages = {1},
abstract = {The rapid evolution of computer technology has made it possible to generate increasingly realistic virtual environments. However, despite the promise and hype of virtual reality that began in the 1980s, actual usage of the technology (outside of research settings) is limited primarily to derivatives of truly immersive VR, such as 3D video games. We suggest that one of the greatest barriers to widespread adoption of VR technology is the lack of intuitive interaction techniques available in virtual environments. True 3D manipulation is a 6 degree of freedom (6DOF) task, i.e. three independent axes of movement and three independent axes of rotation. Although we regularly perform such manipulations in reality with our hands, in a virtual environment, we are faced with a difficult choice of input devices: either use a familiar, but less immersive device, such as a mouse or use any of a number of unfamiliar and problematic 3D input devices. However, a mouse is a 2DOF device, providing movement in two directions only. Without support from software techniques that map 2D mouse movements into 6DOF operations, such a device is inadequate for manipulating objects in 3D.
One alternative is to use a higher DOF input device (e.g. 3D wands or gloves) which can provide high-precision 3D positioning and orientation. This is an attractive solution for immersive environments where the user is standing. Another possibility is to use a mouse with indirect manipulation techniques, such as 3D widgets, or control keys to toggle the axis of movement/rotation. However, both of these approaches present unique sets of problems. Full 6DOF input devices tend to be difficult to use and indirect manipulation techniques force the user to mentally decompose each manipulation into a series of steps. Both solutions require the user to think about the interface, rather than the task at hand.
A third approach is to use constraints, such as gravity, collision avoidance, etc. Building on this idea, we propose instead the use of "intelligent" 2DOF interaction techniques that automatically and intuitively map 2D mouse motions to 3D movement. One such technique, used for moving objects in the Sesame 3D conceptual modeling tool has been shown in experiments to be significantly faster and more accurate than both 6DOF input and 3D widget interaction techniques. This technique is an example of 3D direct manipulation, allowing users to "click and drag" objects in the scene. Dragging the object causes it to slide along the foremost visible surface behind it in the scene. This sliding motion behaves in a very predictable, natural way, and suggests that a mouse with suitably intelligent software support may be an ideal "3D" input device for certain VR and 3D applications, notably 3D modeling.
Based on this, and related research, we have composed a list of several guidelines for researchers developing immersive applications requiring 3D interaction. These guidelines are intended to aid designers in choosing methods of interaction, but are broad enough to encompass any type of 3D application requiring the accurate interactive positioning of objects in the environment. Current research suggests that techniques based on these guidelines may not only benefit mouse-based input, but input from higher-DOF devices as well.},
keywords = {3D manipulation},
}
@misc{teather2007evaluation,
title = {An Evaluation of {3D} Positioning Techniques for Scene Assembly},
author = {Teather*, Robert J. and Stuerzlinger, Wolfgang},
booktitle = {Symposium on {3D} User Interfaces},
publisher = {IEEE},
series = {3DUI '07},
howpublished = {Poster},
year = {2007},
month = {Mar},
numpages = {1},
pdf = {papers/move3dposter.pdf},
keywords = {3D manipulation, 3D positioning},
}
@misc{stuerzlinger2006covidsystem,
title = {{CoViD}: A System for Collaborative Virtual {3D} Design},
author = {Stuerzlinger, Wolfgang},
booktitle = {CSCW Workshop: Design and CSCW},
howpublished = {Extended Abstract},
year = {2006},
month = {Nov},
numpages = {2},
pdf = {papers/covid_short.pdf},
abstract = {Many important decisions in the design process are made fairly early on, after designers have presented initial concepts. In many domains, these concepts are now realized as 3D digital models and, in meetings, the stakeholders evaluate these potential solutions. Frequently, the participants in such a meeting want to interactively modify the proposed designs to explore the design space better. Today's systems and tools do not support this, as computer systems typically support only a single user and computer-aided design tools require significant training. This paper presents a new system to facilitate a collaborative 3D design process. The new system, CoViD, consists of two main parts. The first part is an easy-to-use conceptual 3D design tool that can be used productively even by naive users. The second part is a novel infrastructure for collaborative work, which offers an interactive table and several large interactive displays in a semi-immersive setup. The synthesis of both parts forms a new platform for collaborative virtual 3D design.},
keywords = {collaboration, design, 3D modeling},
}
@misc{dehmeshki2006perceptual,
title = {A Perceptual-based Group Selection Technique for Graph Drawing Systems},
author = {Dehmeshki*, Hoda and Stuerzlinger, Wolfgang},
booktitle = {Grace Hopper Conference},
howpublished = {Poster},
year = {2006},
month = {Oct},
keywords = {group selection},
}
@misc{stuerzlinger2006reality,
title = {Reality-Based Object Movement Techniques for {3D}},
author = {Stuerzlinger, Wolfgang and Dadgari*, Darius and Oh*, Ji-Young},
booktitle = {CHI Workshop: What is the Next Generation of Human-Computer Interaction?},
howpublished = {Extended Abstract},
year = {2006},
month = {Apr},
articleno = {D.3},
numpages = {4},
pdf = {papers/realitymove3d.pdf},
abstract = {Scene layout and part assembly are basic tasks in 3D object manipulation. While movement methods based on 3D or 6D input devices exist, the most efficient 3D movement techniques are based on utilizing only two degrees of freedom. This poses the problem of mapping the motion of the 2D input device to efficient and predictable object motion in 3D. We present a new method to map 2D input to 3D motion in this paper. The object position follows the mouse cursor position closely, while the object always stays in contact with other surfaces in the scene. In contrast to existing techniques, the movement surface and the relative object position is determined using the whole area of overlap of the moving object with the static scene. The resulting object movement is visually smooth and predictable, while avoiding undesirable collisions. The technique also utilizes the fact that people easily recognize the depth-order of shapes based on occlusions. The proposed technique runs in real-time. Finally, the evaluation of the new technique with a user study shows that it compares very favorably to conventional techniques.},
keywords = {3D manipulation, 3D positioning},
}
@misc{kulikov2006targeted,
title = {Targeted Steering Motions},
author = {Kulikov*, Sergey and Stuerzlinger, Wolfgang},
booktitle = {Extended Abstracts on Human Factors in Computing Systems},
publisher = {ACM},
series = {CHI EA '06},
howpublished = {Extended Abstract},
year = {2006},
month = {Apr},
pages = {983-988},
doi = {https://doi.org/10.1145/1125451.1125640},
pdf = {papers/targetsteer.pdf},
abstract = {In this paper we investigate targeted steering motions. Fitts' law is a very successful model to explain human targeting behavior, while the Steering law has been used to model steering motions. Dennerlein et al. combined these two models to explain targeted steering motions, but this combination introduces additional parameters. In this paper, we present a new, simpler, model that can be used to predict targeted steering motions.},
keywords = {steering},
}
@misc{dehmeshki2006using,
title = {Using Perceptual Grouping for Object Group Selection},
author = {Dehmeshki*, Hoda and Stuerzlinger, Wolfgang},
booktitle = {Extended Abstracts on Human Factors in Computing Systems},
publisher = {ACM},
series = {CHI EA '05},
howpublished = {Extended Abstract},
year = {2006},
month = {Apr},
pages = {700-705},
doi = {https://doi.org/10.1145/1125451.1125593},
pdf = {papers/gestaltmodel.pdf},
abstract = {Modern graphical user interfaces support the direct manipulation of objects and efficient selection of objects is an integral part of this user interface paradigm. For the selection of object groups most systems implement only rectangle selection and shift-clicking. This paper presents an approach to group selection that is based on the way human perception naturally groups objects, also known as the "Gestalt" phenomenon. Based on known results from perception research, we present a new approach to group objects by the Gestalt principles of proximity, curve-linearity, and closure. We demonstrate the results with several examples.},
keywords = {group selection},
}
@misc{kulikov2005measuring,
title = {Measuring the Effective Parameters of Steering Motions},
author = {Kulikov*, Sergey and {MacKenzie}, I. Scott and Stuerzlinger, Wolfgang},
booktitle = {Extended Abstracts on Human Factors in Computing Systems},
publisher = {ACM},
series = {CHI EA '05},
howpublished = {Extended Abstract},
year = {2005},
month = {Apr},
pages = {1569-1572},
doi = {https://doi.org/10.1145/1056808.1056968},
pdf = {papers/steeringwidth.pdf},
teaser = {teasers/steeringwidth.png},
abstract = {The steering law model describes pointing device motion through constrained paths. Previous uses of the model are deficient because they are built using only error-free responses, ignoring altogether the path of the cursor. We correct this by proposing and validating a technique to include spatial variability, including errors. The technique is a variant of the well-known "effective target width" used in Fitts' law models. An experiment designed to test our technique demonstrates the improvement: Correlations are consistently higher when spatial variability is included in building the model. Suggestions to aid further development of the steering law model are included.},
keywords = {steering},
}
@misc{stuerzlinger2005multi,
title = {MULTI: Multi-User Laser Table Interface},
author = {Stuerzlinger, Wolfgang},
booktitle = {CHI Workshop on Distributed Display Environments},
howpublished = {Extended Abstract},
year = {2005},
month = {Apr},
numpages = {2},
pdf = {papers/multi_design.pdf},
abstract = {We present a new system, which consists of an interactive table and several interactive wall displays and is designed to be used by a single person as well as collaboratively. A new kind of interaction device, based on laser pointes, affords both local (i.e. pen-based) as well as remote interaction. The research focuses on interaction techniques for this system as well as research on collaborative activities, in particular collaborative design.},
keywords = {large display system, large display interaction, collaboration, laser},
}
@misc{pavlovych2005windowmanager,
title = {A Window Manager for High Dynamic Range Display Systems},
author = {Pavlovych*, Andriy and Vorozcovs*, Andrew and Stuerzlinger, Wolfgang},
booktitle = {VR Workshop on Emerging Display Technologies},
howpublished = {Extended Abstract},
year = {2005},
month = {Mar},
pages = {31-34},
pdf = {papers/hdrwinmgr.pdf},
abstract = {The dynamic luminance range of many real-world environments exceeds the capabilities of current display technology by several orders of magnitude. Recently, new display systems have demonstrated, which are capable of displaying images with a dynamic luminance range much more similar to that encountered in the real world.
The paper summarizes how the human eye perceives high dynamic luminance ranges, sources of high dynamic range data, how the new display systems work, as well as their limitations. The paper discusses the need for a high dynamic range window manager and presents an initial implementation. Finally, the results of a preliminary evaluation are presented.},
keywords = {high dynamic range, GUI},
}
@misc{oh2004sesame,
title = {{SESAME}: {3D} Conceptual Design System},
author = {Oh*, Ji-Young and Stuerzlinger, Wolfgang},
booktitle = {SIGGRAPH Posters},
publisher = {ACM},
series = {SIGGRAPH '04},
howpublished = {Poster},
year = {2004},
month = {Aug},
numpages = {1},
doi = {https://doi.org/10.1145/1186415.1186461},
pdf = {papers/sesame_poster.pdf},
abstract = {We present a system for a conceptual design session in the desktop Virtual Environment (DVE) and Computer Aided Design (CAD). We consider easy modification to be important for conceptual sessions, as users alter the design frequently in those sessions. The system presents new techniques to make the modification of a scene easy.},
keywords = {3D manipulation, 3D positioning, design},
}
@misc{pouliquen2004hog,
title = {{HOG}: A New Model Representation for {3D} Acquisition and Planning},
author = {Pouliquen*, Gilles and Stuerzlinger, Wolfgang},
booktitle = {Canadian Conference on Intelligent Systems},
howpublished = {Poster},
year = {2004},
month = {Jun},
numpages = {1},
pdf = {papers/HOG_poster.pdf},
abstract = {Digital acquisition of 3D objects is a process in which a computer model of a physical object is constructed. This process is extremely popular nowadays as the resulting computer models have many applications. The acquisition process can be decomposed into four stages which have to be repeated until a satisfying model is obtained. Those four stages are scanning, registration, integration and planning [1].
The planning stage is needed because an object cannot be modeled from a single scan. It is necessary to measure the object from various points of view to obtain a complete model.
Currently, there is no system that can automatically scan an unknown object. Hence, a highly trained operator is needed to control the scanning device. The operator must select poses for the scanner such that the number of scans required to completely scan the object is kept reasonably small.
We present a novel representation for the model: the Hierarchical Occupancy Grid (HOG). This representation can be used for the integration and planning stage of the 3D acquisition pipeline.},
keywords = {3D scanning, next-best view},
}
@misc{stuerzlinger2004presentation,
title = {High Dynamic Range Display System},
author = {Stuerzlinger, Wolfgang},
booktitle = {DRDC/CVR Workshop},
howpublished = {Abstract},
year = {2004},
month = {Mar},
keywords = {high dynamic range, display},
}
@misc{pavlovych2003modeling,
title = {Modeling non-Expert Text Entry Speed on Phone Keypads},
author = {Pavlovych*, Andriy and Stuerzlinger, Wolfgang},
booktitle = {16th Annual ACM Symposium on User Interface Software and Technology},
series = {UIST '03},
howpublished = {Poster},
year = {2003},
month = {Nov},
pdf = {papers/nonexpertmodel.pdf},
abstract = {For mobile phones, previous research has created models that can be used to predict expert performance. However, one important factor that influences the success of new interaction techniques is the users' initial experience with them. In this work, we present a new model to predict text entry speed on 12-button mobile phone keypads for novices. The model is based on Fitts' law, letter digraph probabilities, and a model of the mental processing time before key presses.},
keywords = {text entry, novice},
}
@misc{seetzen2003emerging,
title = {High Dynamic Range Display System},
author = {Seetzen*, Helge and Whitehead, Lorne and Stuerzlinger, Wolfgang and Vorozcovs*, Andrew and Wilson, Hugh and Ashdown, Ian and Ward, Greg},
booktitle = {Emerging Technologies at ACM SIGGRAPH 2003},
series = {SIGGRAPH '03},
howpublished = {Demonstration},
year = {2003},
month = {Jul},
numpages = {1},
pdf = {papers/hdr_demonstration.pdf},
abstract = {We have developed a high dynamic range (HDR) display capable of presenting a luminance range of 10,000 cd/m2 to 0.1 cd/m2. In addition to the initial embodiment of the technology, we have developed a flat-panel version using light emitting diodes (LED) which offers the same dramatic dynamic range benefits in a much smaller package.},
keywords = {high dynamic range, display},
}
@misc{yourganov2002simulation,
title = {Simulation of Camera Distortions},
author = {Yourganov*, Grigori and Stuerzlinger, Wolfgang},
booktitle = {Space Vision and Advanced Robotics},
series = {SVAR '02},
howpublished = {Poster},
year = {2002},
month = {Jun},
keywords = {camera distortion},
}
@techreport{yourganov2001tonemapping,
title = {Tone-Mapping for High Dynamic Range Images},
author = {Yourganov*, Grigori and Stuerzlinger, Wolfgang},
institution = {Dept. of Computer Science, York University, Canada},
type = {Technical Report},
year = {2001},
month = {Dec},
numpages = {12},
pdf = {papers/TR_tonemapping.pdf},
keywords = {high dynamic range, tone mapping},
}
@misc{yourganov2001hdrvideo,
title = {High Dynamic Range Video},
author = {Yourganov*, Grigori and Stuerzlinger, Wolfgang},
booktitle = {York CVR Conference: Levels of Perception},
series = {CVR '01},
howpublished = {Poster},
year = {2001},
month = {Jun},
keywords = {high dynamic range, video},
}
@techreport{yourganov2001acquiring,
title = {Acquiring High Dynamic Range Video at Video Rates},
author = {Yourganov*, Grigori and Stuerzlinger, Wolfgang},
institution = {Dept. of Computer Science, York University, Canada},
type = {Technical Report},
year = {2001},
month = {May},
numpages = {18},
pdf = {papers/TR_hdrvideo.pdf},
abstract = {In the real world, the scene may contain some well-illuminated areas as well as some areas that are in the darkness. The dynamic range of the scene, or the radiance ratio between the brightest and the darkest spots, can be quite big – it can span several orders of magnitude in some cases. This is a lot wider range than the range that our digital camera can adequately capture, and that our monitor can adequately display. The areas that are too bright for the dynamic range of our camera are going to be saturated on our image, and the areas that are too dark will be under-exposed. In both cases, all the information about these areas will be lost in the image.
A way to solve this problem is to combine different shutter speeds of our camera. Smaller shutter speeds can give us good information about the bright areas (because we won't have saturation), and longer shutter speeds effectively capture the dark areas. So by alternating the shutter speeds and by combining the two images into one in real-time, we can achieve higher dynamic range for digital video cameras.},
keywords = {high dynamic range, video},
}
@misc{yourganov2001poster,
title = {High Dynamic Range Video},
author = {Yourganov*, Grigori and Stuerzlinger, Wolfgang},
booktitle = {Vision and Intelligent Systems Workshop},
howpublished = {Poster},
year = {2001},
month = {May},
keywords = {high dynamic range, video},
}
@misc{poupyrev20003duibib,
title = {20th Century {3DUI} Bib: Annotated Bibliograpy of {3D} User Interfaces of the 20th Century},
author = {Poupyrev, Ivan and Kruijff, Ernst and Bowman, Doug and Billinghurst, Mark and Cugini, John and Dachselt, Raimund and Hinckley, Ken and {LaViola}, Joe and Lindeman, Rob and Pierce, Jeff and Steed, Anthony and Stuerzlinger, Wolfgang},
year = {2000},
month = {Jan},
url = {http://people.cs.vt.edu/~bowman/3dui.org/bibs/3duibib.pdf},
commented-url = {http://www.mic.atr.co.jp/~poup/3dui/3duibib.htm},
commented-url2 = {https://web.archive.org/web/20070223123901/http://www.mic.atr.co.jp/~poup/3dui/3duibib.htm},
}
@misc{elinas2000clouds,
title = {Real Time Rendering of {3D} Clouds},
author = {Elinas*, Pantelis and Stuerzlinger, Wolfgang},
booktitle = {Graphics Interface},
series = {GI '00},
howpublished = {Poster},
year = {2000},
month = {May},
numpages = {3},
pdf = {papers/cloudsposter.pdf},
abstract = {There is a myriad of real-time graphics applications that can greatly increase in realism with the introduction of realistic clouds in the scenery. These include applications in virtual reality, outdoor scene visualization, flight simulation, games etc. In the past, several researchers have proposed algorithms for realistic cloud rendering for non-real-time applications. Of these, the approaches of Gardner 85 and Nishita 96 stand out as the ones that give the most visually pleasing results. In our work, we are developing an implementation of Gardner's 3D cloud rendering algorithm augmented with recent advances such as photon maps with the help of hardware accelerated OpenGL.
Our implementation follows closely, Gardner's approach. We use textured ellipsoids as the building blocks for the clouds. We use Perlin noise textures compared to Gardner's spectral noise textures because we have more flexibility in controlling their appearance. The texture used is an indication of the volume density of the ellipsoid. Rendering the ellipsoids produces ellipses. Because clouds are more transparent at their edges compared to their middle, a result of the fact that the center of a cloud is denser, we need to fuzz out the edges of the ellipses.
Each cloud is made of a number of ellipsoids. The first step is to render each of the ellipsoids individually and evaluate the transparency over the resulting ellipse. The next step is to combine all the ellipses together to render the complete cloud.
Equation (1) is used to compute the transparency as a function of two thresholds one applied to the edge (T1) and one applied to the center of
the ellipse (T2). The values produced are consistent with OpenGL alpha channel values. We use a normalizing factor D just as Gardner did. We generate the function g(x,z) over the ellipsoid by utilizing projective textures. The latter function is maximum at the center of the ellipse and goes to zero at its edges; a spotlight texture is used to generate this effect. Evaluation is done partly in the alpha channel and partly in the RGB channels of the frame buffer in two steps. First T2*(1-g(x,z)) is computed and stored in the RGB channels. The It-T1 part is computed in the alpha channel. We then perform α = (R-α) by utilizing the color matrix extension. We set the color matrix to copy the red to the alpha channel while setting up subtractive blending and then we perform the operation by copying the frame buffer onto itself. The 1/D scaling is also achieved in the same step by including the 1/D term in the color matrix. The result is stored in the alpha channel while the RGB channels are cleared to accept new data in the next step.
Next we render the ellipsoids using a second texture that determines their color. We use another Perlin noise texture modulated with the color of the ellipsoids calculated using an infinite light source representing the Sun. The latter produces a simple approximation to global illumination of the cloud even though effects such as self-shading of the cloud is not taken into account. We are currently investigating better approaches to this such as using photon maps. The results of this step are stored in the RGB channels.
At this point the back buffer holds each of the ellipses including their transparency. We read these data into a texture of the smallest size that includes all the ellipses. Then, we calculate where on the screen each of the ellipses should appear and we render textured rectangles for each of the ellipsoids. We render each of the rectangles in the order of back to front with respect to the position of the ellipsoids in 3D; the ellipsoids are originally sorted roughly from back to front with respect to the location of their center.
This implementation is compatible with standard OpenGL hardware in its majority with the exception of the color matrix extension that is only available on SGI machines. Our implementation achieves real-time frame rates on low-end workstations such the SGI NT 320 and SGI O2 machines. More complex clouds made of 130+ ellipsoids can be rendered in real-time on more powerful machines such as the SGI Onyx.},
keywords = {rendering, real-time},
}
@misc{salzman2000constraint,
title = {Constraint Based {3D} Scene Construction},
author = {Salzman*, Tim and Smith*, Graham and Stuerzlinger, Wolfgang},
booktitle = {Graphics Interface},
series = {GI '00},
howpublished = {Poster},
year = {2000},
month = {May},
numpages = {2},
pdf = {papers/miveposter.pdf},
abstract = {Realistic 3D scenes often contain thousands of objects, and are in general difficult to model using today's CAD programs. We address this problem by exploiting predefined semantic relationships between objects to dynamically group and constrain them [GS99]. Virtual constraints, which de-couple the object's geometry from its constraints, are presented. Also discussed are techniques for dynamically grouping and re-grouping objects based on their semantic and virtual constraints. Preliminary testing shows that our system provides a fast, intuitive user interface for 3D scene construction. Finally, we will present ideas for future work.
Positioning objects in a virtual environment is not an intuitive task. One approach is direct manipulation using a six degree of freedom (DOF) input device. However, it is hard to position objects precisely using these devices, users often become fatigued, and many object interactions can be more effectively accomplished using a simple 2D interface such as a mouse [HPGK+94]. For these reasons, much research has been focused on software techniques for manipulating 3D objects using standard 2D input devices.
Bier [Bi90] presented snap-dragging for interactive solid modeling systems. This system used a general purpose gravity function and alignment manifolds to position objects in the scene. Snap-dragging provided easy selection of object features but the system required a complex user interface, had an unchangeable view and was computationally intensive.
In Object Associations [BS95], Bukowski and Sequin use a combination of physical properties (pseudo gravity) and goal oriented behaviour (alignment) to position and manipulate objects in a scene. This system was used to model the Berkeley Soda Hall WALKTRHU environment, which contained thousands of objects. However, adding new objects to the library is difficult, as object association must be coded. Constrained objects do not always move together because there is no dynamic grouping, instead the scene is searched for associated objects each time an object is moved. Further, all associations in this system are limited by object geometry.
Gosele exploited natural object behaviour to define and maintain object constraints [Go99]. Polygons were used to define offer and constraint areas, and a hierarchical labelling system was used to define which polygons could be constrained together. Typical constraint labels were on-Floor, on-Wall, and on-Workspace. Collision detection was added to the system to add realism by preventing inter-object penetrations. However, once constrained, objects in this system could not be unconstrained. Also, multiple constraints between two-objects were not possible.
Our system improves upon previous work in the following ways. Firstly, we allow constraints to be broken by pulling away from the constraining surface. For example, an object constrained to the floor and the wall can be unconstrained from the wall by pulling the object away from the wall. Also, an object can be re-constrained by translating it to another acceptable offer area. To show the user which offer areas will accept an object, all acceptable offer areas are highlighted when an object is selected for translation. Un-constraining and re-constraining an object invokes the dynamic grouping mechanism, which maintains the constraint relationships between objects.
We present the notion of virtual constraints. A virtual-constraint can be any polygon in 3D object-space, not necessarily associated with the object's geometry. An example is a polygon somewhere beneath a table, to which the front of a chair may be constrained. We present negative constraints, which are a specialization of virtual constraints are. Negative constraints are useful for defining volumes of space in which certain objects should not be placed. For example a desk would not be placed against a doorway because it would make the door inaccessible.
Our system has optimized the constraint satisfaction algorithm by pruning the search for valid offer areas and using a minimal distance constraint, typically the bounding radius of an object.
Finally, we present dual-constraints, bi-directional constraints between objects. When two or more objects are constrained by dual constraints, they form a dual-group. Using a drag-add technique, a row of constrained, neatly aligned books can be created on a bookshelf with one interaction step. We introduce the push-pull metaphor for interacting with a dual-group. When a dual-group is selected for translation, a connected-component search finds all group members who are attached to the selected object by dual-constraints in the approximate direction of translation. Those objects that are not attached in the direction of translation are un-grouped. With this technique, a row of cabinets that are connected by dual groups can be split into two groups by selecting a cabinet in the center and pulling in the direction that the new group is to translate.
Preliminary testing of the system is very promising. After a very short demo of the system, first time users were able to recreated a reasonably complicated scene in a matter minutes. Future plans are to test the system rigorously and compare results to a system with conventional interaction techniques.},
keywords = {3D manipulation},
}
@misc{stcyr2000knowledge,
title = {A Knowledge-Based Agent for CAD systems},
author = {St-Cyr+, Olivier and Lesperance, Yves and Stuerzlinger, Wolfgang},
booktitle = {Graphics Interface},
series = {GI '00},
howpublished = {Poster},
year = {2000},
month = {May},
numpages = {2},
pdf = {papers/agentposter.pdf},
abstract = {This poster describes an approach in improving the usability of computer-aided design (CAD) applications by adding an intelligent agent that assists the user in his/her interaction with the system. To implement the agent, I used ConGolog [GLL97, LLR99] – a very high-level programming language for developing knowledge-based agents that are embedded in complex environments. ConGolog supports the specification of a task-level model of a dynamic environment, the description of complex behaviours, and the synthesis of new plans at run-time. A prototype intelligent agent is being developed to work with an existing 3D CAD system [GS99]. This agent is intended to help the user in designing an office layout that satisfies his goals.
The CAD system [GS99] that our intelligent agent works with is built to allow the user to design a 3D virtual environment (office, kitchen, living room, etc.). The system's graphical user interface is quite simple. Interactions consist primarily of using the mouse to pick and place various types of objects (desk, chair, lamp, inkwell, etc.) in the room layout. In this, it resembles the Object Associations system [BS95]. The system handles the details of interactions based on a model of objects and the physical constraints that hold in the scene, for instance, an object being supported by a particular surface. But the system lacks a model of the user, of the task that he/she is trying to perform, and of the objectives that he/she is trying to achieve. It cannot really assist the user in quickly creating the desired room layout.
An early example for a system that attempts to aid the user in creating a room layout is CRACK [FM88]. This 2D system critiques the current design with text messages that explain the problem. The domain knowledge embedded in the critiquing system is not used to actively aid the user for placing objects.
It is believed that the use of intelligent agent technology can provide many benefits in the area of layout systems. An agent would maintain a high-level representation of the application domain, including object behaviour and user knowledge and goals. This could be used to enforce complex application specific constraints on the way objects are manipulated and on the layouts
that are produced. Secondly, such a model could be used for disambiguation and consistency checking. Humans often communicate information about a task very inaccurately because they understand the context of the task and its goals from previous experience. An agent could use its domain knowledge to resolve ambiguities, as well as ask more meaningful questions when user input is required. Moreover, the user goal model could be exploited to detect inadvertent errors. Thirdly, the agent could also aid the user in constructing the virtual design using its knowledge of the domain and user goals. Because it is aware of the current state of the design, it can provide suggestions and advice to the user, guide him through the task, and respond to user's questions. All this would lead towards much more natural and intuitive interaction between the user and the CAD system.},
keywords = {3D manipulation, design},
}
@misc{stcyr2000intelligent,
title = {An Intelligent Assistant for Computer-Aided Design},
author = {St-Cyr+, Olivier and Lesperance, Yves and Stuerzlinger, Wolfgang},
booktitle = {Smart Graphics: Papers from the AAAI Spring Symposium},
series = {SG '00},
isbn = {978-157735110-8},
howpublished = {Extended Abstract},
year = {2000},
month = {Mar},
pages = {24-28},
url = {https://aaai.org/Library/Symposia/Spring/ss00-04.php},
pdf = {papers/intelagent.pdf},
abstract = {This paper describes an approach in improving the usability of computer-aided design (CAD) applications by adding an intelligent agent that assists the user in his/her interaction with the system. To implement the agent, we use ConGolog [GLL97, LLR99] – a very high-level programming language for developing knowledge-based agents that are embedded in complex environments. ConGolog supports the specification of a task-level model of a dynamic environment, the description of complex behaviors, and the synthesis of new plans at run-time. A prototype intelligent agent is being developed to work with an existing 3D CAD system [GS99]. This agent is intended to help the user in designing an office layout that satisfies his goals.
The CAD system [GS99] that our intelligent agent works with is built to allow the user to design a 3D virtual environment (office, kitchen, living room, etc.). The system's graphical user interface is quite simple. Interactions consist primarily of using the mouse to pick and place various types of objects (desk, chair, lamp, inkwell, etc.) in the room layout. In this it resembles the Object Associations system [BS95]. The system handles the details of interactions based on a model of objects and the physical constraints that hold in the scene, for instance, an object being supported by a particular surface. But the system lacks a model of the user, of the task that he is trying to perform, and of the objectives that he is trying to achieve. It cannot really assist the user in quickly creating the desired room layout.
An early example for a system that attempts to aid the user in creating a room layout is CRACK [FM88]. This 2D system critiques the current design with text messages that explain the problem. The domain knowledge embedded in the critiquing system is not used to actively aid the user for placing objects.
We believe that the use of intelligent agent technology can provide many benefits in the area of layout systems. An agent would maintain a high-level representation of the application domain, including object
behavior and user knowledge and goals. This could be used to enforce complex application specific constraints on the way objects are manipulated and on the layouts that are produced. Secondly, such a model could be used for disambiguation and consistency checking. Humans often communicate information about a task very inaccurately, because they understand the context of the task and its goals from previous experience. An agent could use its domain knowledge to resolve ambiguities, as well as ask more meaningful questions when user input is required. Moreover, the user goal model could be exploited to detect inadvertent errors. Thirdly, the agent could also aid the user in constructing the virtual design using its knowledge of the domain and user goals. Because it is aware of the current state of the design, it can provide suggestions and advice to the user, guide him through the task, and respond to user questions. All this would lead to much more natural and intuitive interaction between the user and the CAD system.},
keywords = {3D modeling, 3D manipulation, constraints},
}
@comment{c, c={leave the "_stuerzlinger" in the ID to enable umlaut-free search!}}
@techreport{bastos_stuerzlinger1998forward,
title = {Forward Mapped Planar Mirror Reflections},
author = {Bastos*, Rui and Stürzlinger, Wolfgang},
institution = {Univ. of North Carolina at Chapel Hill},
type = {Technical Report},
year = {1998},
month = {Aug},
number = {TR98-026},
numpages = {12},
pdf = {papers/TR98-026.pdf},
abstract = {This paper presents a new technique, which we call depth-preserving reflection mapping, to render mirror-like reflections on planar surfaces in constant time. It is a hybrid solution which combines geometry-based rendering and image-based rendering into a two-pass mirror reflection rendering approach. The technique extends the traditional reflection mapping to preserve depth per texel and uses forward warping to approximate the mirror-like reflections on planar surfaces. For clarity, to distinguish these texels from the ones of traditional reflection mapping, we call them zexels.},
keywords = {rendering, real-time},
}
@comment{c, c={leave the "_stuerzlinger" in the ID to enable umlaut-free search!}}
@techreport{raskar_stuerzlinger1998efficientimage,
title = {Efficient Image Generation for Multiprojector and Multisurface Displays},
author = {Raskar*, Ramesh and Cutts*, Matt and Welch, Greg and Stürzlinger, Wolfgang},
institution = {Univ. of North Carolina at Chapel Hill},
type = {Technical Report},
year = {1998},
month = {Apr},
number = {TR98-016},
numpages = {12},
pdf = {papers/TR98-016.pdf},
abstract = {We describe an efficient approach to rendering a perspectively correct image on a potentially irregular display surface that may be illuminated with one or more distinct devices. The first pass of the technique generates an image of the desired graphics model using conventional rendering. The second pass projects that image as a texture onto a model of the display surface, then re-renders the textured display surface model from the viewpoint of each display device. The algorithm scales with the complexity of the display surface, and is constant with respect to the complexity of the graphics model.},
keywords = {rendering, projector, real-time},
footnote = {Extended version of EGSR '98 paper with theoretical analysis},
}
@comment{c, c={leave the "_stuerzlinger" in the ID to enable umlaut-free search!}}
@misc{schaufler_stuerzlinger1998hierarchical,
title = {{3D} Hierarchical Image Cache},
author = {Schaufler*, Gernot and Stürzlinger, Wolfgang},
booktitle = {Workshop on Image-Based Rendering and Modeling},
howpublished = {Poster},
year = {1998},
month = {Mar},
commented-url = {http://www.gup.uni-linz.ac.at:8001/staff/schaufler/papers/octimp},
keywords = {rendering, real-time},
}
@techreport{aliaga_stuerzlinger1998framework,
title = {A Framework for the Real-Time Walkthrough of Massive Models},
author = {Aliaga*, Daniel and Cohen*, Jon and Wilson*, Andrew and Zhang*, Hansong and Erikson*, Carl and Hoff*, Kenny and Hudson*, Tom and Stürzlinger, Wolfgang and Baker*, Eric and Bastos*, Rui and Whitton, Mary and Brooks, Fred and Manocha, Dinesh},
institution = {Univ. of North Carolina at Chapel Hill},
type = {Technical Report},
year = {1998},
month = {Mar},
number = {TR98-013},
numpages = {12},
url = {https://techreports.cs.unc.edu/papers/98-013.pdf},
pdf = {papers/TR98-013.pdf},
abstract = {We present a framework for rendering very large 3D models at nearly interactive rates. The framework scales with model size. Our framework can integrate multiple rendering acceleration techniques, including visibility culling, geometric levels of detail, and image-based approaches. We describe the database representation scheme for massive models used by the framework. We provide an effective pipeline to manage the allocation of system resources among different techniques. We demonstrate the system on a model of a coal-fired power plant composed of more than 15 million triangles.},
keywords = {rendering, real-time},
}
@techreport{stuerzlinger1998imaging,
title = {Imaging all Visible Surfaces Or How many Reference Images are needed for Image-Based Modeling?},
author = {Stürzlinger, Wolfgang},
institution = {Univ. of North Carolina at Chapel Hill},
type = {Technical Report},
year = {1998},
month = {Mar},
number = {TR98-010},
numpages = {11},
pdf = {papers/TR98-010.pdf},
abstract = {Today many systems exist to generate geometric models of existing scenes and objects. However, no accurate data about surface appearance such as colors and textures is stored in this process. Such data can be captured as a series of images that, collectively, capture all surfaces of the object.
This work introduces a method to compute a minimal set of camera positions for this purpose. Taking images from the computed positions can then be used to derive a complete set of surface appearance data. A slightly different application of the presented method is the computation of a minimal set of viewpoints for reference images to be used in image-based rendering methods.
First a method to determine an optimal set of viewpoint regions for a given scene is introduced. It uses a hierarchical visibility method to preprocess the scene. Then a technique to find an optimal set of viewpoint regions is presented and the solution is used to derive an optimal set of viewpoints. Results and visualizations of the computed solutions are presented.},
keywords = {3D scanning, visibility},
}
@techreport{stuerzlinger1995discontinuity,
title = {Discontinuity Meshing for a Radiosity Algorithm},
author = {Stürzlinger, Wolfgang},
institution = {GUP, Johannes Kepler Universität Linz, Austria},
type = {Technical Report},
year = {1995},
month = {Oct},
number = {CEI PACT D4V-8},
url = {https://www.jku.at/forschung/forschungs-dokumentation/publikation/2155},
keywords = {rendering, global illumination},
}
@techreport{stuerzlinger1995form,
title = {Form Factor Calculation for a Parallel Radiosity Algorithm},
author = {Stürzlinger, Wolfgang},
institution = {GUP, Johannes Kepler Universität Linz, Austria},
type = {Technical Report},
year = {1995},
month = {Jul},
number = {CEI-PACT D4V-6},
url = {https://www.jku.at/forschung/forschungs-dokumentation/publikation/2142},
keywords = {rendering, global illumination, parallel, visibility},
}
@comment{c, c={leave the "_stuerzlinger" in the ID to enable umlaut-free search!}}
@misc{schaufler_stuerzlinger1995parallelposter,
title = {Parallel Radiosity},
author = {Schaufler*, Gernot and Stürzlinger, Wolfgang and Volkert, Jens},
booktitle = {Workshop on Algorithms for Future Technologies},
howpublished = {Poster},
year = {1995},
month = {Mar},
commented-location = {Prague, CZ},
keywords = {rendering, global illumination, parallel},
}
@comment{c, c={leave the "_stuerzlinger" in the ID to enable umlaut-free search!}}
@techreport{schaufler_stuerzlinger1995load,
title = {Load Balancing for a Parallel Radiosity Algorithm},
author = {Schaufler*, Gernot and Stürzlinger, Wolfgang and Wild*, Christoph},
institution = {GUP, Johannes Kepler Universität Linz, Austria},
type = {Technical Report},
year = {1995},
month = {Jan},
number = {CEI PACT D4V-3},
url = {https://www.jku.at/forschung/forschungs-dokumentation/publikation/2134},
keywords = {rendering, global illumination, parallel, visibility},
}
@techreport{stuerzlinger1994description,
title = {Description and Implementation of a Parallel Radiosity Algorithm},
author = {Stürzlinger, Wolfgang and Wild*, Christoph and Schaufler*, Gernot},
institution = {GUP, Johannes Kepler Universität Linz, Austria},
type = {Technical Report},
year = {1994},
month = {Jul},
number = {CEI PACT D4V-1},
url = {https://www.jku.at/forschung/forschungs-dokumentation/publikation/2129},
keywords = {rendering, global illumination, parallel},
}
@misc{stuerzlinger1994parallelvisibility,
title = {Parallel Visibility Calculations for Parallel Radiosity},
author = {Stürzlinger, Wolfgang and Wild*, Christoph},
booktitle = {Workshop Paragraph},
howpublished = {Poster},
year = {1994},
month = {Mar},
pages = {32-40},
commented-location = {Hagenberg, AT},
abstract = {The radiosity method models the interaction of light between diffuse reflecting surfaces, thereby accurately predicting global illumination effects. Due to the high computational effort to calculate the transfer of light between surfaces and the memory requirements for the scene description, a distributed, parallelized version of the algorithm is needed for scenes consisting of thousands of surfaces. We present a distributed, parallel progressive radiosity algorithm. Then we parallelize the visibility calculations and present a scheme for the communication structure. Finally we analyze the results.},
keywords = {rendering, global illumination, parallel, visibility},
}
@techreport{stuerzlinger1993fxfire,
title = {FXFIRE - Global Illumination with Radiosity},
author = {Stürzlinger, Wolfgang},
institution = {GUP, Johannes Kepler Universität Linz, Austria},
type = {Technical Report},
year = {1993},
month = {Dec},
keywords = {rendering, global illumination},
}
@techreport{stuerzlinger1993flirt,
title = {FLIRT - Faster than Light Ray Tracer},
author = {Stürzlinger, Wolfgang and Tobler*, Robert and Schindler*, Michael},
institution = {Vienna University of Technology, Austria},
type = {Technical Report},
year = {1993},
month = {Aug},
keywords = {rendering, ray tracing},
}
@mastersthesis{stuerzlinger1999habilitation,
title = {Bildgenerierung},
author = {Stürzlinger, Wolfgang},
publisher = {Johannes Kepler Universität Linz, Austria},
year = {1999},
month = {Apr},
abstract = {A fundamental task in computer graphics is the generation of images. Given a geometric model of an object or scene the user wants a visual representation for a given viewpoint. This visualization process is also known as rendering images of a model.
An active research area in rendering is the generation of images with high visual realism. Important visual cues like highlights on surfaces and shadows cast by light sources aid the viewer in understanding an image. Images with high realism are produced with global illumination methods, which approximate the light distribution in an environment to varying degrees.
The major challenge in real-time rendering is to generate images as quickly as possible. Frame rates higher than 20 frames per second are needed to ensure that users perceive smooth motion. Although image generation hardware is widely available, it is hard to visualize very large structures at interactive rates even on high-end platforms. Furthermore, model sizes are growing quicker than graphics hardware capabilities. Several classes of techniques for optimized rendering have been devised to achieve high frame rates.
This text places most publications of the author in the context of these two research areas in computer graphics.},
keywords = {rendering, real-time, ray tracing},
note = {Austrian Habilitation},
}
@phdthesis{stuerzlinger1992dissertation,
title = {Radiosity mit Voronoi-Diagrammen und Diskontinuitäts-Meshes},
author = {Stürzlinger, Wolfgang},
school = {Vienna University of Technology, Austria},
year = {1992},
month = {Dec},
url = {https://catalogplus.tuwien.at/permalink/f/qknpf/UTW_alma2156324830003336},
abstract = {In dieser Arbeit wird ein Verfahren vorgestellt, das es ermöglicht, die genaue Beleuchtung einer Szene zu berechnen, die von flächigen Lichtquellen beleuchtet wird und die durch Polygone beschrieben ist, deren Oberflächen diffus sind. Zuerst wird eine Oberflächenrepräsentation mit Voronoi-Diagrammen vorgestellt, die es erlaubt beim Progressive Refinement Radiosity-Verfahren die Oberflächen adaptiv zu unterteilen, ohne dass die aus der Literatur bekannten Probleme auftreten. Dann wird ein Verfahren zur Berechnung von Schatten- und Halbschatten-Bereichen besprochen. Dieses Verfahren konstruiert eine Oberflächen-Repräsentation, die auf die verschiedenen Diskontinuitäten der Helligkeitsfunktion auf einer Oberfläche Rücksicht nimmt. Durch die neu vorgestellte Kombination der beiden Verfahren kann nun sowohl die Helligkeitsfunktion auf den Oberflächen sehr exakt approximiert werden, als auch die Radiosity von diesen Flächen genau weiterverteilt werden. Dadurch wird das Problem der diffusen globalen Beleuchtung gelöst. Zusätzlich wird eine Methode vorgestellt, die es erlaubt, nur die relevanten Diskontinuitäten zu berechnen, wodurch eine Beschleunigung des Verfahrens erzielt wird.},
keywords = {rendering, global illumination},
note = {Dissertation, in German},
}
@mastersthesis{stuerzlinger1989ccompiler,
title = {C-Compiler für den VIP-Prozessor},
author = {Stürzlinger, Wolfgang},
school = {Vienna University of Technology, Austria},
year = {1989},
month = {Nov},
url = {https://catalogplus.tuwien.at/permalink/f/qknpf/UTW_alma2145146200003336},
abstract = {An der Technischen Universität Wien ist in den Jahren 1985 bis 1988 das VIP-System ("Vienna Integrated Prolog") entstanden. Speziell für die schnelle Interpretation der Prolog-Programme wurde nun dazu der VIP-Prozessor entworfen. Beim Design des Prozessors wurden, um den Durchsatz zu steigern, einige RISC-Technologien verwendet. Vienna Integrated Prolog ist in der Programmiersprache C implementiert. Zur Portierung auf den VIP-Prozessor wurde nun ein Entwicklungssystem benötigt. Im Rahmen dieser Arbeit wurde ein existierender C-Compiler auf den Prozessor angepasst. Als Compiler wurde ein Produkt der Free Software Foundation ausgewählt, das unter dem Namen GNU-C bekannt ist. Dieser optimierende Compiler ist durch das Erstellen einer sogenannten Maschinenbeschreibung auf einen neuen Prozessor portierbar. Der Compiler wird kontinuierlich erweitert und ist kostenlos erhältlich.},
keywords = {compiler, optimization},
note = {Diplomarbeit, in German},
}
Alternatives & Scenarios
Solving difficult or ill-defined problems, such as identifying new insights from big or complex data sets or designing a new artifact, typically involves an exploration of alternatives. Yet, current tools do not support alternatives well in both creative and analytical work. Our work explores new systems to make it easier for analysts and designers to manage different alternatives and scenarios in their work
@comment{c, c={STYLE: Author entry should be in "[von] Last [Jr.], First and ..." format}}
@comment{c, c={STYLE: Author trailing* on last name is grad, trailing+ is undergrad student}}
@comment{c, c={STYLE: no year or series or publisher name in booktitle}}
@comment{c, c={STYLE: series should have format "ACRONYM '##", with 2-digit year}}
@comment{c, c={STYLE: conference articles published in journal have conference name in note= and journal acronym in series=}}
@comment{c, c={STYLE: articleno= and numpages= are both supported}}
@comment{c, c={STYLE: pdf= is link to PDF, video= is link to video, teaser= is link to teaser image}}
@comment{c, c={STYLE: doi= is link to doi (or publisher page), url= is link to webpage}}
@comment{c, c={STYLE: note= shows up in the list, footnote= shows up in the individual pages}}
@comment{c, c={STYLE: footnote= is the right place for pdf2, url2, video2, other supplementary materials, etc.}}
@comment{c, c={STYLE: to comment out a field, just prefix it with "commented-", e.g., "commented-year"}}
@comment{c, c={canonical field order: 'title', 'author', 'journal', 'booktitle', 'publisher', 'series', 'issn', 'isbn', 'institution', 'school', 'type', 'howpublished', 'year', 'month', 'volume', 'number', 'pages', 'articleno', 'numpages', 'doi', 'url', 'pdf', 'video', 'teaser', 'abstract', 'keywords', 'award', 'note', 'footnote'}}
@comment{***************************books&special_issues*******************************}
@comment{zachman2025special,
title = {Special Section on the Best Papers of the 20th EuroXR International Conference (EuroXR 2023)},
author = {Walczak, Krzysztof and Zachmann, Gabriel and Niamut, Omar A. and Johnsen, Kyle and Stuerzlinger, Wolfgang and Bourdot, Patrick and Welch, Greg and Alcaniz Raya, Mariano},
journal = {Computers & Graphics},
publisher = {Elsevier},
series = {C&G},
year = {2025},
month = {Nov},
commented-volume = {48},
commented-number = {C},
pages = {1-2},
commented-doi = {https://doi.org/10.1016/j.cag.2025.00.000},
abstract = {We are delighted to introduce this special section of Computers & Graphics, which presents extended versions of the best papers selected from the 20th EuroXR International Conference (EuroXR 2023). The conference was held in Rotterdam, The Netherlands, from November 29 to December 1, 2023, co-located with the Immersive Tech Week. It continues a rich tradition of EuroXR events focused on advances in Virtual, Augmented, and Mixed Reality (VR, AR, MR), collectively referred to as Extended Reality (XR). Since its inception in 2004 under the INTUITION Network of Excellence and subsequent evolution into the EuroXR International Conference, the event has consistently served as a platform to present cutting-edge research, foster collaborations among academia, industry, and public institutions, and promote the adoption of XR technologies across various domains.
The scientific track of EuroXR 2023 maintained a rigorous review process to ensure high quality and impact. A total of 42 papers were submitted to the scientific program, out of which 14 were accepted (an acceptance rate of 33%) across different categories: long, medium, and short papers. Each submission underwent a thorough double-blind peer review process by at least three independent experts, followed by a rebuttal phase and final discussions among the reviewers. The scientific program chairs then made final decisions based on comprehensive meta-reviews. A dedicated Best Papers Awards Committee subsequently evaluated the accepted papers, identifying outstanding contributions, which were then invited for significant extension and re-review for publication in this special section of Computers & Graphics.
The two articles presented here exemplify the diversity and high quality of research at EuroXR 2023:
Enhancing anatomy learning through collaborative VR? An advanced investigation by Haya Almaree, Roland Fischer, René Weller, Verena Uslar, Dirk Weyhe, and Gabriel Zachmann explores the potential benefits of collaborative VR learning environments in medical education. The authors developed a multi-user VR Anatomy Atlas and conducted two comprehensive user studies comparing individual and collaborative learning modes. Their findings offer valuable insights into the effectiveness, usability, and motivational aspects of collaborative VR learning, suggesting that although collaboration does not necessarily enhance learning outcomes or motivation in anatomy education, it opens important questions regarding cognitive load and system usability that require further research.
Psychophysiology of rhythmic stimuli and time experience in virtual reality by Stéven Picard and Jean Botev investigates how rhythmic auditory and visual stimuli influence users' perception of time and task performance within VR environments. The authors systematically analyze the interplay between sensory stimuli, physiological responses (such as eye-tracking data and body temperature), and subjective time estimation. Their results reveal nuanced relationships between stimulus modality, tempo, fatigue, and time perception, offering promising directions for designing VR environments that strategically modulate user experience through rhythm and sensory cues.
Collectively, these papers highlight valuable advancements at the intersection of XR technology, human factors, education, and psychophysiology. They demonstrate how XR can be leveraged not only to improve learning and interaction but also to deepen our understanding of human cognitive and sensory experiences in immersive contexts.
We express our sincere gratitude to all the authors for their outstanding contributions and to the reviewers for their thorough work in maintaining the high standards of Computers & Graphics. We also extend special thanks to the EuroXR 2023 Organizing Committee and the Immersive Tech Week team for hosting a vibrant conference that successfully bridged research, practice, and innovation in Extended Reality.
For further information about EuroXR and future conferences, please visit the official EuroXR Association website at https://www.euroxr-association.org.
We hope that readers will find these contributions as inspiring and thought-provoking as we did.},
keywords = {3D user interfaces, virtual reality, augmented reality},
note = {To appear},
}
@proceedings{zachman2023euroxr,
title = {Virtual Reality and Mixed Reality, 20th EuroXR International Conference},
author = {Zachmann, Gabriel and Walczak, Krzysztof and Niamut, Omar A. and Johnsen, Kyle and Stuerzlinger, Wolfgang and Alcaniz Raya, Mariano and Bourdot, Patrick and Welch, Greg},
publisher = {Springer},
series = {EuroXR '23},
volume = {LNCS 14410},
year = {2023},
month = {Nov},
doi = {https://doi.org/10.1007/978-3-031-48495-7},
teaser = {teasers/EuroXR23.png},
abstract = {We are pleased to present in this LNCS volume the scientific proceedings of the 20th EuroXR International Conference (EuroXR 2023), organized in colocation with the Immersive Tech Week, Rotterdam, the Netherlands, and held during November 29 – December 1, 2023.
This conference follows a series of successful international conferences initiated in 2004 by the INTUITION Network of Excellence on Virtual and Augmented Reality, which was supported by the European Commission until 2008. From 2009 through 2013, it was embedded in the Joint Virtual Reality Conferences (JVRC). Since then, it was known as EuroVR, then EuroXR International Conference, in line with the renaming of the umbrella association.
The focus and aim of the EuroXR conferences is to present, each year, novel results and insights in Virtual Reality (VR), Augmented Reality (AR), and Mixed Reality (MR), commonly referred to under the umbrella of Extended Reality (XR), including software systems, immersive rendering technologies, 3D user interfaces, and applications. EuroXR also aims to foster engagement between European industries, academia, and the public sector, to promote the development and deployment of XR techniques in new and emerging, but also in existing fields. To this end, all EuroXR conferences include not only a scientific track, but also an application-oriented track, with its own proceedings.
Since 2017, the EuroXR Association has collaborated with Springer to publish the proceedings of the scientific track of its annual conference. In order to maintain the scientific standards to be expected from such a conference, we established a number of committees overseeing the process of creating a scientific program: the scientific program chairs, leading an International Program Committee (IPC) made up of international experts in the field, and the EuroXR academic task force.
For the 2023 issue, a total of 42 papers were submitted, out of which 14 papers were accepted (4 long, 8 medium, and 2 short papers). This amounts to an acceptance ratio of 33%. The selection process involved a double-blind peer-review process (each and every paper was reviewed by at least 3 members of the IPC, in many cases even 4), followed by a rebuttal phase, and a final discussion and scoring phase amongst the revewiers. Based on the review reports, the scores, and the reviewers’ discussions, the scientific program chairs took the final decision and wrote a meta-review for each paper.
This year, the scientific program of EuroXR and, hence, this LNCS volume, is organized into three sections: Interaction in Virtual Reality, Designing XR Experiences, and Human Factors in VR: Performance, Acceptance, and Design.
In addition to the regular scientific papers track, EuroXR invited three keynote speakers: Tabitha C. Peck (Davidson College, Davidson, NC, USA), Ferran Argelaguet (Research Scientist, Hybrid team, IRISA/Inria, Rennes, France), and Zerrin Yumak (Assistant Professor of Utrecht University, The Netherlands). Furthermore, the conference hosted an application track, demos and posters sessions, and lab tours. Finally, there were dedicated sessions, for instance, by Greg Welch on VERA, and a workshop on “Vocational Training”.
We would like to thank all the IPC members and external reviewers for their insightful reviews, which helped ensure the high quality of papers selected for the scientific track. Furthermore, we would like to thank the application chairs, demos and posters chairs, and the local organizers of EuroXR 2023.
We are also grateful to the staff of Springer for their support and advice during the preparation of this LNCS volume.},
keywords = {virtual reality, augmented reality, extended reality},
}
@proceedings{teather2020vrstproceedings,
title = {26th Symposium on Virtual Reality Software and Technology 2020},
author = {Teather, Robert J. and Joslin, Chris and Stuerzlinger, Wolfgang and Figueroa, Pablo and Hu, Yaoping and Batmaz, Anil Ufuk and Lee, Wonsook and Ortega, Francisco},
publisher = {ACM},
series = {VRST '20},
year = {2020},
month = {Nov},
doi = {https://doi.org/10.1145/3385956},
teaser = {teasers/VRST2020.png},
abstract = {Welcome to the 26th ACM Symposium on Virtual Reality Software and Technology (VRST 2020) for exchanging knowledge and experience. It is our pleasure to virtually host VRST 2020 from Ottawa, Canada, for the safety of attendees, due to the on-going COVID-19 pandemic.
As a premier international forum for advanced in virtual reality technology, VRST 2020 received 132 paper submissions from all continents. Its program committee (PC) consisted of 27 esteemed researchers to coordinate additional 176 expert reviewers. Each submission underwent at least three reviews for its novelty, technical quality, and impact to the field. The final program of VRST 2020 was thus composed of 28 full papers and 7 short papers, yielding an overall acceptance rate of 26%. The topics of these papers ranged from simulation & graphics, 3D reconstruction & computer vision, haptics, navigation & locomotion, collaborations, avatars, and display & visual perception, to applications. In addition, a total of 59 posters and demos were submitted, and 43 of these were accepted to the technical program.
Moreover, the program was honoured by two distinguished keynote speakers: Doug Bowman from Virginia Tech University (USA) and Mary Whitton of the University of North Carolina at Chapel Hill (USA). As two of the foremost names in the field of virtual reality, they presented stimulating insights to energize the program and provide invaluable insights to new and seasoned researchers alike.
Special thanks are extended to the PC members and expert reviewers for all their dedicated efforts and thoughtful reviews. Their hard work uniquely empowered the program to be interesting.
We hope that attendees will find VRST 2020 inspiring, as it spotlights the latest research in the growing field of Virtual Reality. The event aims to foster collaboration and instigate further growth in this exciting field.},
keywords = {3D user interfaces, virtual reality},
}
@book{marriott2018immersiveanalytics,
title = {Immersive Analytics},
author = {Marriott, Kim and Schreiber, Falk and Dwyer, Tim and Klein, Karsten and Henry Riche, Nathalie and Itoh, Takayuki and Stuerzlinger, Wolfgang and Thomas, Bruce H.},
publisher = {Springer},
year = {2018},
month = {Oct},
volume = {LNCS 11190},
numpages = {371},
doi = {https://doi.org/10.1007/978-3-030-01388-2},
teaser = {teasers/iabook.png},
abstract = {We live in an age where the amount and complexity of data available to us far surpass our ability to understand or to utilise them in decision-making. Analysis of such data is not only common in the physical, social, and life sciences, but is becoming an integral part of effective planning in business, government, e-health, and many other aspects of modern society. Furthermore data analytics is no longer solely the preserve of scientists and professional analysts as personalised data analytics becomes increasingly common.
Visual analytics has become a key technology for human-in-the-loop data analysis. While the standard definition for visual analytics is agnostic of the actual interface devices employed by visual analytics systems, the affordances of the display and input devices used for analysing data strongly affect the experience of the users of such systems and, thereby, their degree of engagement and productivity. For practical visual analytics tools, the platform for interaction is almost always a standard desktop computer. A systematic approach to developing analysis and decision support tools that move beyond the desktop is lacking.
Immersive analytics is a new interdisciplinary field that brings together researchers and practitioners from data visualisation, visual analytics, virtual and mixed reality, human–computer interaction, and human-in-the-loop algorithmics to explore these new forms of analytics tools. The goal is to remove barriers between people, their data, and the tools they use for analysis by developing more engaging, embodied analysis tools that support data understanding and decision-making everywhere and by everyone, either working individually or collaboratively.
This book is the outcome of two coordinated workshops on immersive analytics held in 2016. The first in Shonan, Japan, took place in February and organised by Takayuki Itoh, Kim Marriott, Falk Schreiber, and Uwe Wössner with the help of Karsten Klein, the second was held in June at Dagstuhl, Germany, and was organised by Tim Dwyer, Nathalie Henry Riche, Wolfgang Stuerzlinger, and Bruce H. Thomas, again with the help of Karsten Klein. In all, 25 leading international experts in data visualisation, visual analytics, human–computer interaction, virtual reality and augmented reality attended the first workshop, with another 38 experts attending the second. There was a sizeable overlap of experts between the two workshops that provided a sensible continuity of concepts.
The two workshops explored the definition of immersive analytics and identified the structure and focus of this book. A working group for each chapter was formed at the workshops, with the participation of invited experts as needed, and the groups wrote the chapters contained in this book. A critical goal was to develop a vision of the research domain for immersive analytics and a roadmap for future investigations. Authors submitted manuscripts for their chapters in mid-2017. These initial versions were first reviewed "internally" by one of the book editors. After an initial round of revision based on these internal reviews, the updated manuscripts were sent to expert reviewers invited from the community. We are grateful to these people for their detailed and insightful reviews.},
keywords = {immersive analytics, visual analytics, visualization},
}
@proceedings{arif2018socio,
title = {Socio-Technical Aspects of Text Entry: {MobileHCI} 2018 Workshop},
author = {Arif, Ahmed Sabbir and Stuerzlinger, Wolfgang and Dunlop, Mark D. and Yi, Xin and Seim, Caitlyn},
series = {TEXT '18},
year = {2018},
month = {Sep},
url = {http://ceur-ws.org/Vol-2183},
teaser = {teasers/TEXT2018.png},
abstract = {Mobile text entry has become an integral part of our daily life. We regularly input text on smartphones, laptops, desktops and increasingly on smartwatches, VR systems, interactive tabletops/walls, and kiosks. This text entry is done in all social settings, from solo individuals writing private notes, through social networking in bars with friends, to jointly writing on collaborative devices in public spaces. Traditional tap-based input is increasingly being replaced with or supplemented by voice input or multimodal control. With the ubiquity of text entry, it is becoming increasingly important to consider socio-technical systems perspectives in the design, development, and evaluation of new techniques. The purpose of this one-day workshop is to share and encourage research exploring various socio-technical aspects of text entry, including social and cultural impacts, developing socially and culturally acceptable techniques, and techniques to support all users of varying ages, social and technical backgrounds, language, and physical abilities.},
keywords = {text entry},
}
@proceedings{banic2015suiproceedings,
title = {3rd Symposium on Spatial User Interaction 2015},
author = {Banic, Amy and Suma, Evan and Steinicke, Frank and Stuerzlinger, Wolfgang},
publisher = {ACM},
series = {SUI '15},
year = {2015},
month = {Aug},
doi = {https://doi.org/10.1145/2788940},
teaser = {teasers/SUI2015.png},
abstract = {It is our great pleasure to welcome you to the third ACM Symposium on Spatial User Interaction. This event focuses on the user interface challenges that appear when users interact in the space where the flat, two-dimensional, digital world meets the volumetric, physical, three-dimensional (3D) space we live in. The symposium considers both spatial input as well as output, with an emphasis on the issues around the interaction between humans and systems. Due to the advances in 3D technologies, spatial interaction is now more relevant than ever. Powerful graphics engines and high-resolution screens are now ubiquitous in everyday devices, such as tablets and mobile phones. Moreover, new forms of input, such as multi-touch, finger and body tracking technologies are now easily available, and more and more commercial 3D systems with spatial interaction capabilities exist, many priced at the consumer level. However, the challenges, limitations, and advantages of leveraging this third dimension in human-computer interfaces are still not yet fully understood. These questions will only become more relevant as these emerging technologies continue to cross the barrier towards wide adoption.
The call for papers attracted 48 submissions from Asia, Europe, Australia, and North and South America in all areas of Spatial User Interaction research. The international program committee consisting of 19 experts in the topic areas and the three program chairs handled the review process. Eight submissions were reviewed by the program chairs and rejected without further review due to being incomplete, insufficient quality, or inappropriate for the symposium topic. All other submissions received at least four detailed reviews, two from members of the international program committee and two or more from external reviewers. The reviewing process was double-blind, with the authors' identities visible only to the program chairs and the primary program committee member assigned to the paper. In the end, the program committee accepted 17 papers (10 long, 7 short), corresponding to an overall acceptance rate of 35%. Additionally, 11 posters complement the program and appear in the proceedings. Furthermore, three research demonstrations were accepted and will be presented at the symposium. We also encourage attendees to attend the keynote talk, TRANSFORM: Beyond Tangible Bits, Towards Radical Atoms, presented by Hiroshi Ishii from the MIT Media Lab.},
keywords = {3D user interfaces, virtual reality},
}
@article{steinicke2015spatial,
title = {Spatial Interfaces},
author = {Steinicke, Frank and Stuerzlinger, Wolfgang},
journal = {Computer Graphics and Applications},
publisher = {IEEE},
series = {CG&A},
year = {2015},
month = {Jul},
volume = {35},
number = {4},
pages = {6-7},
doi = {https://doi.org/10.1109/MCG.2015.92},
abstract = {CG&A welcomes Frank Steinicke (University of Hamburg) and Wolfgang Stuerzlinger (Simon Fraser University) as new members to its editorial board and as the new coeditors of the Spatial Interfaces department.},
keywords = {3D user interfaces, virtual reality},
}
@article{steinicke2015special,
title = {Special Section on Spatial User Interaction},
author = {Steinicke, Frank and Stuerzlinger, Wolfgang and Suma, Evan},
journal = {Computers & Graphics},
publisher = {Elsevier},
series = {C&G},
year = {2015},
month = {May},
volume = {48},
number = {C},
pages = {A1-A2},
doi = {https://doi.org/10.1016/j.cag.2015.03.002},
abstract = {It is our great pleasure to present you with the Computers & Graphics special section on Spatial User Interaction (SUI). The special section contains extended versions of the best scientific papers from the 2nd ACM Symposium on Spatial User Interaction (SUI׳14), which was held Oct. 4–5, 2014 in Honolulu, USA. The SUI symposium focuses on the user interface challenges that appear when users interact in the space where the flat, two-dimensional, digital world meets the volumetric, physical, three-dimensional (3D) space we live in. This considers both spatial input as well as output, with an emphasis on the issues around the interaction between humans and systems. The goal of the symposium is to provide an intensive exchange between academic and industrial researchers working in the area of SUI and to foster discussions among participants.
The symposium call for papers attracted 62 submissions from Asia, Europe, Australia, and North and South America in all areas of Spatial User Interaction research. The international program committee consisting of 19 experts in the topic areas and the two program chairs handled the highly competitive and selective review process. In the end, the program committee accepted overall 18 (11 long papers plus 7 short papers) out of 62 submissions, which corresponds to an acceptance rate of 29% in total.
The SUI׳14 award chairs, Bruce Thomas from the University of South Australia and Patrick Baudisch from the Hasso-Plattner-Institut in Germany, selected the best full and best short papers from these 18 submissions, which received the invitation to be published as extended articles in this special section:
The article "Coordinated 3D Interaction in Tablet- and HMD-Based Hybrid Virtual Environments" written by Jia Wang, Robert Lindeman proposes a novel spatial interactive solution using a coordinated, tablet- and HMD-based, hybrid virtual environment system.
The article "Principles, Interactions and Devices for Real-World Immersive Modeling" co-authored by Mark Mine, Arun Yoganandan, and Dane Coffey presents an approach that combines the natural and intuitive power of virtual reality interaction, the precision and control of 2D touch surfaces, and the richness of a commercial modeling package.
The article "VideoHandles: Searching through Action Camera Videos by Replicating Hand Gestures" by Jarrod Knibbe, Sue Ann Seah, and Mike Fraser introduces a detailed exploration of VideoHandles, a novel interaction technique to support rapid review of wearable video camera data by re-performing gestures as a search query.},
keywords = {3D user interfaces, virtual reality},
}
@proceedings{steinicke2014suiproceedings,
title = {2nd Symposium on Spatial User Interaction 2014},
author = {Steinicke, Frank and Stuerzlinger, Wolfgang and Suma, Evan},
publisher = {ACM},
series = {SUI '14},
year = {2014},
month = {Oct},
doi = {https://doi.org/10.1145/2659766},
teaser = {teasers/SUI2014.png},
abstract = {It is our great pleasure to welcome you to the second ACM Symposium on Spatial User Interaction - SUI'14. This event focuses on the user interface challenges that appear when users interact in the space where the flat, two-dimensional, digital world meets the volumetric, physical, threedimensional (3D) space we live in. This considers both spatial input as well as output, with an emphasis on the issues around the interaction between humans and systems. The goal of the symposium is to provide an intensive exchange between academic and industrial researchers working in the area of SUI and to foster discussions among participants. The SUI symposium was held October 4-5, 2014, in Honolulu, USA.
The call for papers attracted 62 submissions from Asia, Europe, Australia, and North and South America in all areas of Spatial User Interaction research. The international program committee consisting of 19 experts in the topic areas and the three program chairs handled the highly competitive and selective review process. Every submission received at least four detailed reviews, two from members of the international program committee and two or more from external reviewers. The reviewing process was double-blind, where only the program chairs as well as the program committee member, who was assigned to each paper to identify external reviewers, knew the identity of the authors. In the end, the program committee accepted overall 18 (11 long papers plus 7 short papers) out of 62 submissions, which corresponds to an acceptance rate of 29% in total. Additionally, 25 posters complement the program and appear in the proceedings. Furthermore, several demos were presented at the symposium. The topics range from spatial interaction techniques, gestures, vision in 3D space, spatial applications, to interaction with multi-touch technologies and spatial interaction in augmented reality. We hope that these proceedings will serve as a valuable reference for Spatial User Interaction researchers and developers.},
keywords = {3D user interfaces, virtual reality},
}
@proceedings{daiber2013isis3dproceedings,
title = {Interactive Surfaces for Interaction with Stereoscopic {3D}: Tutorial and Workshop at {ITS} 2013},
author = {Daiber, Florian and de Araujo, Bruno Rodrigues and Steinicke, Frank and Stuerzlinger, Wolfgang},
booktitle = {Conference on Interactive Tabletops and Surfaces},
publisher = {ACM},
series = {ISIS3D '13},
year = {2013},
month = {Oct},
pages = {483–486},
doi = {https://doi.org/10.1145/2512349.2512351},
abstract = {With the increasing distribution of multi-touch capable devices multi-touch interaction becomes more and more ubiquitous. Multi-touch interaction offers new ways to deal with 3D data allowing a high degree of freedom (DOF) without instrumenting the user. Due to the advances in 3D technologies, designing for 3D interaction is now more relevant than ever. With more powerful engines and high resolution screens also mobile devices can run advanced 3D graphics, 3D UIs are emerging beyond the game industry, and recently, first prototypes as well as commercial systems bringing (auto-) stereoscopic display on touch-sensitive surfaces have been proposed. With the Tutorial and Workshop on ``Interactive Surfaces for Interaction with Stereoscopic 3D (ISIS3D)'' we aim to provide an interactive forum that focuses on the challenges that appear when the flat digital world of surface computing meets the curved, physical, 3D space we live in.},
keywords = {3D user interfaces, virtual reality},
}
@proceedings{stuerzlinger2013suiproceedings,
title = {1st Symposium on Spatial User Interaction 2013},
author = {Stuerzlinger, Wolfgang and Steinicke, Frank},
publisher = {ACM},
series = {SUI '13},
year = {2013},
month = {Jul},
doi = {https://doi.org/10.1145/2491367},
teaser = {teasers/SUI2013.png},
abstract = {It is our great pleasure to welcome you to the first ACM Symposium on Spatial User Interaction - SUI'13. This new event focuses on the user interface challenges that appear when users interact in the space where the flat, twodimensional, digital world meets the volumetric, physical, three-dimensional (3D) space we live in. This considers both spatial input as well as output, with an emphasis on the issues around the interaction between humans and systems. The goal of the symposium is to provide an intensive exchange between academic and industrial researchers working in the area of SUI and to foster discussions among participants. The first SUI symposium was held July 20-21, 2013 in Los Angeles, USA.
The call for papers attracted 31 submissions from Asia, Europe, Australia, and North and South America in all areas of Spatial User Interaction research. The international program committee consisting of 15 experts in the topic areas and the two program chairs handled the highly competitive and selective review process. Every submission received at least four detailed reviews, two from members of the international program committee and two or more from external reviewers. The reviewing process was double-blind, where only the program chairs as well as the program committee member, who was assigned to each paper to identify external reviewers, knew the identity of the authors.
In the end, the program committee accepted overall 12 (8 full papers plus 4 short papers) out of 31 submissions, which corresponds to an acceptance rate of 26% for full papers (and 38% in total). Additionally 12 posters and demonstrations will complement the program and appear in the proceedings. The topics range from spatial interaction techniques, vision in 3D space, applications, to interaction with multi-touch technologies and in augmented reality. We hope that these proceedings will serve as a valuable reference for Spatial User Interaction researchers and developers.
Putting together the content for SUI'13 was a team effort. We first thank the authors for providing the content of the program. Special thanks go to the members of the international program committee, who successfully dealt with the reviewing load. We also thank the external reviewers.},
keywords = {3D user interfaces, virtual reality},
}
@proceedings{stuerzlinger2012vrstproceedings,
title = {Symposium on Virtual Reality Software and Technology 2012},
author = {Stuerzlinger, Wolfgang and Latoschik, Marc Erich and Kapralos, Bill},
publisher = {ACM},
series = {VRST '12},
year = {2012},
month = {Dec},
doi = {https://doi.org/10.1145/2407336},
teaser = {teasers/VRST2012.png},
abstract = {It is our great pleasure to welcome you to the 2012 ACM Symposium on Virtual Reality Software and Technology - VRST'12. VRST has become one of the major scientific events in the area of virtual reality since its debut in 1994 in Singapore. The symposium continues its tradition as an international forum for the presentation of research results and experience reports on leading edge issues of software, hardware and systems for Virtual Reality. The mission of the symposium is to share novel technologies that fulfill the needs of Virtual Reality applications and environments and to identify new directions for future research and development. VRST gives researchers and practitioners a unique opportunity to share their perspectives with others interested in the various aspects of Virtual Reality and owes its existence to a vibrant and productive research community. This year, VRST was held December 10-12, 2012 in Toronto, Ontario, Canada.
The call for papers attracted 88 submissions from Asia, Europe, Australia, and North and South America in all areas of Virtual Reality research. Particular attention was given to work on system with a special track focusing on architectures, frameworks, reusability, adaptivity, and performance testing and evaluation. An international program committee consisting of 16 experts in the topic areas and the three program chairs handled the highly competitive and selective review process. Almost every submission received four or more reviews, two from members of the international program committee and two from external reviewers. Reviewing was double-blind, where only the program chairs and the program committee member assigned to identify external reviewers knew the identity of the authors.
In the end, the program committee was able to accept 25 out of 88 submissions, which corresponds to an acceptance rate of 28%. For posters, 15 out of 32 submissions will appear in the proceedings. The topics range from tracking, augmented and mixed reality, interaction, navigation and locomotion, collaboration, haptics, simulation, agents and behaviors to two sessions for a systems track. We hope that these proceedings will serve as a valuable reference for Virtual Reality researchers and developers.},
keywords = {virtual reality, 3D user interfaces},
}
@article{bowman2009special,
title = {Special Issue on Current Trends in {3D} User Interface Research},
author = {Bowman, Doug and Fröhlich, Bernd and Kitamura, Yoshifumi and Stuerzlinger, Wolfgang},
journal = {Int. Journal of Human-Computer Studies},
publisher = {Elsevier},
series = {IJHCS},
year = {2009},
month = {Mar},
volume = {67},
number = {3},
pages = {223-224},
doi = {https://doi.org/10.1016/j.ijhcs.2008.10.003},
abstract = {Hardware, software, and in particular users now seem ready to engage with computer-generated 3D worlds and the appropriate 3D user interfaces (3D UIs) for interacting with such worlds. 3D UIs have traditionally only been used in very specific application domains such as virtual reality (VR) and augmented reality (AR) environments, digital content creation (DCC) systems, computer-aided design (CAD) systems, visualization systems, and computer games. Now they are beginning to appear in operating systems, on personal digital assistants (PDAs) and mobile phones, and in console gaming systems (e.g., Nintendo's Wii). Even 3D cinema has been given a second chance, and stereoscopic versions of movies are produced on a regular basis. Consequently, new television systems are being equipped with 3D functionality. These examples show that the demand for and the use of 3D UIs is significantly increasing.
The IEEE Symposium on 3D User Interfaces (3DUI) was established in 2006 following two successful workshops—the 2004 workshop "Beyond Wand and Glove Based Interaction" and the 2005 workshop "New Directions in 3D User Interfaces." Today, the 3DUI symposium is the premier conference for all types of 3D user interface research for desktop and off-the-desktop environments, including novel input device designs, interaction techniques, evaluation methods, and user studies.
In this special issue of IJHCS, we are pleased to present extended versions of three outstanding papers that were originally presented at the 3DUI 2007 and 3DUI 2008. An additional paper resulting from an open call was also accepted to this special issue.
The first paper, by Hachet et al. (2009), describes a set of widgets that provide a comprehensive solution for point of interest (POI) navigation in 3D environments. It allows users to quickly navigate to a particular view, explore a 3D scene, or investigate a single object in detail, and it can be used on a variety of display devices. These basic concepts are also extended to other uses beyond navigation alone.
The work by Vanacken et al. (2009) presents two new 3D selection techniques, 3D Bubble Cursor and Depth Ray. Both are targeted at selection in dense and occluded 3D virtual environments. The user studies vary both environment density and target visibility to evaluate the new techniques against a standard 3D point cursor. The effect of auditory and haptic feedback on the selection process is also investigated in a study. The results show that the new techniques enable efficient selection of hidden objects.
The paper by Pusch et al. (2009) presents a new method for providing a pseudo-haptic sensation in an augmented reality setting. The central idea is to displace the virtual representation of the hand from the actual position of the real hand depending on the strength of a virtual flow field. When a user places the hand in a virtual flow field and tries to maintain the hand's position at a cued location, a flow pressure-like sensation is perceived. Experimental results show that different force field strength levels can be discriminated.
Finally, Sharlin et al. (2009) present a novel system and a set of measures for assessing cognitive mapping abilities in the context of a wayfinding task. The hardware setup consists of a projection display for the presentation of virtual environments and a tangible tabletop interface for building a physical model of a seen environment. The cognitive mapping abilities of the users are assessed by recording and analyzing the building progress of the physical model. Since this setup has proven to be sensitive to factors affecting cognitive mapping it allows the computer-supported assessment of this important human ability.
All of these papers contain high-quality contributions to the growing field of 3D user interfaces. We thank the authors for their stimulating work and the reviewers for their constructive and detailed comments.},
keywords = {3D user interfaces, virtual reality},
}
@comment{c, c={leave the "_stuerzlinger" in the ID to enable umlaut-free search!}}
@proceedings{coquillart_stuerzlinger20083duiproceedings,
title = {Symposium on {3D} User Interfaces 2008},
author = {Coquillart, Sabine and Stürzlinger, Wolfgang and Kiyokawa, Kiyoshi},
publisher = {IEEE},
series = {3DUI '08},
year = {2008},
month = {Mar},
doi = {https://doi.org/10.1109/3DUI.2008.4476581},
teaser = {teasers/3DUI2008.png},
abstract = {Welcome to the IEEE Symposium on 3D User Interfaces 2008 (3DUI 2008), organized in Reno, Nevada on March 8-9, 2008. The symposium is co-located with IEEE Virtual Reality 2008 and with the symposium on Haptic Interfaces. 3DUI 2008 is the third international symposium focused on the topic of 3D UIs. It builds on successful 3DUI workshops in 2004 and 2005, as well as the IEEE 3DUI Symposiums in 2006 and 2007. Although a recent area of research, 3DUI is already a very well established topic and rapidely expanding. The submissions covered a variety of approaches ranging from handheld devices, desktop solutions, gesture, sound, haptics, augmented/mixed reality, to immersive systems.
This year, the program co-chairs received 67 submissions (45 papers and 22 technotes) in all areas of three-dimensional user interfaces. Each paper or technote was reviewed by at least two reviewers from the international program committee and two external reviewers. The review summary written by the primary reviewer provided the basis for a discussion among the reviewers when necessary. Reviewing was double-blind, i.e. the identity of the authors was known only to the program chairs and the program committee members responsible for choosing external reviewers for the submission. The acceptance rate was very selective at 28 % (31 % for papers and 23 % for technotes), and only 19 submissions were accepted (14 papers and 5 technotes). In addition, this year the proceedings also include 2 pages presentations for each of the 18 posters presented during the symposium.
We wish to thank all the persons who made 3DUI 2008 possible. Special thanks go to the program committee members and the reviewers for their insightful and thorough reviews of the submitted papers in a very short review period. We want to thank the posters chairs Raimund Dachselt, Robert Lindeman and Kouichi Matsuda who did handled the hard job of managing the posters. We also acknowledge the support by IEEE, the IEEE Visualization and Graphics Technical Committee as well as the VR steering committee. Most of the organization of IEEE 3DUI as well as local arrangement is shared with IEEE VR. We are grateful to Bill Sherman and the IEEE VR organizing committee for taking care of the organization of IEEE 3DUI 2008. Many thanks to James Stewart of Precision Conference Systems for his support of the reviewing process. Thanks also to Torsten Möllen and especially Meghan Haley for managing the printing process. Finally, we thank all the authors for their excellent submissions, without which this symposium could not exist.
We hope that this symposium will continue to connect researchers of all backgrounds in 3D user interface research and be enjoyable, interesting and stimulating for the participants. Please enjoy the 2008 3DUI Symposium !},
keywords = {3D user interfaces, virtual reality},
}
@proceedings{stuerzlinger20073duiproceedings,
title = {Symposium on {3D} User Interfaces 2007},
author = {Stürzlinger, Wolfgang and Kitamura, Yoshifumi and Coquillart, Sabine},
publisher = {IEEE},
series = {3DUI '07},
year = {2007},
month = {Mar},
doi = {https://doi.org/10.1109/3DUI.2007.340764},
teaser = {teasers/3DUI2007.png},
abstract = {Welcome to the IEEE Symposium on 3D User Interfaces 2007 (3DUI 2007), which took place in Charlotte, North Carolina on March 10-11, 2007. The symposium was held just before IEEE Virtual Reality 2007. The event owes its existence to a vibrant and productive research community in 3D user interfaces. This area has emerged from many different disciplines, including virtual reality, mixed and augmented reality, human-computer interaction, computer graphics, cognitive and perceptual psychology, and 3D games. 3DUI 2007 is sponsored by the IEEE Visualization and Graphics Technical Committee and is the second symposium in this series and follows two successful IEEE VR workshops on this topic in 2004 and 2005 as well as 3DUI 2006.
The program co-chairs received 81 submissions in all areas of three-dimensional user interfaces. The review process was highly competitive and selective. This year, we changed the review process and involved an international program committee consisting of 18 experts in 3D user interfaces. Each submission received at least 4 reviews, two of which were from members of the international program committee and two from external reviewers. Reviewing was double-blind this year, and the identity of the authors was known only to the program chairs and the program committee member responsible for choosing external reviewers for the submission. The program committee members were often able to solicit reviews from some of the top experts in a particular area of research. In the end, we were able to accept 18 full papers and 7 technotes (short papers), which corresponds to an acceptance rate of 31%. The accepted papers cover a wide range of topics in 3D user interfaces, including navigation, 3D movement, 3D selection, devices, gestures, mixed & augmented reality, force-feedback interfaces, and entertainment. We would like to thank all people who made 3DUI 2007 possible. Special thanks go to the program committee members who donated their time to ensure a fair selection process. Additional thanks go to the external reviewers who participated in the review process. We also acknowledge the support by IEEE, the IEEE Visualization and Graphics Technical Committee as well as the VR steering committee for support. Finally, we would like to thank Raimund Dachselt for handling the posters. Particular thanks go to IEEE VR's general chairs, especially Doug Bowman, for their great help with the organization of this event as well as the IEEE VR local arrangement chairs and other people involved in the local organization. Many thanks to James Stewart of Precision Conference Systems for his support of the reviewing process. Thanks also to Torsten Möller and especially Meghan Haley for creating the proceedings. Finally, we thank all the authors and researchers who submitted their work to the symposium.
We believe that 3DUI 2007 connects researchers of all backgrounds in 3D user interface research and collects and disseminates the best results in this area. Enjoy the symposium!},
keywords = {3D user interfaces, virtual reality},
}
@comment{c, c={leave the "_stuerzlinger" in the ID to enable umlaut-free search!}}
@proceedings{kitamura_stuerzlinger20063duiproceedings,
title = {Symposium on {3D} User Interfaces 2006},
author = {Kitamura, Yoshifumi and Bowman, Doug and Fröhlich, Bernd and Stürzlinger, Wolfgang},
publisher = {IEEE},
series = {3DUI '06},
year = {2006},
month = {Mar},
url = {https://ieeexplore.ieee.org/servlet/opac?punumber=10952},
teaser = {teasers/3DUI2006.png},
abstract = {We are extremely pleased and honored to present the proceedings of the First IEEE Symposium on 3D User Interfaces.
3DUI 2006 owes its existence to a vibrant and productive research community. Emerging from many different disciplines, such as virtual reality, mixed reality, computer graphics, human-computer interaction, and cognitive and perceptual psychology, 3D interaction has now become a coherent research area itself. Extremely successful workshops on this topic at IEEE Virtual Reality in 2004 and 2005 convinced us and the IEEE Visualization and Graphics Technical Committee that the time was right to give the 3D user interface community its own specialized venue. Our vision for the symposium is to connect researchers of all backgrounds working on 3D user interface issues, and to collect and disseminate the best 3D interaction research in the world.
Although this is the very first 3DUI symposium, the review of papers was highly competitive and selective. The program includes 18 full papers and 8 technotes (short papers), selected from 81 submissions (a 32% acceptance rate overall). The accepted papers cover a wide range of topics in 3D user interface, including navigation, applications and implementation, collaborative and bimanual interfaces, 3D interaction techniques, augmented reality and devices.
Dr. Ravin Balakrishnan of the University of Toronto will provide the keynote address for the Symposium. Dr. Balakrishnan is well-known for his research on effective and powerful 3D interaction techniques for emerging technologies such as volumetric displays and wall-sized displays. He is also a leader in the international human-computer interaction community. Dr. Balakrishnan's presentation will challenge researchers in 3D user interfaces to think more deeply about the application of their work to real-word problems.
We would like to thank all of the people who made this first-ever 3DUI Symposium possible. First, a big thank you to all of the dedicated reviewers who participated in the peer review process - your service helped to ensure the high quality of this technical program. Thanks are due to Simon Julier and Jim Chen, general chairs of IEEE VR 2006, who helped us make the transition from workshop to symposium smoothly and easily. We also thank the IEEE, the VGTC, and the VR steering committee for their support, as well as James Steward of Precision Conference Systems. Finally we thank all of the authors and researchers who submitted their work to the Symposium.
We trust that 3DUI 2006 will be the first in a long line of successful and influential events. Enjoy the Symposium!},
keywords = {3D user interfaces, virtual reality},
}
@comment{c, c={leave the "_stuerzlinger" in the ID to enable umlaut-free search!}}
@proceedings{bowman_stuerzlinger2005newdirections,
title = {New Directions in {3D} User Interfaces},
author = {Bowman, Doug and Fröhlich, Bernd and Kitamura, Yoshifumi and Stürzlinger, Wolfgang},
publisher = {Shaker Verlag},
year = {2005},
month = {Mar},
url = {https://www.shaker.de/de/content/catalogue/index.asp?lang=en&ID=8&ISBN=978-3-8322-3830-8},
pdf = {papers/3dui_workshop.pdf},
teaser = {teasers/3dui_workshop.png},
abstract = {This workshop focuses on novel research in three-dimensional user interfaces (3D UIs). The workshop builds on and expands the scope of last year's workshop "Beyond Wand and Glove Based Interaction." The theme of the workshop will again be on moving beyond the "common" and "traditional" (if one can use those words with respect to such a young research area) approaches to 3D UIs.
Just as wands, 3D mice, and gloves became traditional input devices for 3D UIs, a handful of well-known interaction techniques and UI metaphors also became de facto standards (often because they were the default interaction techniques in widely-used software toolkits). Most of these basic techniques, however, have been around for 5-10 years. Although this could certainly change, it seems that the discovery of radical new metaphors for the "universal 3D tasks" (navigation, selection, manipulation, system control) has slowed down significantly. This does not mean, however, that we should stop doing research on interaction techniques for these tasks. Rather, it means we have to improve the existing metaphors in subtle ways, experiment with the use of new devices, and consider the use of such techniques in specific domains or by specific types of users. Recent research has shown that there is still much to be learned in this area, and that current techniques can be enhanced to dramatically improve usability .
In this workshop, we will spotlight research that investigates novel and enhanced methods of 3D interaction for immersive virtual environments (VEs), augmented and mixed reality (AR/MR), and desktop 3D systems. Relevant topics include: 3D input devices, 3D display devices, 3D interaction techniques, 3D user interface metaphors, collaborative 3D interaction, evaluation methods for 3D UIs, application of existing devices/techniques in novel contexts (e.g. to AR, UbiComp, etc., migration of existing techniques to new display platforms.},
keywords = {3D user interfaces, virtual reality},
}
@book{stuerzlinger2003practical,
title = {Practical Programming in the Unix Environment},
author = {Stürzlinger, Wolfgang},
publisher = {Pearson Custom},
year = {2003},
month = {Jan},
teaser = {teasers/practicalprogramming.png},
abstract = {Today, software bugs are clearly a constant source of frustration with computers and also pose considerable security and safety concerns. While methods exist to prove the correctness of programs, they are not fully automatic and all requires significant training. Consequently, there is no real alternative to careful and systematic testing of programs to ensure that the software fulfills its designated function (even though testing cannot guarantee the absence of bugs). A further indication of the importance of this topic is that all accepted software development practices, such as Extreme Programming, require that programmers test their systems. While testing is taught abstractly in many courses, few students realized how important thorough testing is in practice. Only in the field do they gain this experience and learn the related skills. Hand in hand with testing goes debugging, the art of finding a problem based on observable symptoms and then fixing the problem. Last, but not least, optimization of programs is a skill that is often necessary for competitive systems.
When faced with the task of helping to re-design a second-year course on practical programming, I decided that C and UNIX were the right platform to teach many of the skills necessary for practical program development. Today, many students learn Java (or similar languages) in their first year, as this provides a relatively good and safe environment for learning the fundamental concepts. However, computer science students need to know how the layers underneath a high-level programming language work. C, besides being a high-performance environment and a prerequisite to C++, exposes students to these underlying layers and hence allows them to get a better understanding of how software works. Furthermore, a lot of safety layers (e.g., automatic handling of arithmetic overflows) are not present here, which makes this an ideal vehicle to teach the importance of testing. UNIX, with its cleverly designed file system, interactive shell and scripting languages, provides an excellent environment for systematic and repeated testing. The current implementation of the course teaches the importance of testing via strict enforcement of adherence to specifications in assignments. This is done with automatic, and hence objective, testing of assignments. As the test cases are revealed only after the deadline, this forces students to think very carefully about the robustness of their programs.
This textbook is designed to be used together with "The C Programming Language" by Kernighan & Ritchie. One of the most frustrating aspects of designing a course on practical programing is that there are very few textbooks that cover important skills, such as testing, debugging, optimization, the use of scripting languages, etc. with adequate examples. Fortunately, I found that parts of a book on the UNIX environment ("The UNIX Programming Environment" by Kernighan & Pike) and parts of a book on the practice of programming ("The Practice of Programming" by Kernighan & Pike) provide a good combination. Together, the new book covers most important issues for practical program development and hence forms a good basis for a course that focuses on such issues.
It is my hope that this book will help instructors to communicate practical programming skills as well as help students to develop better software.},
keywords = {programming},
}
@comment{c, c={leave the "_stuerzlinger" in the ID to enable umlaut-free search!}}
@article{heidrich_stuerzlinger2002special,
title = {Special Issue on Hardware-Accelerated Rendering Techniques},
author = {Heidrich, Wolfgang and Stürzlinger, Wolfgang},
journal = {Journal of Graphics Tools},
series = {JGT},
year = {2002},
month = {Dec},
volume = {7},
number = {4},
pages = {1-1},
doi = {https://doi.org/10.1080/10867651.2002.10487565},
teaser = {teasers/jgt4-2002.png},
abstract = {Real-time rendering systems are approaching a level of quality and economy that surpasses even the most elaborate offline rendering system available only ten years ago. As a consequence, hardware-accelerated rendering has had a strong impact on applications such as computer games, modeling and animation, design, and scientific visualization.
The aim of this special issue of the journal of graphics tools is to provide an overview of the state-of-the-art application of graphics hardware to problems in rendering, modeling, visualization, and other areas. One of the challenges in this area is to transform traditional algorithms into a form that adapts to the restrictions dictated by graphics hardware and takes advantage of its specific processing capabilities. These constraints often mandate significant changes or simplifications to the original algorithms, and sometimes lead to the development of new methods. Often it is possible to take a solution developed for solving a particular problem with the help of graphics hardware and to apply the ideas behind it to a completely different problem. This transfer of ideas is one of the motivations behind this special issue, which brings together work from a variety of application domains.
We received 33 submissions for this special issue, illustrating the recent interest in hardware-assisted techniques. From this, we selected 11 papers to be presented here. These represent a cross section of the different application areas for hardware-accelerated rendering. From realistic illumination algorithms to shadowing, from image-based rendering to non-photorealistic rendering, from digital imaging to digital halftoning, and from geometric modeling to collision detection, the papers in this special issue demonstrate the state-of-the art in hardware-assisted techniques. We hope you will enjoy these contributions as much as we did.},
keywords = {rendering, real-time},
}
@proceedings{stuerzlinger2002giproceedings,
title = {Graphics Interface 2002},
author = {Stürzlinger, Wolfgang and {McCool}, Mike},
publisher = {CHCCS and AK Peters},
series = {GI '02},
year = {2002},
month = {May},
url = {https://graphicsinterface.org/proceedings/gi2002},
teaser = {teasers/GI2002.png},
abstract = {Welcome to Graphics Interface (GI) 2002, a conference that combines coverage of original research results in both Human-Computer Interaction and Graphics. The conference took place in Calgary, Alberta, over 27-29 May 2002, and was held in conjunction with the Artificial Intelligence 2002 and Vision Interface 2002 conferences. GI 2002 is the 28th instance of the longest running conference series in human-computer interaction and computer graphics. This event has previously been held two times in Calgary: in 1977 and in 1991.
The program co-chairs received 96 submissions in all areas of human-computer interaction and computer graphics. The large number of submissions was a pleasant surprise; however, the number of submissions also necessitated an enlargement of the program committee on short notice. We are very grateful to all the additional program committee members who agreed to take time out of their busy schedules late in 2001. By agreeing to serve, these additional members reduced the workload on other committee members and permitted us to maintain our high reviewing standards.
The overall quality of the submissions was very high, which made the selection process difficult. After considerable deliberation, the program committee selected 25 papers for publication. The international program committee consisted of 20 people from around the world. Each paper received at least 4 reviews, two of which were from members of the program committee. The reviewing process was double-blind, and the identity of the authors was known only to program co-chairs and the program committee member responsible for choosing external reviewers for each submission. The program committee members were often able to solicit reviews from some of the topmost experts in a particular area of research. We greatly appreciate the effort of the members of the program committee. We would like to extend additional thanks to the 13 members of the program committee who attended the meeting at York University, Toronto, Canada on 16 February 2002 and funded their own travel.
Graphics Interface customarily has several invited speakers. This year three invited speakers were: Saul Greenberg, Professor at the University of Calgary; John Buchanan, Electronic Arts Canada and Adjunct Professor at the University of Alberta; and David Kirk, Chief Scientist at NVIDIA. We extend our gratitude to them for sharing their inspiration in their respective fields.
We would like to thanks James Stewart for his work on the PCS electronic submission and reviewing system. His help behind the scenes made our job a lot easier! We would also like to thank Pierre Poulin and Kelly Booth for handling the liaison with AI and VI conference organizers, and Kelly Booth again for additional valuable advice. We thank further all referees for their voluntary work, Ravin Balakrishnan for handling the posters, Sara Diamond for organizing the video show, and Fred Peet, treasurer of the Canadian Human-Computer Communication Society, for keeping the finances straight, and Graphics Services at the University of Waterloo for doing such an excellent job on the proceedings. Last but not least, we send a very big thanks to Camille Sinanan, Sheelagh Carpendale, Mario Costa-Sousa, and Joerg Denzinger for the local organization of the joint conferences at the University of Calgary. Without their work, this conference would simply not have been possible.
For further information about the conference series we invite you to visit our web site: http://www.graphicsinterface.org/},
keywords = {human-computer interaction, HCI, computer graphics},
}
@proceedings{stuerzlinger2002egveproceedings,
title = {Eurographics Workshop on Virtual Environments 2002},
author = {Stürzlinger, Wolfgang and Müller, Stefan},
publisher = {ACM SIGGRAPH},
series = {EGVE '02},
year = {2002},
month = {May},
url = {https://dl.acm.org/doi/proceedings/10.5555/509709},
teaser = {teasers/EGVE2002.png},
abstract = {This book contains the proceedings of the Eighth EUROGRAPHICS Workshop on Virtual Environments. The event was held in Barcelona from May 30 to May 31, 2002. The workshop brought together scientists, developers, and users from all over the world to present and discuss the latest scientific advances in the field of Virtual Environments. 60 papers were submitted for reviewing and 22 were selected to be presented at the workshop. Most of the top research institutions working in the area submitted papers and presented their latest results. The presentations were complemented by two keynote talks from Marc Mine (Walt Disney Imagineering - VR Studio) and Eric Badiqué (European Commission - IST program). The research presented at this workshop can be classified into the following aspects of Virtual Environments (VEs): Input and Output Devices, Interaction and Navigation, Evaluation, Collaboration, Systems, and Applications. Devices focus mainly on hardware issues to interface with a simulation, whereas Interaction and Navigation techniques investigate how the raw input is best interpreted so that the user can easily achieve his/her goals. Evaluations provide data about the usability of Virtual Environments, and the importance of objective and reproducible studies can only be stressed. Virtual Environments are often used to communicate and to co-operate and this focus is evident in the research on Collaboration. The area of Systems discusses the various tradeoffs in building complete solutions and last, but not least, applications report on the transfer of research results into the real world. However, the reader should note that many contributions cross these boundaries, which reflects the multidisciplinary nature of Virtual Environments.},
keywords = {virtual reality},
}
@proceedings{stuerzlinger2000giposterproceedings,
title = {Poster Proceedings Graphics Interface 2000},
author = {Stürzlinger, Wolfgang},
series = {GI '00},
year = {2000},
month = {May},
teaser = {teasers/GIposter2000.png},
abstract = {After the success of last year, I am happy to report that Graphics Interface was again able to attract a large number of posters. This year a significant part of the submissions is from all over the world, which underlines the international aspect of the conference. Furthermore, the topics nicely cover the range of research areas that are the focus of the conference: Graphics and Human-Computer Interaction.
Posters are an excellent medium for communicating new and emerging ideas. For many first-time authors it also enables them to meet future colleagues. I encourage all conference participants to go to the poster session and meet the authors in person. Please chat with the students and provide them with feedback!},
keywords = {human-computer interaction, HCI, computer graphics},
}
@comment{************************journal_articles************************}
@comment{c, c={not sure if this is best article or proceedings}}
@comment{barrera2027dagstuhl,
title = {Sketching Beyond 2D in Extended Reality (Dagstuhl Seminar 27022)},
author = {Barrera Machuca, Mayra Donaji and Jackson, Bret and Keefe, Daniel and Habakuk, Johann and Stuerzlinger, Wolfgang},
journal = {Dagstuhl Reports},
publisher = {Schloss Dagstuhl-Leibniz-Zentrum fuer Informatik},
commented-series = {Dagstuhl Seminar 27022},
commented-issn = {2192-5283},
year = {2027},
month = {Jun},
commented-volume = {0},
commented-number = {0},
commented-pages = {1-9},
commented-doi = {https://doi.org/10.4230/DagRep.0.0.1},
commented-pdf = {papers/dagstuhl_IA.pdf},
commented-teaser = {teasers/dagstuhl.png},
commented-abstract = {Advances in virtual, mixed, and augmented reality (VR, MR, AR) have enabled a new form of computer-mediated art expression called 3D sketching, also referred to as "3D painting", "3D drawing", or a variant of "immersive sketching", which allows artists, engineers, designers, and scientists to create 3D works in a body-centric space. One of the unique aspects of 3D sketching is that it requires a computer-based tracking system to record the artist's spatial movements, which create the digital marks, and computer graphics techniques to render these marks in space. Moreover, the resulting sketch is often displayed in this same 3D space, e.g., via the use of immersive computer displays.
This dependency on computer systems to create and display the creations makes 3D sketching a unique medium that requires the union of artists and computer scientists to develop tools that artists can then use to interact with the 3D "canvas". Thus, over the last 30 years, the computing research and digital arts communities have collaborated to study and exhibit 3D sketching techniques, applications, and artifacts.
This Dagstuhl Seminar invites participants to broaden these collaborations by combining computer scientists, cognitive scientists, artists, engineers, and practitioners from both academia and industry.
The seminar will provide the unique opportunity to foster intellectual exchange on three general themes: (1) Technology: the design and implementation of novel user interfaces and hardware that address the needs of artists and other practitioners, (2) Theory: understanding the role of spatial perception and cognition in the act of sketching, and (3) Creative Practice and Education: identifying novel ways to train the next generation of 3D sketching artists. The seminar’s goals include:
- Coalescing an international community of creative practitioners, educators, and researchers working with 3D drawing, including establishing a new online presence at http://3ddrawing.org/
- Mapping and disseminating a future research agenda for 3D sketching, including a position paper and tutorials at top conferences like IEEE VR and ACM CHI.
- Making work with 3D drawing more visible to the public by contributing, exhibiting, and supporting emerging venues for exhibiting 3D drawings in places like ARSElectronica, SIGGRAPH Art Show or the IEEE XR Gallery.
- Describing training and education methods for 3D sketching, including identifying best practices that artists and schools can apply.
By fulfilling these goals, this seminar aims to guide our ability to teach and use 3D sketching tools.},
commented-keywords = {},
}
@article{li2026selectrunning,
title = {Investigating 3D Selection Performance While Running in Extended Reality: an In-depth Study of the Effect of Speed},
author = {Li*, Ang and Knibbe, Jarrod and Tatsuzawa*, Kiichiro and Demartini, Gianluca and Viller, Stephen and Wallis, Guy and Stuerzlinger, Wolfgang and Cordeil, Maxime},
journal = {Transactions on Visualization and Computer Graphics},
publisher = {IEEE},
series = {TVCG},
year = {2026},
month = {Sep},
commented-volume = {32},
commented-number = {0},
numpages = {13},
commented-doi = {https://doi.org/10.1109/ISMAR0000.2026.00000},
commented-pdf = {papers/selectrunning.pdf},
commented-video = {videos/selectrunning.mp4},
commented-teaser = {teasers/selectrunning.png},
abstract = {We explore how running speed affects target selection in immersive environments. Through a Fitts' tapping task, we investigate direct touch selections while participants are standing or running (at speeds up to 9 km/h). We conduct a multifaceted controlled study (n=22) to understand the effect of speed, pointing phase, and foot-strike on selection performance. We find that speed dramatically increases movement time, error rate, perceived exertion, and task load. The increased movement time is driven by the correction phase, which doubles in duration at 9 km/h, while the ballistic phase remains stable. Our exploratory analysis further reveals that a higher cadence reduces the error rate at lower speeds (4.5 km/h), while this effect disappears at higher speeds (9 km/h), as participants' motor control in target selection is significantly disrupted by the movement oscillations. As the selection error rate quickly exceeds 30% when speed increases, even with accurate, fast external tracking, we argue that direct touch interaction is likely inappropriate for running. Further efforts are needed to facilitate selection interaction at higher running speeds.},
keywords = {3D pointing, running, jogging},
note = {To appear},
}
@article{rasoulifar2026dynamicvac,
title = {Dynamic Vergence–Accommodation Conflict: Effects on 3D Selection Performance When Target Depth Changes},
author = {Rasoulifar+, Zahra and Turkmen*, Rumeysa and Barrera Machuca, Mayra D. and Stuerzlinger, Wolfgang and Batmaz, Anil Ufuk},
journal = {Transactions on Visualization and Computer Graphics},
publisher = {IEEE},
series = {TVCG},
year = {2026},
month = {Oct},
commented-volume = {32},
commented-number = {11},
numpages = {11},
commented-doi = {https://doi.org/10.1109/ISMAR0000.2026.00000},
commented-pdf = {papers/dynamicvac.pdf},
commented-video = {videos/dynamicvac.mp4},
commented-teaser = {teasers/dynamicvac.png},
abstract = {The effect of the Vergence--Accommodation Conflict (VAC) in state-of-the-art head-mounted displays on 3D interaction performance is well-studied in scenarios where targets remain stationary at a fixed depth. Yet, many VR applications include targets moving continuously toward or away from the user, causing vergence demand to change over time while accommodation remains fixed at the display focal plane. We study this scenario using an ISO 9241-411 multidirectional target selection task with: \emph{No VAC} (targets at the display focal plane), \emph{Constant VAC} (targets further from the focal plane), \emph{Varying VAC} (targets appear at both No VAC and Constant VAC depths across selections), and \emph{Dynamic VAC} (target depth changes continuously during acquisition) conditions. In a within-subjects study with 24 participants, Dynamic VAC produced slower selections, higher error rates, lower accuracy, and reduced throughput compared with the No VAC condition. To account for target movements in depth, we propose an extension of Fitts’ law that models the additional performance costs introduced by continuously changing vergence demand. Our results provide guidance for modeling and designing interaction techniques in depth-varying 3D environments.},
keywords = {3D pointing},
note = {ISMAR '26, conditionally accepted, to appear},
}
@article{jeong2026throwmodel,
title = {Modeling Throwing Selection in Virtual Reality},
author = {Jeong*, Jae-Yeop and Stuerzlinger, Wolfgang and Jeong, Jin-Woo},
journal = {Transactions on Visualization and Computer Graphics},
publisher = {IEEE},
series = {TVCG},
year = {2026},
month = {Oct},
commented-volume = {32},
commented-number = {11},
numpages = {11},
commented-doi = {https://doi.org/10.1109/ISMAR0000.2026.00000},
commented-pdf = {papers/throwmodel.pdf},
commented-video = {videos/throwmodel.mp4},
commented-teaser = {teasers/throwmodel.png},
abstract = {Throwing is a natural and embodied interaction for selecting distant targets in virtual reality (VR). Unlike conventional pointing, throwing is ballistic: once released, the trajectory can no longer be corrected. Despite its practical importance, throwing-based target selection has received relatively little attention in human behavior and performance modeling, making systematic design and evaluation still difficult. In this paper, we investigate throwing-based target selection in VR and propose predictive models for its behavior and performance. Through a controlled user study manipulating target width ($W$) and movement amplitude ($A$), we measured planning time ($PT$) and endpoint distribution. Our results showed that $PT$ increased systematically with task difficulty, following a pattern similar to movement time in Fitts' law. Throwing endpoints were also generally well approximated by a bivariate Gaussian distribution, and target parameters significantly affected both endpoint bias and variability. Based on these findings, we derived a probabilistic accuracy model that predicts target acquisition performance. The proposed models showed high goodness-of-fit, and the accuracy model was robust under leave-one-condition-out cross-validation. Our findings provide a quantitative understanding of throwing-based target selection and support the design of throwing interactions in immersive environments.},
keywords = {selection, throwing},
note = {ISMAR '26, conditionally accepted, to appear},
}
@article{bashar2026vacgazeconflict,
title = {Evaluating the Vergence–Accommodation Conflict in Gaze-Based 3D Target Selection},
author = {Bashar*, Mohammad Raihanul and Amini*, Mohammadreza and Mutasim, Aunnoy K. and Barrera Machuca, Mayra D. and Stuerzlinger, Wolfgang and Batmaz, Anil Ufuk},
journal = {Transactions on Visualization and Computer Graphics},
publisher = {IEEE},
series = {TVCG},
year = {2026},
month = {Oct},
commented-volume = {32},
commented-number = {11},
numpages = {11},
commented-doi = {https://doi.org/10.1109/ISMAR0000.2026.00000},
commented-pdf = {papers/vacgazeconflict.pdf},
commented-video = {videos/vacganzeconflict.mp4},
commented-teaser = {teasers/vacgazeconflict.png},
abstract = {State-of-the-art head-mounted displays (HMDs) enable gaze-based selection in virtual environments. Yet, these HMDs suffer from the vergence–accommodation conflict (VAC), which is known to affect interaction performance. The VAC might influence gaze-based selection performance because it directly affects eye-movement behavior. Thus, in this paper, we investigate how the VAC influences \gaze-based 3D target selection across varying depth conditions. Our results show that as the (visual) depth increases, user performance significantly decreases with gaze-based selection. Moreover, a previously suggested ``\textit{Variation in Diopter}'' Fitts’ law model captured this performance change better relative to a linear model. These findings provide evidence that gaze-based pointing is negatively affected by the VAC and highlight the importance of accounting for depth-dependent factors when designing gaze-based interaction in 3D environments.},
keywords = {3D pointing, eye gaze},
note = {ISMAR '26, conditionally accepted, to appear},
}
@article{hu2025trackingaccuracysteering,
title = {Exploring and Modeling the Effects of Eye-Tracking Accuracy and Precision on Gaze-Based Steering in Virtual Environments},
author = {Hu*, Xuning and Zhang*, Yichuan and Wei*, Yushi and Zhang*, Liangyuting and Li, Yue and Stuerzlinger, Wolfgang and Liang, Hai-Ning},
journal = {Transactions on Visualization and Computer Graphics},
publisher = {IEEE},
series = {TVCG},
year = {2025},
month = {Oct},
volume = {31},
number = {11},
pages = {9559-9569},
doi = {https://doi.org/10.1109/TVCG.2025.3616824},
pdf = {papers/trackingaccuracysteering.pdf},
teaser = {teasers/trackingaccuracysteering.png},
abstract = {Recent advances in eye-tracking technology have positioned gaze as an efficient and intuitive input method for Virtual Reality (VR), offering a natural and immersive user experience. As a result, gaze input is now leveraged for fundamental interaction tasks such as selection, manipulation, crossing, and steering. Although several studies have modeled user steering performance across various path characteristics and input methods, our understanding of gaze-based steering in VR remains limited. This gap persists because the unique qualities of eye movements—involving rapid, continuous motions—and the variability in eye-tracking make findings from other input modalities nontransferable to a gaze-based context, underscoring the need for a dedicated investigation into gaze-based steering behaviors and performance. To bridge this gap, we present two user studies to explore and model gaze-based steering. In the first one, user behavior data are collected across various path characteristics and eye-tracking conditions. Based on this data, we propose four refined models that extend the classic Steering Law to predict users’ movement time in gaze-based steering tasks, explicitly incorporating the impact of tracking quality. The best-performing model achieves an adjusted R^2 of 0.956, corresponding to a 16% improvement in movement time prediction. This model also yields a substantial reduction in AIC (from 1550 to 1132) and BIC (from 1555 to 1142), highlighting improved model quality and better balance between goodness of fit and model complexity. Finally, data from a second study with varied settings, such as a different eye-tracking sampling rate, illustrate the strong robustness and predictability of our models. Finally, we present scenarios and applications that demonstrate how our models can be used to design enhanced gaze-based interactions in VR systems.},
keywords = {eye tracking, gaze steering},
award = {This work received an Honorable Mention Award},
note = {ISMAR '25},
}
@article{mostajeran2025biophilicsteering,
title = {The Effects of Biophilic Design on Steering Performance in Virtual Reality},
author = {Mostajeran, Fariba and Friedrich*, Moritz and Steinicke, Frank and Kühn, Simone and Stuerzlinger, Wolfgang},
journal = {Scientific Reports},
publisher = {Nature Portfolio},
series = {SciRep},
year = {2025},
month = {Sep},
volume = {15},
commented-number = {1},
articleno = {32485},
numpages = {12},
doi = {https://doi.org/10.1038/s41598-025-19113-4},
pdf = {papers/biophilicsteering.pdf},
teaser = {teasers/biophilicsteering.png},
abstract = {Biophilic design aims to connect people to nature by incorporating natural elements such as plants in built environments. In immersive virtual reality (VR) environments, experiments have shown that, for instance, the presence of virtual plants in VR leads to higher cognitive performance and psychological well-being. However, it has not been investigated so far whether such effects extend to the performance of spatial interaction tasks such as path steering. In this paper, we explore the effects of the presence of virtual plants in an immersive virtual office environment on path steering performance in VR. For this purpose, we combined and replicated two previous studies in this field. The results of our study did not find an effect of the presence of virtual plants on steering time, as our participants performed all steering tasks in a similar amount of time in both biophilic and non-biophilic environments. We could, however, replicate one of the original studies on path steering in VR by Liu et al. and show that the steering time in our study also follows the extension of the steering law proposed in their work. Accordingly, we found not only a significant effect of the length (p < .001, effect size: partial eta squared=.93) and width (p < .001, effect size=.96) of the steering path, but also a significant effect of the path curvature (p=.003, effect size=.64) on the time needed for steering through the path. We also found significant effects of path latitude (p < .001, effect size=.57) and longitude (p=.01, effect size=.18) on steering time. Our findings challenge the previous research, which demonstrated the positive effects of biophilic design in VR on cognitive processes, and therefore, pave the path for future work to better understand the effects of biophilic design on users’ performance in VR.},
keywords = {biophilic design, cognition, well-being},
}
@article{bashar2025depthvac,
title = {The Effect of Visual Depth on the Vergence-Accommodation Conflict on 3D Selection Performance within Virtual Reality Headsets},
author = {Bashar*, Mohammad Raihanul and Barrera Machuca, Mayra Donaji and Stuerzlinger, Wolfgang and Batmaz, Anil Ufuk},
journal = {Visual Computer},
publisher = {Springer},
commented-series = {VisComp},
year = {2025},
month = {May},
volume = {41},
commented-number = {},
pages = {9645-9661},
doi = {https://doi.org/10.1007/s00371-025-03990-x},
pdf = {papers/depthvac.pdf},
teaser = {teasers/depthvac.png},
abstract = {Prior studies have shown that the vergence-accommodation conflict (VAC) negatively affects the interaction performance in Virtual Reality (VR) and Augmented Reality (AR) systems, particularly as object depth increases. This paper examines user selection performance across six different visual depths. Through a study closely resembling prior research, eighteen participants participated in an ISO 9241:411 task with six different depth distances. We observed that with higher depth values, selection times increased while the throughput performance of the participants decreased. Based on this finding, we propose a Fitts' law model based on the focal distances, which models pointing times in VR and AR systems with substantially higher accuracy. We hope that our findings aid developers in creating 3D user interfaces for VR and AR that offer better performance and an improved user experience.},
keywords = {3D pointing, vergence-accomodation conflict},
}
@article{menin2025thematicmobility,
title = {What about thematic information? An analysis of the multidimensional visualization of individual mobility},
author = {Menin*, Aline and Quere*, Clément and Wagner*, Jorge and Chardonnel, Sonia and Davoine, Paule-Annick and Stuerzlinger, Wolfgang and Freitas, Carla Maria Dal Sasso and Nedel, Luciana and Winckler, Marco},
journal = {Visual Informatics},
publisher = {Elsevier},
commented-series = {VisInf},
year = {2025},
month = {Mar},
volume = {9},
number = {1},
pages = {99-115},
doi = {https://doi.org/10.1016/j.visinf.2025.02.002},
pdf = {papers/thematicmobility.pdf},
teaser = {teasers/thematicmobility.png},
abstract = {This paper reviews the literature on the visualization of individual mobility data, with a focus on thematic integration. It emphasizes the importance of visualization in understanding mobility patterns within a population and how it helps mobility experts to address domain-specific questions. We analyze 38 papers published between 2010 and 2024 in GIS and VIS venues that describe visualizations of multidimensional data related to individual movements in urban environments, concentrating on individual mobility rather than traffic data. Our primary aim is to report advances in interactive visualization for individual mobility analysis, particularly regarding the representation of thematic information about people’s motivations for mobility. Our findings indicate that the thematic dimension is only partially represented in the literature, despite its critical significance in transportation. This gap often stems from the challenge of identifying data sources that inherently provide this information, necessitating visualization designers and developers to navigate multiple, heterogeneous data sources. We identify the strengths and limitations of existing visualizations and suggest potential research directions for the field.},
keywords = {visual analytics, visualization, thematic information, individual mobility},
}
@article{mutasim2025gazegem,
title = {The Influence of Eye Gaze Interaction Technique Expertise and the Guided Evaluation Method on Text Entry Performance Evaluations},
author = {Mutasim*, Aunnoy K and Batmaz, Anil Ufuk and Hudhud Mughrabi*, Moaaz and Stuerzlinger, Wolfgang},
journal = {Proceedings of the ACM Human-Computer Interaction},
publisher = {ACM},
series = {PACM-HCI},
year = {2025},
month = {May},
volume = {9},
number = {3},
articleno = {ETRA17},
numpages = {19},
doi = {https://doi.org/10.1145/3725842},
pdf = {papers/gazegem.pdf},
teaser = {teasers/gazegem.png},
video = {videos/gazegem.mp4},
abstract = {Any investigation of learning unfamiliar text entry systems is affected by the need to train participants on multiple new components simultaneously, such as novel interaction techniques and layouts. The Guided Evaluation Method (GEM) addresses this challenge by bypassing the need to learn layout-specific skills for text entry. However, a gap remains as the GEM’s performance has not been assessed in situations where users are unfamiliar with the interaction technique involved, here eye-gaze-based dwell. To address this, we trained participants on only the eye-gaze-based interaction technique over eight days with QWERTY and then evaluated their performance on the OPTI layout with the GEM. Results showed that the unfamiliar OPTI layout outperformed QWERTY, with QWERTY's speed aligning with previous findings, suggesting that interaction technique expertise significantly impacts performance outcomes. Importantly, we also identified that for scenarios where the familiarity with the involved interaction technique(s) is the same, the GEM analyzes the performance of keyboard layouts effectively and quickly identifies the best option.},
keywords = {text entry, layout learning, eye tracking, gaze},
note = {ETRA '25},
}
@article{lee2025scalingtechniques,
title = {Scaling Techniques for Exocentric Navigation Interfaces in Multiscale Virtual Environments},
author = {Lee, Jong-In and Stuerzlinger, Wolfgang},
journal = {Transactions on Visualization and Computer Graphics},
publisher = {IEEE},
series = {TVCG},
year = {2025},
month = {Mar},
volume = {31},
number = {5},
pages = {2704-2714},
doi = {https://doi.org/10.1109/TVCG.2025.3549535},
pdf = {papers/scalingtechniques.pdf},
teaser = {teasers/scalingtechniques.png},
video = {videos/scalingtechniques.mp4},
abstract = {Navigating multiscale virtual environments necessitates an interaction method to travel across different levels of scale (LoS). Prior research has studied various techniques that enable users to seamlessly adjust their scale to navigate between different LoS based on specific user contexts. We introduce a scroll-based scale control method optimized for exocentric navigation, targeted at scenarios where speed and accuracy in continuous scaling are crucial. We pinpoint the challenges of scale control in settings with multiple LoS and evaluate how distinct designs of scaling techniques influence navigation performance and usability. Through a user study, we investigated two pivotal elements of a scaling technique: the input method and the scaling center. Our findings indicate that our scroll-based input method significantly reduces task completion time and error rate and enhances efficiency compared to the most frequently used bi-manual method. Moreover, we found that the choice of scaling center affects the ease of use of the scaling method, especially when paired with specific input methods.},
keywords = {3D navigation, multiscale virtual environment, 3D locomotion},
note = {VR '25},
}
@article{mutasim2024gem,
title = {The Guided Evaluation Method: An Easier Way to Empirically Estimate Trained User Performance for Unfamiliar Keyboard Layouts},
author = {Mutasim*, Aunnoy K and Batmaz, Anil Ufuk and Hudhud Mughrabi+, Moaaz and Stuerzlinger, Wolfgang},
journal = {International Journal of Human-Computer Studies},
publisher = {Elsevier},
series = {IJHCS},
year = {2024},
month = {Oct},
volume = {190},
articleno = {103317},
numpages = {19},
doi = {https://doi.org/10.1016/j.ijhcs.2024.103317},
pdf = {papers/gem.pdf},
teaser = {teasers/gem.png},
abstract = {To determine in a user study whether proposed keyboard layouts, such as OPTI, can surpass QWERTY in performance, extended training through longitudinal studies is crucial. However, addressing the challenge of creating trained users presents a logistical bottleneck. A common alternative involves having participants type the same word or phrase repeatedly. We conducted two separate studies to investigate this alternative. The findings reveal that both approaches, repeatedly typing words or phrases, have limitations in accurately estimating trained user performance. Thus, we propose the Guided Evaluation Method (GEM), a novel approach to quickly estimate trained user performance with novices. Our results reveal that in a matter of minutes, participants exhibited performance similar to an existing longitudinal study — OPTI outperforms QWERTY. As it eliminates the need for resource-intensive longitudinal studies, our new GEM thus enables much faster estimation of trained user performance. This outcome will potentially reignite research on better text entry methods.},
keywords = {text entry, touch typing, soft keyboards, layout learning},
}
@article{hoerantner2024vismet,
title = {Visual training in dry age-related macular degeneration},
author = {Hörantner, Robert and Wolfsgruber, Jürgen and Stürzlinger, Gerald and Stürzlinger, Wolfgang and Hörantner, Paul},
journal = {Spektrum der Augenheilkunde},
publisher = {Springer},
year = {2024},
month = {Aug},
volume = {39},
number = {1},
pages = {4-8},
doi = {https://doi.org/10.1007/s00717-024-00578-z},
pdf = {papers/vismet.pdf},
teaser = {teasers/vismet.png},
abstract = {Purpose: To investigate the efficacy of visual training with stimulation in patients with dry age-related macular degeneration (AMD).
Method: The Medical Eye Trainer (M.E.T.) was tested in 67 patients with dry AMD. By using the training system, the entire visual system is treated. A moving grid is displayed on a standard smartphone or tablet. The training was carried out once a day for 90 seconds over a total period of two months.
Results: The Medical Eye Trainer (M.E.T.) significantly improved visual function after two months. The results of a questionnaire, which was used after the therapy, also showed a satisfactory stabilization or improvement of the findings.
Conclusions: The M.E.T. represents an effective additional treatment option for patients with dry AMD without interfering with established treatment methods.},
keywords = {macular degeneration, dry AMD, visual training, visual perception},
note = {In German},
}
@article{rajabiseraji2024hybridaxes,
title = {Analyzing User Behaviour Patterns in a Cross-virtuality Immersive Analytics System},
author = {Rajabi Seraji*, Mohammad and Piray*, Parastoo and Zahednejad*, Vahid and Stuerzlinger, Wolfgang},
journal = {Transactions on Visualization and Computer Graphics},
publisher = {IEEE},
series = {TVCG},
year = {2024},
month = {Mar},
volume = {30},
number = {5},
pages = {2613-2623},
doi = {https://doi.org/10.1109/TVCG.2024.3372129},
pdf = {papers/hybridaxes2.pdf},
teaser = {teasers/hybridaxes2.png},
video = {videos/hybridaxes2.mp4},
abstract = {Recent work in immersive analytics suggests benefits for systems that support work across both 2D and 3D data visualizations, i.e., cross-virtuality analytics systems. Here, I introduce HybridAxes, an immersive visual analytics system that enables users to conduct their analysis either in 2D on desktop monitors or in 3D within an immersive AR environment - while enabling them to seamlessly switch and transfer their visualizations between the two modes. The results of my user study show that the cross-virtuality sub-systems in HybridAxes complement each other well in helping the users in their data-understanding journey. I show that users preferred using the AR component for exploring the data, while they used the desktop component to work on more detail-intensive tasks. Despite encountering some minor challenges in switching between the two virtuality modes, users consistently rated the whole system as highly engaging, user-friendly, and helpful in streamlining their analytics processes. Finally, I present suggestions for designers of cross-virtuality visual analytics systems and identify avenues for future work.},
keywords = {immersive analytics, cross-reality, augmented reality},
award = {This work received an Honorable Mention Award},
note = {VR '24}
}
@article{barrera2023immersivesketchingframework,
title = {Toward More Comprehensive Evaluations of 3D Immersive Sketching, Drawing, and Painting},
author = {Barrera Machuca, Mayra Donaji and Israel, Johann Habakuk and Keefe, Daniel F. and Stuerzlinger, Wolfgang},
journal = {Transactions on Visualization and Computer Graphics},
publisher = {IEEE},
series = {TVCG},
year = {2024},
month = {Aug},
volume = {30},
number = {8},
pages = {4648-4664},
doi = {https://doi.org/10.1109/TVCG.2023.3276291},
pdf = {papers/immersivesketchingframework.pdf},
teaser = {teasers/immersivesketchingframework.png},
abstract = {To understand current practice and explore the potential for more comprehensive evaluations of 3D immersive sketching, drawing, and painting, we present a survey of evaluation methodologies used in existing 3D sketching research, a breakdown and discussion of important phases (sub-tasks) in the 3D sketching process, and a framework that suggests how these factors can inform evaluation strategies in future 3D sketching research. Existing evaluations identified in the survey are organized and discussed within three high-level categories: 1) evaluating the 3D sketching activity, 2) evaluating 3D sketching tools, and 3) evaluating 3D sketching artifacts. The new framework suggests targeting evaluations to one or more of these categories and identifying relevant user populations. In addition, building upon the discussion of the different phases of the 3D sketching process, the framework suggests to evaluate relevant sketching tasks, which may range from low-level perception and hand movements to high-level conceptual design. Finally, we discuss limitations and challenges that arise when evaluating 3D sketching, including a lack of standardization of evaluation methods and multiple, potentially conflicting, ways to evaluate the same task and user interface usability; we also identify opportunities for more holistic evaluations. We hope the results can contribute to accelerating research in this domain and, ultimately, broad adoption of immersive sketching systems.},
keywords = {3D sketching, 3D drawing, 3D painting},
}
@article{mostajeran2023biophilic,
title = {Adding Virtual Plants Leads to Higher Cognitive Performance and Psychological Well-being in Virtual Reality},
author = {Mostajeran, Fariba and Steinicke, Frank and Reinhart*, Sarah and Stuerzlinger, Wolfgang and Riecke, Bernhard E. and Kühn, Simone},
journal = {Scientific Reports},
publisher = {Nature Portfolio},
series = {SciRep},
year = {2023},
month = {May},
volume = {13},
number = {1},
numpages = {12},
doi = {https://doi.org/10.1038/s41598-023-34718-3},
pdf = {papers/biophilic.pdf},
teaser = {teasers/biophilic.png},
abstract = {Previous research has shown the positive effects of exposure to real and virtual nature. To investigate how such benefits might generalize to ever-more-prevalent virtual workplaces, we examined the effects of the absence or presence of virtual plants in an office environment in Virtual Reality (VR) on users’ cognitive performance and psychological well-being. The results of our user study with 39 participants show that in the presence of virtual plants, participants performed significantly better in both short-term memory and creativity tasks. Furthermore, they reported higher psychological well-being scores, including positive affect and attentive coping, whilst reporting lower feelings of anger and aggression after exposure to virtual plants in VR. The virtual office with plants was also perceived as more restorative and induced a higher sense of presence. Overall, these results highlight how the presence of virtual plants in VR can have positive influences on users, and therefore, constitute important design considerations when developing future working and learning spaces.},
keywords = {biophilic design, cognition, well-being},
}
@article{kaya2023covidvis,
title = {Evaluation of an Immersive COVID-19 Data Visualization},
author = {Kaya+, Furkan and Celik+, Elif and Batmaz, Anil Ufuk and Mutasim*, Aunnoy K and Stuerzlinger, Wolfgang},
journal = {Computer Graphics & Applications},
publisher = {IEEE},
series = {CG&A},
year = {2023},
month = {Jan},
volume = {43},
number = {1},
pages = {76-83},
doi = {https://doi.org/10.1109/MCG.2022.3223535},
pdf = {papers/covidvis.pdf},
teaser = {teasers/covidvis.png},
abstract = {COVID-19 restrictions have detrimental effects on the population, both socially and economically. However, these restrictions are necessary as they help reduce the spread of the virus. For the public to comply, easily comprehensible communication between decision-makers and the public is thus crucial. To address this, we propose a novel 3D visualization of COVID-19 data which could increase the awareness of COVID-19 trends in the general population. We conducted a user study and compared a conventional 2D visualization with the proposed method in an immersive environment. Results showed that the our 3D visualization approach facilitated understanding of the complexity of COVID-19. A majority of participants preferred to see the COVID-19 data with the 3D method. Moreover, individual results revealed that our method increases the engagement of users with the data. We hope that our method will help governments to improve their communication with the public in the future.},
keywords = {visualization, 3D visualization, immersive analytics},
}
@article{villanueva2022advancedfatigue,
title = {Advanced Modeling Method for Quantifying Cumulative Subjective Fatigue in Mid-Air Interaction},
author = {Villanueva*, Ana Maria and Jang*, Sujin and Stuerzlinger, Wolfgang and Ambike, Satyajit and Ramani, Karthik},
journal = {International Journal of Human-Computer Studies},
publisher = {Elsevier},
series = {IJHCS},
year = {2023},
month = {Jan},
volume = {169},
commented-number = {0},
articleno = {102931},
numpages = {15},
doi = {https://doi.org/10.1016/j.ijhcs.2022.102931},
pdf = {papers/advancedfatigue.pdf},
teaser = {teasers/advancedfatigue.png},
abstract = {Interaction in mid-air can be fatiguing. A model-based method to quantify cumulative subjective fatigue for such interaction was recently introduced in HCI research. This model separates muscle units into three states: active (MA) fatigued (MF) or rested (MR) and defines transition rules between states. This method demonstrated promising accuracy in predicting subjective fatigue accumulated in mid-air pointing tasks. In this paper, we introduce an improved model that additionally captures the variations of the maximum arm strength based on arm postures and adds linearly-varying model parameters based on current muscle strength. To validate the applicability and capabilities of the new model, we tested its performance in various mid-air interaction conditions, including mid-air pointing/docking tasks, with shorter and longer rest and task periods, and a long-term evaluation with individual participants. We present results from multiple cross-validations and comparisons against the previous model and identify that our new model predicts fatigue more accurately. Our modeling approach showed a 42.5% reduction in fatigue estimation error when the longitudinal experiment data is used for an individual participant’s fatigue. Finally, we discuss the applicability and capabilities of our new approach.},
keywords = {fatigue, mid-air, model, docking, 3D manipulation},
}
@article{yamanaka2022pathsegmentation,
title = {The Effectiveness of Path-segmentation for Modeling Lasso Times in Width-varying Paths},
author = {Yamanaka, Shota and Usuba*, Hiroki and Stuerzlinger, Wolfgang and Miyashita, Homei},
journal = {Proceedings of the ACM Human-Computer Interaction},
publisher = {ACM},
series = {PACM-HCI},
year = {2022},
month = {Dec},
volume = {6},
number = {ISS},
articleno = {584},
pages = {640-659},
doi = {https://doi.org/10.1145/3567737},
pdf = {papers/pathsegmentation.pdf},
video = {videos/pathsegmentation.mp4},
teaser = {teasers/pathsegmentation.png},
abstract = {Models of lassoing time to select multiple square icons exist, but realistic lasso tasks also typically involve encircling non-rectangular objects. Thus, it is unclear if we can apply existing models to such conditions where, e.g., the width of the path that users want to steer through changes dynamically or step-wise. In this work, we conducted two experiments where the objects were non-rectangular with path widths that narrowed or widened, smoothly or step-wise. The results showed that the baseline models for pen-steering movements (the steering and crossing law models) fitted the timing data well, but also that segmenting width-changing areas led to significant improvements. Our work enables the modeling of novel UIs requiring continuous strokes, e.g., for grouping icons.},
keywords = {steering, crossing, lasso, group selection},
note = {ISS '22},
}
@article{batmaz2022throughput,
title = {Effective Throughput Analysis of Different Task Execution Strategies for Mid-Air Fitts' Tasks in Virtual Reality},
author = {Batmaz, Anil Ufuk and Stuerzlinger, Wolfgang},
journal = {Transactions on Visualization and Computer Graphics},
publisher = {IEEE},
series = {TVCG},
year = {2022},
month = {Oct},
volume = {28},
number = {11},
pages = {3939-3947},
doi = {https://doi.org/10.1109/TVCG.2022.3203105},
commented-url = {https://youtu.be/lMUSoiAdwWA},
pdf = {papers/throughputstrategies.pdf},
teaser = {teasers/throughputstrategies.png},
abstract = {Fitts’ law and throughput based on effective measures are two mathematical models frequently used to analyze human motor performance together with a standardized task, e.g., to compare the performance of input and output devices. Even though pointing has been deeply studied in 2D, it is not well understood how different task execution strategies affect throughput in 3D virtual environments. In this work, we examine MacKenzie’s effective throughput measure, claimed to be invariant to task execution strategies, in Virtual Reality (VR) systems with three such strategies, “as fast, as precise, and as fast and as precise as possible” for ray casting and virtual hand interaction, by re-analyzing data from a 3D pointing ISO 9241-411 study. Results show that effective throughput is not invariant for different task execution strategies in VR, which also matches a more recent 2D result. Normalized speed vs accuracy curves also did not fit the data. We suggest that practitioners, developers, and researchers who use MacKenzie’s effective throughput formulation should consider our findings when analyzing 3D user pointing performance in VR systems.},
keywords = {3D pointing, speed-accuracy tradeoff},
note = {ISMAR '22},
}
@article{nowak2021visualanalytics,
title = {Visual Analytics: A Method to Explore Natural Histories of Oral Epithelial Dysplasia},
author = {Nowak*, Stan and Rosin, Miriam and Stuerzlinger, Wolfgang and Bartram, Lyn},
journal = {Frontiers in Oral Health},
publisher = {Frontiers},
year = {2021},
month = {Aug},
volume = {2},
articleno = {703874},
numpages = {10},
doi = {https://doi.org/10.3389/froh.2021.703874},
pdf = {papers/va4oralcancerDRAFT.pdf},
teaser = {teasers/va4oralcancer.png},
abstract = {Risk assessment and follow-up of oral potentially malignant lesions in patients with mild or moderate oral epithelial dysplasia is an ongoing challenge for improved oral cancer prevention. Part of the challenge is a lack of understanding of how observable features of such dysplasia, gathered as data by clinicians during follow-up, relate to underlying biological processes driving progression. Current research is at an exploratory phase where the precise questions to ask are not known. While traditional statistical and the newer machine learning and artificial intelligence methods are effective in well-defined problem spaces with large datasets, these are not the circumstances we face currently. We argue that the field is in need of exploratory methods that can better integrate clinical and scientific knowledge into analysis to iteratively generate viable hypotheses. In this perspective, we propose that visual analytics presents a set of methods well-suited to these needs. We illustrate how visual analytics excels at generating viable research hypotheses by describing our experiences using visual analytics to explore temporal shifts in the clinical presentation of epithelial dysplasia. Visual analytics complements existing methods and fulfills a critical and at-present neglected need in the formative stages of inquiry we are facing.},
keywords = {visual analytics, oral health, visualization, oral cancer},
commented-note = {draft version},
}
@article{wagner2021interaction,
title = {Comparing and Combining Virtual Hand and Virtual Ray Pointer Interactions for Data Manipulation in Immersive Analytics},
author = {Wagner Filho*, Jorge and Stuerzlinger, Wolfgang and Nedel, Luciana},
journal = {Transactions on Visualization and Computer Graphics},
publisher = {IEEE},
series = {TVCG},
year = {2021},
month = {Mar},
volume = {27},
number = {5},
pages = {2513-2523},
doi = {https://doi.org/10.1109/TVCG.2021.3067759},
pdf = {papers/stcinteraction.pdf},
video = {videos/stcinteraction.mp4},
teaser = {teasers/stcinteraction.png},
abstract = {Displaying data visualizations in Virtual Reality environments enables analysts to explore large amounts of information more easily, supported by different perspectives and stereoscopic 3D display. Easy-to-use interaction affords additional benefits, such as more intuitively querying or filtering the data. Many Immersive Analytics systems employ either a virtual hands metaphor, with actions such as grabbing and stretching, or virtual ray pointers, with actions assigned to controller buttons. However, the effect of this choice in immersive visualization systems is unknown. Considering that each approach has different advantages, we implemented and evaluated both as well as a third option: seamlessly integrating both modes and allowing the user to alternate between them without explicit mode switches. We compared these three conditions through a controlled user study in the spatio-temporal data domain. We did not find significant differences between hands and ray-casting in task performance, workload, or interactivity patterns. Yet, 60% of the participants preferred the mixed mode and benefited from it by choosing the best alternative for each low-level task. This mode significantly reduced completion times by 23% for the most demanding task, at the cost of a 5% decrease in overall success rates.},
keywords = {visual analytics, immersive analytics, space-time cube, 3D visualization, 3D interaction},
note = {VR '21},
}
@article{wagner2021navigation,
title = {The Effect of Exploration Mode and Frame of Reference in Immersive Analytics},
author = {Wagner Filho*, Jorge and Stuerzlinger, Wolfgang and Nedel, Luciana},
journal = {Transactions on Visualization and Computer Graphics},
publisher = {IEEE},
series = {TVCG},
year = {2021},
month = {Feb},
volume = {28},
number = {9},
numpages = {3252-3264},
doi = {https://doi.org/10.1109/TVCG.2021.3060666},
pdf = {papers/stcnavigation.pdf},
video = {videos/stcnavigation.mp4},
teaser = {teasers/stcnavigation.png},
abstract = {The design space for user interfaces for Immersive Analytics applications is vast. Designers can combine navigation and manipulation to enable data exploration with ego- or exocentric views, have the user operate at different scales, or use different forms of navigation with varying levels of physical movement. This freedom results in a multitude of different viable approaches. Yet, there is no clear understanding of the advantages and disadvantages of each choice. Our goal is to investigate the affordances of several major design choices, to enable both application designers and users to make better decisions. In this work, we assess two main factors, exploration mode and frame of reference, consequently also varying visualization scale and physical movement demand. To isolate each factor, we implemented nine different conditions in a Space-Time Cube visualization use case and asked 36 participants to perform multiple tasks. We analyzed the results in terms of performance and qualitative measures and correlated them with participants' spatial abilities. While egocentric room-scale exploration significantly reduced mental workload, exocentric exploration improved performance in some tasks. Combining navigation and manipulation made tasks easier by reducing workload, temporal demand, and physical effort.},
keywords = {visual analytics, immersive analytics, space-time cube, 3D visualization, 3D navigation},
}
@comment{c, c={issue appeared in 2021}}
@article{gloumeau2020pinnpivot,
title = {{PinNPivot}: Object Manipulation Using Pins in Immersive Virtual Environments},
author = {Gloumeau*, Paul Christopher and Stuerzlinger, Wolfgang and Han, JungHyun},
journal = {Transactions on Visualization and Computer Graphics},
publisher = {IEEE},
series = {TVCG},
year = {2020},
month = {Apr},
volume = {27},
number = {4},
pages = {2488-2494},
doi = {https://doi.org/10.1109/TVCG.2020.2987834},
pdf = {papers/pinnpivot.pdf},
video = {videos/pinnpivot.mp4},
teaser = {teasers/pinnpivot.png},
abstract = {Object manipulation techniques in immersive virtual environments are either inaccurate or slow. We present a novel technique, PinNPivot, where pins are used to constrain 1DOF/2DOF/3DOF rotations. It also supports 6DOF manipulation and 3DOF translation. A comparison with three existing techniques shows that PinNPivot is significantly more accurate and faster.},
keywords = {3D manipulation, docking},
}
@article{batmaz2020beam,
title = {How Automatic Speed Control Based on Distance Affects User Behaviours in Telepresence Robot Navigation within Dense Conference-like Environments},
author = {Batmaz, Anil Ufuk and Maiero*, Jens and Kruijff, Ernst and Riecke, Bernhard E. and Neustaedter, Carman and Stuerzlinger, Wolfgang},
journal = {PLoS ONE},
publisher = {Public Library of Science},
year = {2020},
month = {Nov},
volume = {15},
number = {11},
articleno = {e0242078},
numpages = {47},
doi = {https://doi.org/10.1371/journal.pone.0242078},
pdf = {papers/beamspeed.pdf},
teaser = {teasers/beamspeed.png},
commented-series = {PLOS One},
abstract = {Telepresence robots allow users to be spatially and socially present in remote environments. Yet, it can be challenging to remotely operate telepresence robots, especially in dense environments such as academic conferences or workplaces. In this paper, we primarily focus on the effect that a speed control method, which automatically slows the telepresence robot down when getting closer to obstacles, has on user behaviors. In our first user study, participants drove the robot through a static obstacle course with narrow sections. Results indicate that the automatic speed control method significantly decreases the number of collisions. For the second study we designed a more naturalistic, conference-like experimental environment with tasks that require social interaction, and collected subjective responses from the participants when they were asked to navigate through the environment. While about half of the participants preferred automatic speed control because it allowed for smoother and safer navigation, others did not want to be influenced by an automatic mechanism. Overall, the results suggest that automatic speed control simplifies the user interface for telepresence robots in static dense environments, but should be considered as optionally available, especially in situations involving social interactions.},
keywords = {telepresence robot, automatic distance, 3D navigation, speed control},
}
@article{alharbi2020frustration,
title = {The Effects of Predictive Features of Mobile Keyboards on Text Entry Speed and Errors},
author = {Alharbi*, Ohoud and Stuerzlinger, Wolfgang and Putze, Felix},
journal = {Proceedings of the ACM Human-Computer Interaction},
publisher = {ACM},
series = {PACM-HCI},
year = {2020},
month = {Nov},
volume = {4},
number = {ISS},
articleno = {183},
numpages = {16},
doi = {https://doi.org/10.1145/3427311},
pdf = {papers/autocorrectfrustration.pdf},
teaser = {teasers/autocorrectfrustration.png},
abstract = {Mobile users rely on typing assistant mechanisms such as prediction and autocorrect. Previous studies on mobile keyboards showed decreased performance for heavy use of word prediction, which identifies a need for more research to better understand the effectiveness of predictive features for different users. Our work aims at such a better understanding of user interaction with autocorrections and the prediction panel while entering text, in particular when these approaches fail. We present a crowd-sourced mobile text entry study with 170 participants. Our mobile web application simulates autocorrection and word prediction to capture user behaviours around these features. We found that using word prediction saves an average of 3.43 characters per phrase but also adds an average of two seconds compared to actually typing the word, resulting in a negative effect on text entry speed. We also identified that the time to fix wrong autocorrections is on average 5.5 seconds but that autocorrection does not have a significant effect on typing speed.},
keywords = {text entry, autocorrect, prediction, errors},
note = {ISS '20},
}
@article{yamanaka2020obstacle,
title = {Necessary and Unnecessary Obstacle Avoidance Movements Affect User Behaviors in Crossing Operations},
author = {Yamanaka, Shota and Stuerzlinger, Wolfgang},
journal = {Transactions on Computer-Human Interaction},
publisher = {ACM},
series = {TOCHI},
year = {2020},
month = {Nov},
volume = {27},
number = {6},
articleno = {44},
numpages = {31},
doi = {https://doi.org/10.1145/3418413},
pdf = {papers/obstacleavoidance.pdf},
teaser = {teasers/obstacleavoidance.png},
abstract = {The "crossing time" to pass between objects in lassoing tasks is predicted by Fitts' law. When an unwanted object, or obstacle, intrudes into the user's path, users curve the stroke to avoid hitting that obstacle. We empirically show that, in the presence of an obstacle, modified Fitts models for pointing with obstacle avoidance can significantly improve the prediction accuracy of movement time compared with standard Fitts' law. Yet, we also found that when an object is (only) close to the crossing path, i.e., a distractor, users still curve their stroke, even though the object does not intrude. We tested the effects of distractor proximity and length. While the crossing motion is modified by a nearby distractor, our results also identify that overall its effect on crossing times was small, and thus Fitts' law can still be applied safely with distractors.},
keywords = {steering, crossing, lasso, group selection, obstacle},
}
@comment{c, c={could be re-classified as misc, see also the blog entry: steed2020covidblog}}
@article{steed2020covid,
title = {Evaluating Immersive Experiences during {COVID-19} and Beyond},
author = {Steed, Anthony and Ortega, Francisco R. and Williams, Adam S. and Kruijff, Ernst and Stuerzlinger, Wolfgang and Batmaz, Anil Ufuk and Stevenson Won, Andrea and Suma Rosenberg, Evan and Simeone, Adalberto L. and Hayes, Aleshia},
journal = {Interactions},
publisher = {ACM},
year = {2020},
month = {Jul},
volume = {27},
number = {4},
pages = {62–67},
doi = {https://doi.org/10.1145/3406098},
pdf = {papers/evaluatingimmersive.pdf},
abstract = {The COVID-19 pandemic has disrupted our daily lives. The safety and well-being of people are paramount, and there is no exception for the human-computer interaction (HCI) field. Most universities and research labs have closed non-critical research labs. With that closure and the student populations having left campus, in-person user studies have been suspended for the foreseeable future. Experiments that involve the usage of specialized technology, such as virtual and augmented reality headsets, create additional challenges. While some head-mounted displays (HMDs) have become more affordable for consumers (e.g., Oculus Quest), there are still multiple constraints for researchers, including the expense of high-end HMDs (e.g., Microsoft Hololens), high-end graphics hardware, and specialized sensors, as well as ethical concerns around reusing equipment that comes in close contact with each participant and may be difficult to sterilize. These difficulties have led the extended reality (XR) community (which includes the virtual reality (VR) and augmented reality (AR) research communities) to ask how we can continue to practically and ethically run experiments under these circumstances. Here, we summarize the status of a community discussion of short-term, medium-term, and long-term measures to deal with the current COVID-19 situation and its potential longer-term impacts. In particular, we outline steps we are taking toward community support of distributed experiments. There are a number of reasons to look at a more distributed model of participant recruitment, including the generalizability of the work and potential access to target-specific, hard-to-reach user groups. We hope that this article will inform the first steps toward addressing the practical and ethical concerns for such studies.},
keywords = {3D user interfaces, COVID-19, virtual reality, augmented reality, extended reality},
}
@article{maiero2019backofdevice,
title = {Back-of-Device Force Feedback Improves Touchscreen Interaction for Mobile Devices},
author = {Maiero*, Jens and Eibich*, David and Kruijff, Ernst and Hinkenjann, André and Stuerzlinger, Wolfgang and Benko, Hrvoje and Ghinea, George},
journal = {Transactions on Haptics},
publisher = {IEEE},
series = {TOH},
year = {2019},
month = {Oct},
volume = {12},
number = {4},
pages = {483-496},
doi = {https://doi.org/10.1109/TOH.2019.2911519},
pdf = {papers/hapticphone.pdf},
teaser = {teasers/hapticphone.png},
abstract = {Touchscreen interaction suffers from occlusion problems as fingers can cover small targets, which makes interacting with such targets challenging. To improve touchscreen interaction accuracy and consequently the selection of small or hidden objects, we introduce a back-of-device force feedback system for smartphones. We introduce a new solution that combines force feedback on the back to enhance touch input on the front screen. The interface includes three actuated pins at the back of a smartphone. All three pins are driven by microservos and can be actuated up to a frequency of 50 Hz and a maximum amplitude of 5 mm. In a first psychophysical user study, we explored the limits of the system. Thereafter, we demonstrate through a performance study that the proposed interface can enhance touchscreen interaction precision, compared to state-of-the-art methods. In particular, the selection of small targets performed remarkably well with force feedback. The study additionally shows that users subjectively felt significantly more accurate with force feedback. Based on the results, we discuss back-to-front feedback design issues and demonstrate potential applications through several prototypical concepts to illustrate where the back-of-device force feedback could be beneficial.},
keywords = {haptics, mobile device, touch},
}
@comment{c, c={issue appeared in 2021}}
@article{nguyenvo2019naviboard,
title = {{NaviBoard} and {NaviChair}: Limited Translation Combined with Full Rotation for Efficient Virtual Locomotion},
author = {Nguyen-Vo*, Thinh and Riecke, Bernhard E. and Stuerzlinger, Wolfgang and Pham*, Duc-Minh and Kruijff, Ernst},
journal = {Transactions on Visualization and Computer Graphics},
publisher = {IEEE},
series = {TVCG},
year = {2019},
month = {Aug},
volume = {27},
number = {1},
pages = {165-177},
doi = {https://doi.org/10.1109/TVCG.2019.2935730},
pdf = {papers/naviboard.pdf},
video = {https://www.youtube.com/watch?v=JCYL2qVFO6M},
teaser = {teasers/naviboard.png},
abstract = {Walking has always been considered as the gold standard for navigation in Virtual Reality research. Though full rotation is no longer a technical challenge, physical translation is still restricted through limited tracked areas. While rotational information has been shown to be important, the benefit of the translational component is still unclear with mixed results in previous work. To address this gap, we conducted a mixed-method experiment to compare four levels of translational cues and control: none (using the trackpad of the HTC Vive controller to translate), upper-body leaning (sitting on a "NaviChair", leaning the upper-body to locomote), whole-body leaning/stepping (standing on a platform called NaviBoard, leaning the whole body or stepping one foot off the center to navigate), and full translation (physically walking). Results showed that translational cues and control had significant effects on various measures including task performance, task load, and simulator sickness. While participants performed significantly worse when they used a controller with no embodied translational cues, there was no significant difference between the NaviChair, NaviBoard, and actual walking. These results suggest that translational body-based motion cues and control from a low-cost leaning/stepping interface might provide enough sensory information for supporting spatial updating, spatial awareness, and efficient locomotion in VR, although future work will need to investigate how these results might or might not generalize to other tasks and scenarios.},
keywords = {3D navigation, speed control},
}
@article{wagner2019evaluating,
title = {Evaluating an Immersive Space-Time Cube Geovisualization for Intuitive Trajectory Data Exploration},
author = {Wagner Filho*, Jorge and Stuerzlinger, Wolfgang and Nedel, Luciana},
journal = {Transactions on Visualization and Computer Graphics},
publisher = {IEEE},
series = {TVCG},
year = {2019},
month = {Oct},
volume = {26},
number = {1},
pages = {514-524},
doi = {https://doi.org/10.1109/TVCG.2019.2934415},
pdf = {papers/stcvirtualdesk.pdf},
video = {videos/stcvirtualdesk.mp4},
teaser = {teasers/stcvirtualdesk.png},
abstract = {A Space-Time Cube enables analysts to clearly observe spatio-temporal features in movement trajectory datasets in geovisualization. However, its general usability is impacted by a lack of depth cues, a reported steep learning curve, and the requirement for efficient 3D navigation. In this work, we investigate a Space-Time Cube in the Immersive Analytics domain. Based on a review of previous work and selecting an appropriate exploration metaphor, we built a prototype environment where the cube is coupled to a virtual representation of the analyst's real desk, and zooming and panning in space and time are intuitively controlled using mid-air gestures. We compared our immersive environment to a desktop-based implementation in a user study with 20 participants across 7 tasks of varying difficulty, which targeted different user interface features. To investigate how performance is affected in the presence of clutter, we explored two scenarios with different numbers of trajectories. While the quantitative performance was similar for the majority of tasks, large differences appear when we analyze the patterns of interaction and consider subjective metrics. The immersive version of the Space-Time Cube received higher usability scores, much higher user preference, and was rated to have a lower mental workload, without causing participants discomfort in 25-minute-long VR sessions.},
keywords = {visual analytics, immersive analytics, space-time cube, 3D visualization},
note = {VIS '19},
}
@article{yamanaka2018analysis,
title = {Analysis and Modeling the Steering Operations in Sequential Linear Path Segments},
author = {Yamanaka*, Shota and Stuerzlinger, Wolfgang and Miyashita, Homei},
journal = {IPSJ Journal},
publisher = {Information Processing Society of Japan},
issn = {1882-7764},
year = {2018},
month = {Feb},
volume = {59},
number = {2},
pages = {633-643},
commented-url = {http://id.nii.ac.jp/1001/00185782},
url = {https://ipsj.ixsq.nii.ac.jp/records/185870},
keywords = {steering, lasso, group selection},
note = {In Japanese},
}
@article{seim2017passivehaptic,
title = {Passive Haptic Training to Improve Speed and Performance on a Keypad},
author = {Seim*, Caitlyn and Doering+, Nick and Zhang+, Yang and Stuerzlinger, Wolfgang and Starner, Thad},
journal = {Proceedings on Interactive, Mobile, Wearable and Ubiquitous Technologies},
publisher = {ACM},
series = {IMWUT},
year = {2017},
month = {Sep},
volume = {1},
number = {3},
articleno = {100},
numpages = {13},
doi = {https://doi.org/10.1145/3132026},
pdf = {papers/passivehapticslearning.pdf},
teaser = {teasers/passivehapticslearning.png},
abstract = {Learning text entry systems is challenging, yet necessary. Many layouts and keyboards exist, but they rely on laborious learning techniques. Passive haptic learning (PHL) has already demonstrated some benefit for learning the Braille text entry system. Could this computing-enabled technique be used to improve desktop keyboard typing skills? It is unknown whether passive haptic training can improve speed on a motor task (as opposed to initial learning). We use a randomized numeric keypad to examine users' typing performance with or without passive haptic training. When users were prevented from looking at the keyboard, the PHL group demonstrated consistent accuracy (-0.011 KSPC) while those in the control group greatly increased their error (+1.26 KSPC on average). This result is consistent with the finding that PHL users looked significantly less at the keyboard. In a second, longer study, users exposed to PHL were found to significantly improve their typing speed (mean increase of 11 WPM) versus control (mean increase of 2.2 WPM).},
keywords = {haptics, learning, text entry},
note = {Ubicomp '17},
}
@article{waese2017eplant,
title = {{ePlant}: Visualizing and Exploring Multiple Levels of Data for Hypothesis Generation in Plant Biology},
author = {Waese*, Jamie and Fan+, Jim and Pasha+, Asher and Yu+, Hans and Fucile, Geoffrey and Shi+, Ian and Cumming+, Matthew and Kelley, Lawrence and Sternberg, Michael and Krishnakumar, Vivek and Ferlanti, Erik and Miller, Jason and Town, Chris and Stuerzlinger, Wolfgang and Provart, Nicholas},
journal = {The Plant Cell},
publisher = {American Society of Plant Biologists},
year = {2017},
month = {Aug},
volume = {29},
number = {8},
pages = {1806-1821},
doi = {https://doi.org/10.1105/tpc.17.00073},
url = {http://bar.utoronto.ca/eplant},
pdf = {papers/eplant.pdf},
teaser = {teasers/eplant.png},
abstract = {A big challenge in current systems biology research arises when different types of data must be accessed from separate sources and visualized using separate tools. The high cognitive load required to navigate such a workflow is detrimental to hypothesis generation. Accordingly, there is a need for a robust research platform that incorporates all data and provides integrated search, analysis, and visualization features through a single portal. Here, we present ePlant (http://bar.utoronto.ca/eplant), a visual analytic tool for exploring multiple levels of Arabidopsis thaliana data through a zoomable user interface. ePlant connects to several publicly available web services to download genome, proteome, interactome, transcriptome, and 3D molecular structure data for one or more genes or gene products of interest. Data are displayed with a set of visualization tools that are presented using a conceptual hierarchy from big to small, and many of the tools combine information from more than one data type. We describe the development of ePlant in this article and present several examples illustrating its integrative features for hypothesis generation. We also describe the process of deploying ePlant as an "app" on Araport. Building on readily available web services, the code for ePlant is freely available for any other biological species research.},
keywords = {visualization, visual analytics},
}
@comment{c, c={not sure if this is best article or proceedings}}
@article{dwyer2016dagstuhl,
title = {Immersive Analytics (Dagstuhl Seminar 16231)},
author = {Dwyer, Tim and Henry Riche, Nathalie and Klein, Karsten and Stuerzlinger, Wolfgang and Thomas, Bruce H.},
journal = {Dagstuhl Reports},
publisher = {Schloss Dagstuhl-Leibniz-Zentrum fuer Informatik},
commented-series = {Dagstuhl Seminar 16231},
issn = {2192-5283},
year = {2016},
month = {Nov},
volume = {6},
number = {6},
pages = {1-9},
doi = {https://doi.org/10.4230/DagRep.6.6.1},
pdf = {papers/dagstuhl_IA.pdf},
teaser = {teasers/dagstuhl.png},
abstract = {This report documents the program and the outcomes of Dagstuhl Seminar 16231 "Immersive Analytics". Close to 40 researchers and practitioners participated in this seminar to discuss and define the field of Immersive Analytics, to create a community around it, and to identify its research challenges. As the participants had a diverse background in a variety of disciplines, including Human-Computer-Interaction, Augmented and Virtual Reality, Information Visualization, and Visual Analytics, the seminar featured a couple of survey talks on the first days, followed by plenary and working group discussions that were meant to shape the field of Immersive Analytics. As an outcome, a book publication is planned with book chapters provided by the participants.},
keywords = {visual analytics, visualization, immersive analytics},
}
@article{liang2013investigation,
title = {An Investigation of Suitable Interactions for {3D} Manipulation of Distant Objects Through a Mobile Device},
author = {Liang, Hai-Ning and Williams*, Cary and Semegen, Myron and Stuerzlinger, Wolfgang and Irani, Pourang},
journal = {International Journal on Innovative Computing, Information and Control},
issn = {1349-4198},
year = {2013},
month = {Dec},
volume = {9},
number = {12},
pages = {4737-4752},
url = {http://www.ijicic.org/vol-9(12).htm},
pdf = {papers/dualsurface2.pdf},
teaser = {teasers/dualsurface2.png},
abstract = {In this paper, we present our research linking two types of technologies that are gaining importance: mobile devices and large displays. Mobile devices now come integrated with a variety of sophisticated sensors, including multi-touch displays, gyroscopes and accelerometers, which allow them to capture rich varieties of gestures and make them ideal to be used as input devices to interact with an external display. In this research we explore what types of sensors are easy and intuitive to use to support people's exploration of 3D objects shown in large displays located at a distance. To conduct our research we have developed a device with two multi-touch displays, one on its front and the other in the back, and motion sensors. We then conducted an exploratory study in which we asked participants to provide interactions that they believe are easy and natural to perform operations with 3D objects. We have aggregated the results and found some common patterns about users' preferred input sensors and common interactions. In this paper we report the findings of the study and describe a new interface whose design is informed by the results.},
keywords = {3D manipulation, docking, mobile device},
}
@article{pintilie2013evaluation,
title = {An Evaluation of Interactive and Automated Next-best View Methods in {3D} Scanning},
author = {Pintilie*, Grigori D. and Stuerzlinger, Wolfgang},
journal = {Computer-Aided Design and Applications},
year = {2013},
month = {Mar},
volume = {10},
number = {2},
pages = {279-291},
doi = {https://doi.org/10.3722/cadaps.2013.279-291},
pdf = {papers/scanUI.pdf},
teaser = {teasers/scanUI.png},
abstract = {Scanning of objects to produce 3D models is becoming more commonplace as the required hardware is becoming less expensive and more widely attainable. The process involves obtaining scans of multiple views so as to create a complete 3D model. This is typically a user-driven process, and an analysis of the difficulty of this task, use of automation, visualization methods, and their effect on the final result has not yet been thoroughly investigated. In this paper we report on a user study related to 3D scanning in which the user is asked to use a simulated, somewhat simplified 3D scanner with a simple user interface. Our investigation focuses on scanning the complete surface of an object with decent sampling density, but does not take all sampling issues, such as reflections, into account. We evaluate different visualization methods, which aim to help the user complete or improve scans, and compare the results obtained by participants to those obtained using an automated approach. The results show that users can easily obtain complete scans or improve existing scans using this simple interface, and that different visualization methods are more or less equally effective; moreover, user performance is on par with automated scanning methods.},
keywords = {3D scanning, next-best view},
}
@article{mcarthur2010examining,
title = {Comparing {3D} Content Creation Interfaces in Two Virtual Worlds: World of Warcraft and Second Life},
author = {{McArthur}*, Victoria and Teather*, Robert J. and Stuerzlinger, Wolfgang},
journal = {Journal of Gaming & Virtual Worlds},
year = {2010},
month = {Dec},
volume = {2},
number = {3},
pages = {239-258},
doi = {https://doi.org/10.1386/jgvw.2.3.239_1},
pdf = {papers/3dui4virtualworldcreation.pdf},
teaser = {teasers/3dui4virtualworldcreation.png},
abstract = {In this article we compare the content creation systems of two popular virtual worlds: World of Warcraft and Second Life. We then discuss recommendations for 3D content creation systems based on current trends in 3D user interface research. We hypothesize that by designing 3D content creation systems that follow these recommendations, virtual world economies based on custom content creation (e.g., Second Life) may be transformed, as more people will be able to create and modify content.},
keywords = {3D modeling},
}
@article{bowman20083dui,
title = {{3D} User Interfaces: New Directions and New Perspectives},
author = {Bowman, Doug and Coquillart, Sabine and Fröhlich, Bernd and Hirose, Michitaka and Kitamura, Yoshifumi and Kiyokawa, Kiyoshi and Stuerzlinger, Wolfgang},
journal = {Computer Graphics & Applications},
publisher = {IEEE},
series = {CG&A},
year = {2008},
month = {Nov},
volume = {28},
number = {6},
pages = {20-36},
doi = {https://doi.org/10.1109/MCG.2008.109},
pdf = {papers/newdirections3dui.pdf},
abstract = {Three-dimensional user interfaces (3D UIs) allow users to interact with virtual objects, environments, or information using direct 3D input in the physical and/or virtual space. With the advent of systems like the Nintendo Wii, 3D UIs have entered the mainstream. Thus, research on 3D UIs is more relevant than ever. In this article, the founders and organizers of the IEEE Symposium on 3D User Interfaces reflect on the current state-of-the-art in several key aspects of 3D UIs, and speculate on future research directions for 3D UIs as well.},
keywords = {3D user interfaces},
}
@article{stuerzlinger2006covid,
title = {The Design and Realization of {CoViD}: A System for Collaborative Virtual {3D} Design},
author = {Stuerzlinger, Wolfgang and Zaman*, Loutfouz and Pavlovych*, Andriy and Oh*, Ji-Young},
journal = {Virtual Reality},
publisher = {Springer},
year = {2006},
month = {Oct},
volume = {10},
number = {2},
pages = {135-147},
doi = {https://doi.org/10.1007/s10055-006-0048-0},
pdf = {papers/covid.pdf},
teaser = {teasers/covid.png},
abstract = {Many important decisions in the design process are made fairly early on, after designers have presented initial concepts. In many domains, these concepts are already realized as 3D digital models. Then, in a meeting, the stakeholders for the project get together and evaluate these potential solutions. Frequently, the participants in this meeting want to interactively modify the proposed 3D designs to explore the design space better. Today's systems and tools do not support this, as computer systems typically support only a single user and computer-aided design tools require significant training.
This paper presents the design of a new system to facilitate a collaborative 3D design process. First, we discuss a set of guidelines which have been introduced by others and that are relevant to collaborative 3D design systems. Then, we introduce the new system, which consists of two main parts. The first part is an easy-to-use conceptual 3D design tool that can be used productively even by naive users. The tool provides novel interaction techniques that support important properties of conceptual design. The user interface is non-obtrusive, easy-to-learn, and supports rapid creation and modification of 3D models. The second part is a novel infrastructure for collaborative work, which offers an interactive table and several large interactive displays in a semi-immersive setup. It is designed to support multiple users working together. This infrastructure also includes novel pointing devices that work both as a stylus and a remote pointing device. The combination of the (modified) design tool with the collaborative infrastructure forms a new platform for collaborative virtual 3D design. Then, we present an evaluation of the system against the guidelines for collaborative 3D design. Finally, we present results of a preliminary user study, which asked naive users to collaborate in a 3D design task on the new system.},
keywords = {3D modeling, collaboration, design},
}
@article{vorozcovs2006hedgehog,
title = {The Hedgehog: A Novel Optical Tracking Method for Spatially Immersive Displays},
author = {Vorozcovs*, Andrew and Stuerzlinger, Wolfgang and Hogue*, Andrew and Allison, Robert},
journal = {Presence: Teleoperators & Virtual Environments},
year = {2006},
month = {Feb},
volume = {15},
number = {1},
pages = {108-121},
doi = {https://doi.org/10.1162/pres.2006.15.1.108},
pdf = {papers/hedgehog2.pdf},
teaser = {teasers/hedgehog2.png},
abstract = {Existing commercial technologies do not adequately meet the requirements for tracking in fully-enclosed Virtual Reality displays. We present a novel six degree of freedom tracking system, the Hedgehog, which overcomes several limitations inherent in existing sensors and tracking technology. The system reliably estimates the pose of the user's head with high resolution and low spatial distortion. Light emitted from an arrangement of lasers projects onto the display walls. An arrangement of cameras images the walls and the two-dimensional centroids of the projections are tracked to estimate the pose of the device. The system is able to handle ambiguous laser projection configurations, static and dynamic occlusions of the lasers, and incorporates an auto-calibration mechanism due to the use of the SCAAT (Single Constraint At A Time) algorithm. A prototype system was evaluated relative to a state-of-the-art motion tracker and showed comparable positional accuracy (1-2 mm RMS) and significantly better absolute angular accuracy (0.1 deg RMS).},
keywords = {3D tracking},
}
@article{seetzen2004hdrdisplay,
title = {High Dynamic Range Display Systems},
author = {Seetzen*, Helge and Heidrich, Wolfgang and Stuerzlinger, Wolfgang and Ward, Greg and Whitehead, Lorne and Trentacoste*, Matthew and Ghosh*, Abhijeet and Vorozcovs*, Andrew},
journal = {Transactions on Graphics},
publisher = {ACM},
series = {TOG},
year = {2004},
month = {Aug},
volume = {23},
number = {3},
pages = {760-768},
doi = {https://doi.org/10.1145/1015706.1015797},
pdf = {papers/hdrdisplays.pdf},
teaser = {teasers/hdrdisplays.png},
abstract = {The dynamic range of many real-world environments exceeds the capabilities of current display technology by several orders of magnitude. In this paper we discuss the design of two different display systems that are capable of displaying images with a dynamic range much more similar to that encountered in the real world. The first display system is based on a combination of an LCD panel and a DLP projector, and can be built from off-the-shelf components. While this design is feasible in a lab setting, the second display system, which relies on a custom-built LED panel instead of the projector, is more suitable for usual office workspaces and commercial applications. We describe the design of both systems as well as the software issues that arise. We also discuss the advantages and disadvantages of the two designs and potential applications for both systems.},
keywords = {high dynamic range, display},
note = {SIGGRAPH '04},
}
@article{oh2004conceptual,
title = {A System for Desktop Conceptual {3D} Design},
author = {Oh*, Ji-Young and Stuerzlinger, Wolfgang},
journal = {Virtual Reality},
publisher = {Springer},
year = {2004},
month = {Jun},
volume = {7},
number = {3-4},
pages = {198-211},
doi = {https://doi.org/10.1007/s10055-004-0128-y},
pdf = {papers/virtuallegodraft.pdf},
teaser = {teasers/virtuallego.png},
abstract = {In the traditional design process for a 3D environment, people usually depict a rough prototype to verify their ideas, and iteratively modify its configuration until they are satisfied with the general layout. In this activity, one of the main operations is the rearrangement of single and composite parts of a scene. With current desktop virtual reality (VR) systems, the selection and manipulation of arbitrary objects in 3D is still difficult. In this work, we present new and efficient techniques that allow even novice users to perform meaningful rearrangement tasks with traditional input devices. The results of our work show that the presented techniques can be mastered quickly and enable users to perform complex tasks on composite objects. Moreover, the system is easy to learn, supports creativity, and is fun to use.},
keywords = {3D modeling, 3D manipulation, 3D positioning, content creation, design},
}
@article{parilov2002perpixel,
title = {Per-pixel divisions},
author = {Parilov*, Sergey and Stuerzlinger, Wolfgang},
journal = {Journal of Graphics Tools},
series = {JGT},
year = {2002},
month = {Jun},
volume = {7},
number = {4},
pages = {53-59},
doi = {https://doi.org/10.1080/10867651.2002.10487572},
pdf = {papers/divisions.pdf},
abstract = {We describe a method to perform per-pixel divisions using graphics hardware, with a simple iterative algorithm. In the worst case, the number of rendering passes is 17 for approximate divisions, and 18 for accurate divisions. The algorithm can be used for 3D vector normalization, evaluating complex lighting models, and image reconstruction.},
keywords = {rendering, real-time},
}
@article{parilov2002layered,
title = {Layered Relief Textures},
author = {Parilov*, Sergey and Stuerzlinger, Wolfgang},
journal = {Journal of WSCG},
issn = {1213-6972},
year = {2002},
month = {Feb},
volume = {10},
number = {2},
pages = {357-364},
url = {http://wscg.zcu.cz/wscg2002/Papers_2002/F87.pdf},
pdf = {papers/lrt.pdf},
teaser = {teasers/lrt.png},
abstract = {In this paper we present an Image-Based Rendering method for post-warping LDI's in real-time on existing systems. The algorithm performs accurate splatting at low computational costs, reduces memory-access bottlenecks, enables us to trade-off the quality for the speed, and is simple to implement.},
keywords = {rendering, real-time, image-based},
note = {WSCG '02},
}
@article{elinas2000realtime,
title = {Real-time Rendering of {3D} Clouds},
author = {Elinas*, Pantelis and Stuerzlinger, Wolfgang},
journal = {Journal of Graphics Tools},
series = {JGT},
year = {2000},
month = {Jul},
volume = {5},
number = {4},
pages = {33-45},
doi = {https://doi.org/10.1080/10867651.2000.10487531},
pdf = {papers/clouds.pdf},
teaser = {teasers/clouds.png},
abstract = {The visual realism of a computer graphics simulation of outdoor scenery is greatly enhanced by realistic display of clouds. In this paper, we present an algorithm based on Gardner's work that can render perspectively correct 3D clouds in real-time on current graphics hardware. The use of 3D ellipsoids as primitives permits even close-ups without the viewer noticing the approximation. We describe an implementation using OpenGL.},
keywords = {rendering, real-time, image-based},
}
@article{stuerzlinger1998raytracing,
title = {Ray-Tracing Triangular Trimmed Free-Form Surfaces},
author = {Stürzlinger, Wolfgang},
journal = {Transactions on Visualization and Computer Graphics},
publisher = {IEEE},
series = {TVCG},
year = {1998},
month = {Jul},
volume = {4},
number = {3},
pages = {202-214},
doi = {https://doi.org/10.1109/2945.722295},
pdf = {papers/rtttffs.pdf},
teaser = {teasers/rtttffs.png},
abstract = {This paper presents a new approach to rendering triangular algebraic free form surfaces. A hierarchical subdivision of the surface with associated tight bounding volumes provides for quick identification of the surface regions likely to be hit by a ray. For each leaf of the hierarchy an approximation to the corresponding surface region is stored. The approximation is used to compute a good starting point for the iteration, which ensures rapid convergence.
Trimming curves are described by a tree of trimming primitives such as squares, circles, polygons and free form curves combined with Boolean operations. For trimmed surfaces an irregular adaptive subdivision is constructed to quickly eliminate all parts outside the trimming curve from consideration during rendering. Cost heuristics are introduced to optimize the rendering time further.},
keywords = {rendering, ray tracing},
}
@comment{c, c={unfortunate-dup, because paper selected by conference for journal, but conference proceedings later also reclassified as journal by publisher}}
@article{stuerzlinger1998calculating,
title = {Calculating Global Illumination for Glossy Surfaces},
author = {Stürzlinger, Wolfgang},
journal = {Computers & Graphics},
publisher = {Elsevier},
series = {C&G},
year = {1998},
month = {Mar},
volume = {22},
number = {2-3},
pages = {175-180},
doi = {https://doi.org/10.1016/S0097-8493(98)00004-1},
pdf = {papers/calcglos.pdf},
teaser = {teasers/calcglos.png},
abstract = {Photorealistic rendering is used to generate views of computer stored scenes. Global illumination algorithms take all transfers of light in the scene into account thereby creating a realistic looking image. Previously several approaches have been presented which are able to deal with global illumination for diffuse surfaces. More general surfaces are handled only by few methods.
This work presents a new algorithm for the generation of photorealistic images for scenes with arbitrary surfaces. Initially particle tracing and a reconstruction phase are used to obtain a good approximation to the directionally dependent illumination in the scene. The illumination information is stored and can be used subsequently to generate images from different viewpoints directly from the stored solution. The whole system is structured into several independent phases and is designed to allow parallel processing and incremental refinement.},
keywords = {rendering, global illumination},
}
@comment{c, c={unfortunate-dup, because conference proceedings later reclassified as journal volume by WSCG}}
@article{stuerzlinger1997optimized,
title = {Global Illumination with Glossy Surfaces},
author = {Stürzlinger, Wolfgang},
journal = {Journal of WSCG},
issn = {1213-6972},
year = {1997},
month = {Feb},
volume = {5},
number = {3},
pages = {543-551},
url = {http://wscg.zcu.cz/wscg1997/papers97/Stuerzlinger_97.pdf},
pdf = {papers/glossyill.pdf},
teaser = {teasers/glossyill.png},
abstract = {Photorealistic rendering is used to generate views of computer stored scenes. Global illumination algorithms take all transfers of light in the scene into account thereby creating a realistic looking image. Previously several approaches have been presented which are able to deal with global illumination for diffuse surfaces. More general surfaces are handled only by few methods.
This work presents a new algorithm for the generation of photorealistic images for scenes with arbitrary surfaces. Initially particle tracing and a reconstruction phase are used to obtain a good approximation to the directionally dependent illumination in the scene. The illumination information is stored and can be used subsequently to generate images from different viewpoints directly from the stored solution. The whole system is structured into several independent phases and is designed to allow parallel processing and incremental refinement.},
keywords = {rendering, global illumination},
note = {WSCG '97},
footnote = {Conference proceedings later republished as journal volume by publisher},
}
@article{schaufler_stuerzlinger1996three,
title = {Three Dimensional Image Cache for Virtual Reality},
author = {Schaufler*, Gernot and Stürzlinger, Wolfgang},
journal = {Computer Graphics Forum},
year = {1996},
month = {Aug},
volume = {15},
number = {3},
pages = {227-235},
doi = {https://doi.org/10.1111/1467-8659.1530227},
commented-url = {http://www.gup.uni-linz.ac.at:8001/staff/schaufler/papers/octimp},
pdf = {papers/octimp.pdf},
teaser = {teasers/octimp.png},
abstract = {Despite recent advances in rendering hardware, large and complex virtual environments cannot be displayed with a sufficiently high frame rate, because of limitations in the available rendering performance. This paper presents a new approach of software accelerated rendering which draws from the concepts of impostors, hierarchical scene subdivision and levels of detail. So far software optimization in real-time rendering has merely considered individual objects. This work is actually optimizing the rendering of the whole virtual environment by implementing a three dimensional image cache. It speeds up rendering for large portions of the scene by exploiting the coherence inherent in any smooth frame sequence. The implementation of the three dimensional image cache is discussed and the savings in rendering load achievable on a suitable hardware platform are presented.},
keywords = {rendering, real-time},
award = {This work received a Günther Enderle award for Best Technical Paper},
note = {Eurographics '96},
footnote = {A co-evolution with "Hierarchical image caching for accelerated walkthroughs of complex environments", https://doi.org/10.1145/237170.237209},
}
@comment{c, c={conference proceedings later reclassified as journal volume by publisher}}
@article{stuerzlinger1996optimized,
title = {Optimized Local Pass Using Importance Sampling},
author = {Stürzlinger, Wolfgang},
journal = {Journal of WSCG},
issn = {1213-6972},
year = {1996},
month = {Feb},
volume = {4},
number = {2},
pages = {342-349},
url = {http://wscg.zcu.cz/wscg1996/papers96/Stuerzlinger_96.pdf},
pdf = {papers/localpass.pdf},
teaser = {teasers/localpass.png},
abstract = {Recent approaches to realistic image synthesis split the rendering process into two passes. The first pass calculates an approximate global illumination solution, the second produces an image of high quality (from a user selected view point) using the solution obtained in the first pass by applying the local illumination model to each surface point visible through each pixel.
This paper presents two new methods to compute the local illumination quickly. Instead of recalculating form factors and visibilities the information computed by a hierarchical radiosity solution algorithm is reused. The image generation time is reduced significantly by using stochastic methods.},
keywords = {rendering, global illumination},
note = {WSCG '96},
footnote = {Conference proceedings later republished as journal volume by publisher},
}
@comment{c, c={conference proceedings later reclassified as journal volume by publisher}}
@article{stuerzlinger1994parallel,
title = {Parallel Progressive Radiosity with Parallel Visibility Computations},
author = {Stürzlinger, Wolfgang and Wild*, Christoph},
journal = {Journal of WSCG},
issn = {1213-6972},
year = {1994},
month = {Feb},
volume = {2},
number = {1},
pages = {66-74},
url = {http://wscg.zcu.cz/wscg1994/papers94/Stuerzlinger_Wild_94.pdf},
pdf = {papers/parrad.pdf},
teaser = {teasers/parrad.png},
abstract = {The radiosity method models the interaction of light between diffuse reflecting surfaces, thereby accurately predicting global illumination effects. Due to the high computational effort to calculate the transfer of light between surfaces and the memory requirements for the scene description, a distributed, parallelized version of the algorithm is needed for scenes consisting of thousands of surfaces. We present a distributed, parallel radiosity algorithm, which can subdivide the surfaces adaptively. Additionally we present a scheme for parallel visibility calculations. Adaptive load redistribution is also discussed.},
keywords = {rendering, global illumination, parallel, visibility},
note = {WSCG '94},
footnote = {Conference proceedings later republished as journal volume by publisher},
}
@comment{c, c={leave the "_stuerzlinger" in the ID to enable umlaut-free search!}}
@article{barth_stuerzlinger1993efficient,
title = {Efficient Ray Tracing for Bezier and B-Spline Surfaces},
author = {Barth, Wilhem and Stürzlinger, Wolfgang},
journal = {Computers & Graphics},
publisher = {Elsevier},
series = {C&G},
year = {1993},
month = {Jul},
volume = {17},
number = {4},
pages = {423-430},
doi = {https://doi.org/10.1016/0097-8493(93)90031-4},
pdf = {papers/rtbez.pdf},
teaser = {teasers/rtbez.png},
abstract = {Generating realistic pictures by raytracing requires intersecting the objects with many rays (1~ million or more). With Bezier or B-Spline surfaces as objects the intersections must be calculated by an iterative method. This paper describes an algorithm which performs these calculations efficiently. In a preprocessing step the surface is subdivided adaptively into parts and a tight enclosure is calculated for each part. We selected parallelepipeds (first order approximations) as enclosures, their orientation and the angles between their edges are chosen in such a way that they enclose the respective part as tightly as possible, they are not rectangular in general. A binary tree built with these enclosures allows to test very fast which parts of the surface may be hit by a given ray. The leaves of the tree contain small, almost plane parts of the surface. For each part a linear approximation is calculated, this is a parallelogram, in general not rectangular. For each ray which hits the enclosure the intersection with this approximation is calculated first, yielding an accurate starting point for the following iteration.},
keywords = {rendering, ray tracing},
}
@comment{************************articles_in_books************************}
@inbook{seetzen2023hdrdisplay,
title = {High Dynamic Range Display Systems},
author = {Seetzen*, Helge and Heidrich, Wolfgang and Stuerzlinger, Wolfgang and Ward, Greg and Whitehead, Lorne and Trentacoste*, Matthew and Ghosh*, Abhijeet and Vorozcovs*, Andrew},
booktitle = {Seminal Graphics Papers: Pushing the Boundaries},
publisher = {ACM},
year = {2023},
month = {Aug},
volume = {2},
articleno = {5},
numpages = {9},
edition = {1},
doi = {https://doi.org/10.1145/3596711.3596717},
pdf = {papers/hdrdisplays2.pdf},
teaser = {teasers/hdrdisplays.png},
abstract = {The dynamic range of many real-world environments exceeds the capabilities of current display technology by several orders of magnitude. In this paper we discuss the design of two different display systems that are capable of displaying images with a dynamic range much more similar to that encountered in the real world. The first display system is based on a combination of an LCD panel and a DLP projector, and can be built from off-the-shelf components. While this design is feasible in a lab setting, the second display system, which relies on a custom-built LED panel instead of the projector, is more suitable for usual office workspaces and commercial applications. We describe the design of both systems as well as the software issues that arise. We also discuss the advantages and disadvantages of the two designs and potential applications for both systems.},
keywords = {high dynamic range, display},
note = {Republished by ACM},
}
@inbook{batmaz2022rotposjitter,
title = {Rotational and Positional Jitter in Virtual Reality Interaction},
author = {Batmaz, Anil Ufuk and Stuerzlinger, Wolfgang},
booktitle = {Everyday Virtual Reality},
publisher = {Springer},
year = {2022},
month = {May},
pages = {89–118},
doi = {https://doi.org/10.1007/978-3-031-05804-2_4},
pdf = {papers/rotposjitter.pdf},
teaser = {teasers/rotposjitter.png},
abstract = {One of the elements that affect 3D tracking performance in Virtual Reality (VR) systems is fluctuations in the signal, called jitter, which occurs regardless of the sensor technology used. In real-life VR systems, positional and rotational jitter can be found in all tracked objects, including the headset, controllers, or other trackers. Previous work had identified that ±0.5° rotational jitter negatively affects user performance for distal pointing. Yet, they also found that even using a second controller to reduce the “Heisenberg effect” introduced by the button press does not address the problem completely. Moreover, with jitter on the position of a virtual object, user performance significantly decreases with jitter above one fourth of the size of that virtual object. Still, users preferred to have positional jitter on a virtual target rather than rotational jitter on a VR controller. In this paper, we extended the previous literature by conducting a user study on angular jitter with controllers held with two different grip styles and targets at two different depth distances. The results revealed that user performance decreases (already) with ±0.25° jitter. Thus, we suggest that practitioners/developers who design 3D user interfaces, controllers, and interaction techniques for daily 3D VR usage should focus on reducing jitter. Decreasing jitter not only improves user performance, but also decreases frustration, which improves the user experience.},
keywords = {3D pointing, mid-air, jitter},
}
@inbook{dwyer2018immersive,
title = {Immersive analytics: An Introduction},
author = {Dwyer, Tim and Marriott, Kim and Isenberg, Tobias and Klein, Karsten and Riche, Nathalie and Schreiber, Falk and Stuerzlinger, Wolfgang and Thomas, Bruce H.},
booktitle = {Immersive Analytics},
publisher = {Springer},
year = {2018},
month = {Oct},
volume = {LNCS 11190},
pages = {1-23},
doi = {https://doi.org/10.1007/978-3-030-01388-2_1},
pdf = {papers/IAchapter1_Intro.pdf},
teaser = {teasers/iabook.png},
abstract = {Immersive Analytics is a new research initiative that aims to remove barriers between people, their data and the tools they use for analysis and decision making. Here we clarify the aims of immersive analytics research, its opportunities and historical context, as well as providing a broad research agenda for the field. In addition, we review how the term immersion has been used to refer to both technological and psychological immersion, both of which are central to immersive analytics research.},
keywords = {immersive analytics, visualization, visual analytics},
}
@inbook{marriott2018immersive,
title = {Immersive Analytics: Time to Reconsider the Value of {3D} for Information Visualisation},
author = {Marriott, Kim and Chen, Jian and Hlawatsch, Marcel and Itoh, Takayuki and Nacenta, Miguel A. and Reina, Guido and Stuerzlinger, Wolfgang},
booktitle = {Immersive Analytics},
publisher = {Springer},
year = {2018},
month = {Oct},
volume = {LNCS 11190},
pages = {25-55},
doi = {https://doi.org/10.1007/978-3-030-01388-2_2},
pdf = {papers/IAchapter2_3DVis.pdf},
teaser = {teasers/iabook.png},
abstract = {Modern virtual reality display technologies engender spatial immersion by using a variety of depth cues such as perspective and head-tracked binocular presentation to create visually realistic 3D worlds. While 3D visualisations are common in scientific visualisation, they are much less common in information visualisation. In this chapter we explore whether immersive analytic applications should continue to use traditional 2D information visualisations or whether there are situations when 3D may offer benefits. We identify a number of potential applications of 3D depth cues for abstract data visualisation: using depth to show an additional data dimension, such as in 2.5D network layouts, views on non-flat surfaces and egocentric views in which the data is placed around the viewer, and visualising abstract data with a spatial embedding. Another important potential benefit is the ability to arrange multiple views in the 3D space around the user and to attach abstract visualisations to objects in the real world.},
keywords = {immersive analytics, visual analytics, 3D visualization},
}
@inbook{bueschel2018interaction,
title = {Interaction for Immersive Analytics},
author = {Büschel, Wolfgang and Chen, Jian and Dachselt, Raimund and Drucker, Steven and Dwyer, Tim and Görg, Carsten and Isenberg, Tobias and Kerren, Andreas and North, Chris and Stuerzlinger, Wolfgang},
booktitle = {Immersive Analytics},
publisher = {Springer},
year = {2018},
month = {Oct},
volume = {LNCS 11190},
pages = {95-138},
doi = {https://doi.org/10.1007/978-3-030-01388-2_4},
pdf = {papers/IAchapter4_Interaction.pdf},
teaser = {teasers/iabook.png},
abstract = {In this chapter, we briefly review the development of natural user interfaces and discuss their role in providing human-computer interaction that is immersive in various ways. Then we examine some opportunities for how these technologies might be used to better support data analysis tasks. Specifically, we review and suggest some interaction design guidelines for immersive analytics. We also review some hardware setups for data visualization that are already archetypal. Finally, we look at some emerging system designs that suggest future directions.},
keywords = {immersive analytics, visualization, visual analytics},
}
@inbook{stuerzlinger2018immersive,
title = {Immersive human-centered computational analytics},
author = {Stuerzlinger, Wolfgang and Dwyer, Tim and Drucker, Steven and Görg, Carsten and North, Chris and Scheuermann, Gerik},
booktitle = {Immersive Analytics},
publisher = {Springer},
year = {2018},
month = {Oct},
volume = {LNCS 11190},
pages = {139-163},
doi = {https://doi.org/10.1007/978-3-030-01388-2_5},
pdf = {papers/IAchapter5_humancentered.pdf},
teaser = {teasers/iabook.png},
abstract = {In this chapter we seek to elevate the role of the human in human-machine cooperative analysis through a careful consideration of immersive design principles. We consider both strategic immersion through more accessible systems as well as enhanced understanding and control through immersive interfaces that enable rapid workflows. We extend the classic sensemaking loop from visual analytics to incorporate multiple views, scenarios, people, and computational agents. We consider both sides of machine/human collaboration: allowing the human to more fluidly control the machine process; and also allowing the human to understand the results, derive insights and continue the analytic cycle. We also consider system and algorithmic implications of enabling real-time control and feedback in immersive human-centered computational analytics.},
keywords = {immersive analytics, visualization, visual analytics, collaboration},
}
@inbook{marriott2018just,
title = {Just 5 Questions: Toward a Design Framework for Immersive Analytics},
author = {Marriott, Kim and Chen, Jian and Hlawatsch, Marcel and Itoh, Takayuki and Nacenta, Miguel A. and Reina, Guido and Stuerzlinger, Wolfgang},
booktitle = {Immersive Analytics},
publisher = {Springer},
year = {2018},
month = {Oct},
volume = {LNCS 11190},
pages = {259-288},
doi = {https://doi.org/10.1007/978-3-030-01388-2_9},
pdf = {papers/IAchapter9_5Questions.pdf},
teaser = {teasers/iabook.png},
abstract = {We present an initial design framework for immersive analytics based on Brehmer and Munzner's "What-Why-How" data visualisation framework. We extend their framework to take into account Who are the people or teams of people who are going to use the system, and Where is the system to be used and what are the available devices and technology. In addition, the How component is extended to cater for collaboration, multisensory presentation, interaction with an underlying computational model, degree of fidelity and organisation of the workspace around the user. By doing so we provide a framework for understanding immersive analytics research and applications as well as clarifying how immersive analytics differs from traditional data visualisation and visual analytics.},
keywords = {immersive analytics, visualization, visual analytics},
}
@inbook{stuerzlinger2014considerations,
title = {Considerations for Targets in {3D} Pointing Experiments},
author = {Stuerzlinger, Wolfgang and Teather*, Robert J.},
booktitle = {{HCI} Korea},
series = {HCIK '15},
year = {2014},
commented-year = {2015},
month = {Dec},
commented-month = {Jan},
pages = {162–168},
url = {https://dl.acm.org/doi/abs/10.5555/2729485.2729510},
pdf = {papers/considerations.pdf},
teaser = {teasers/considerations.png},
abstract = {We identify various tradeoffs in the design of 3D pointing experiments based on Fitts' law and the ISO9241-9 methodology. The advantages and disadvantages of several approaches for such experiments are analyzed and compared against each other. Results of an experiment that investigates various visual aids are presented as evidence. We conclude with recommendations for 3D pointing experiments and avenues of future work.},
keywords = {3D pointing},
}
@inbook{stuerzlinger2011value,
title = {The Value of Constraints for {3D} User Interfaces},
author = {Stuerzlinger, Wolfgang and Wingrave*, Chad},
booktitle = {Virtual Realities},
publisher = {Springer},
year = {2011},
month = {Jan},
pages = {203-224},
doi = {https://doi.org/10.1007/978-3-211-99178-7_11},
pdf = {papers/valueconstraints.pdf},
abstract = {User interfaces to three-dimensional environments are becoming more and more popular. Today this trend is fuelled through the introduction of social communication via virtual worlds, console and computer games, as well as 3D televisions.
We present a synopsis of the relevant abilities and restrictions introduced by both input and output technologies, as well as an overview of related human capabilities and limitations, including perceptual and cognitive issues. Partially based on this, we present a set of guidelines for 3D user interfaces. These guidelines are intended for developers of interactive 3D systems, such as computer and console games, 3D modeling packages, augmented reality systems, computer aided design systems, and virtual environments. The guidelines promote techniques, such as using appropriate constraints, that have been shown to work well in these types of environments.},
keywords = {3D user interfaces, constraints},
}
@comment{************************conference_articles************************}
@inproceedings{gemici2026crossingrealities,
title = {Crossing Realities Has a Cost: Evaluating AR Second Screens for AI-Assisted Desktop Authoring},
author = {Gemici*, Mucahit and Bashar*, Mohammad Raihanul and Stuerzlinger, Wolfgang and Phadnis, Vrushank and Batmaz, Anil Ufuk},
booktitle = {Symposium on Spatial User Interaction},
publisher = {ACM},
series = {SUI '26},
year = {2026},
month = {Oct},
commented-articleno = {2},
numpages = {12},
commented-doi = {https://doi.org/10.1145/00000.00000},
commented-pdf = {papers/crossingrealities.pdf},
commented-teaser = {teasers/crossingrealities.png},
abstract = {AI-assisted authoring requires users to frequently exchange user-generated and AI-generated content between a primary workspace and a Large Language Model (LLM) assistant. Such repetitive actions can fragment attention and compete for limited display space. While Augmented Reality (AR) has been proposed as a way to extend desktop workspaces with virtual displays, just adding a spatial display area does not address the repeated attention shifts, input-focus changes, and content-transfer steps required in LLM-assisted workflows. This creates a gap in understanding whether AR second screens support such workflows or introduce cross-reality transition costs that limit their effectiveness. To investigate this gap, we designed an AR-Second-Screen system around a unified keyboard-and-mouse interaction model and evaluated it against Single-Screen and Dual-Screen desktop setups. Results show that Dual-Screen remained more efficient than AR-Second-Screen, with significantly lower task completion time and switching cost. AR-Second-Screen also produced higher task and LLM idle ratios, indicating re-engagement costs when users crossed between physical and virtual workspaces. At the same time, participants rated AR positively and preferred it significantly over Single-Screen, with no significant difference in preference compared to Dual-Screen. These findings show that spatially extending AI-assisted workflows into AR can be appealing, yet effective cross-reality interfaces must minimize transition costs rather than just simply adding a virtual display space.},
keywords = {extended reality, LLM, crossing realities},
note = {Conditionally accepted, to appear},
}
@inproceedings{noh2026drattention,
title = {Exploring Diminished Reality for Attention Support: A Co-Design Study with Students with ADHD},
author = {Noh+, Alex and Safikhani+, Audrey and Zhu*, Anjun and Stuerzlinger, Wolfgang and Kim, Lawrence},
booktitle = {Designing Interactive Systems},
publisher = {ACM},
series = {DIS '26},
year = {2026},
month = {Jun},
pages = {891-903},
doi = {https://doi.org/10.1145/3800645.3813095},
pdf = {papers/drattention.pdf},
commented-video = {videos/drattention.mp4},
teaser = {teasers/drattention.png},
abstract = {Diminished Reality (DR) modifies or removes elements of the perceived environment. We explored DR for attention support through diary studies, interviews, and speculative co-design with 15 university students with ADHD. Participants described a persistent gap between intention and attention, and the use of externalization strategies that encounter fundamental limits in physical reality. In co-design, rather than reasoning from visual operations, participants articulated which properties of stimuli they needed to perceive versus filter, revealing cases where visual diminishment does not reliably map to attentional diminishment. We contribute rich descriptive data on the attentional challenges and DR preferences of students with ADHD, and propose Attentional Diminishment, a sensitizing concept that reframes DR for attention support from visual outcomes to attentional effects.},
keywords = {diminished reality, filtered reality, adhd, attention deficit hyperactivity disorder},
}
@inproceedings{amini2026steeringthroughput3d,
title = {Improving Steering Law Throughput Calculation by Defining Effective Parameters in 3D Virtual Environments},
author = {Amini*, Mohammadreza and Stuerzlinger, Wolfgang and Yamanaka, Shota and Liang, Hai-Ning and Batmaz, Anil Ufuk},
booktitle = {Conference on Human Factors in Computing Systems},
publisher = {ACM},
series = {CHI '26},
year = {2026},
month = {Apr},
articleno = {1141},
numpages = {20},
doi = {https://doi.org/10.1145/3772318.3790579},
pdf = {papers/steeringthroughput3d.pdf},
video = {videos/steeringthroughput3d.mp4},
teaser = {teasers/steeringthroughput3d.png},
abstract = {Throughput is a widely used performance metric, combining speed and accuracy into a single measure, while reducing the effect of subjective speed–accuracy trade-offs. Despite its wide application in 2D steering tasks, its direct extension to 3D presents unique challenges since 3D trajectories exhibit higher variability, and perceptual–motor factors undermine existing formulations. Consequently, throughput has not been systematically adopted for evaluating steering in 3D virtual environments. In this paper, using a controlled virtual reality user study with a ring-and-wire task, we introduce and validate a novel throughput formulation for 3D steering based on the bivariate standard deviation of the trajectory for the effective width calculation. Our results show that this formulation provides smoother throughput values across subjective speed–accuracy differences and improves model fit compared to traditional approaches. This work advances our theoretical understanding of the Steering law in 3D contexts, provides researchers and practitioners with a robust evaluation method, and establishes a foundation for future studies of complex 3D trajectory interactions.},
keywords = {3D steering, 3D user interface, 3D interaction, trajectory-based interaction, behavior modeling},
}
@inproceedings{turkmen2026handvis,
title = {Investigating Adaptive Hand Visibilities for Accurate 3D User Interactions in Augmented Reality},
author = {Turkmen*, Rumeysa and Hatira*, Nour and Teather, Robert J and Kersten-Oertel, Marta and Stuerzlinger, Wolfgang and Batmaz, Anil Ufuk},
booktitle = {Conference on Virtual Reality and {3D} User Interfaces Abstracts and Workshops, Workshop on Novel Input Devices and Interaction Techniques at {VR}},
publisher = {IEEE},
series = {NIDIT '26},
year = {2026},
month = {Mar},
pages = {338-343},
doi = {https://doi.org/10.1109/VRW70859.2026.00067},
pdf = {papers/handvis.pdf},
teaser = {teasers/handvis.png},
commented-video = {videos/handvis.mp4},
abstract = {Augmented Reality (AR) tasks that require fine motor control often rely on visual hand representations, yet fully visible hands can introduce occlusion and reduce accuracy. In this work, we investigate adaptive hand visualization techniques that dynamically adjust hand visibility based on the current interaction phase to improve accuracy in AR. We designed an AR-based pedicle screw placement task, in which users insert virtual screws into a physical spine model. To evaluate how hand visualization affects task performance, we conducted a user study with 15 participants who performed the task under five hand visualization conditions: Opaque, Transparent, Invisible, Speed-based and Position-based visibility. Our results show that adaptive visualization techniques significantly improve screw placement accuracy compared to the commonly used opaque hand representation. These findings demonstrate the benefits of dynamically adapting hand visibility can support accuracy-critical interactions.},
keywords = {hand visibility, 3D docking},
}
@inproceedings{zhao2026hybridsthfp,
title = {A User-Friendly Accurate Bare-Handed Manipulation Technique for Distant Objects in Virtual Reality},
author = {Zhao*, Di Bill and Stuerzlinger, Wolfgang},
booktitle = {Conference on Virtual Reality and {3D} User Interfaces Abstracts and Workshops, Workshop on Novel Input Devices and Interaction Techniques at {VR}},
publisher = {IEEE},
series = {NIDIT '26},
year = {2026},
month = {Mar},
pages = {373-378},
doi = {https://doi.org/10.1109/VRW70859.2026.00073},
pdf = {papers/hybridsthfp.pdf},
teaser = {teasers/hybridsthfp.png},
video = {videos/hybridsthfp.mp4},
abstract = {Bare-hand interaction is now common in virtual reality, but does not afford accurate manipulation of distant objects. Prior approaches rely on ray-casting, motion scaling, proxies, or near-field widgets, often trading precision for speed or increasing cognitive and physical demand. We present two bare-hand techniques for distant object manipulation: Scaled Two-Hand Finger-Palm (STHFP), which uses the non-dominant hand as a control surface for precise manipulation, and HYBRID, which combines fast ray-based positioning with two-handed refinement.
Results from our user study comparing STHFP and HYBRID against scaled bare-hand HOMER show that both new techniques significantly improve positional and rotational accuracy while reducing physical workload. While STHFP requires more interaction time, HYBRID achieves a balanced trade-off between speed and precision. Qualitative findings further reveal how constraint-based control and staged workflows shape user strategies and perceived effort. Together, our results demonstrate that leveraging the hand as a control surface can enable accurate, usable, and controller-free manipulation of distant objects in VR.},
keywords = {hand interaction, bare-hand, 3D manipulation, 3D positioning, 3D rotation, 3D pose},
}
@inproceedings{liu2026scaledmouse,
title = {Scaled Mouse: An Efficient and Accurate Interaction Technique for 3D Docking in Seated VR},
author = {Liu*, Xinpeng and Zhao*, Di Bill and Stuerzlinger, Wolfgang},
booktitle = {Conference on Virtual Reality and {3D} User Interfaces},
publisher = {IEEE},
series = {VR '26},
year = {2026},
month = {Mar},
pages = {718-728},
doi = {https://doi.org/10.1109/VR67842.2026.00091},
pdf = {papers/scaledmouse.pdf},
video = {videos/scaledmouse.mp4},
teaser = {teasers/scaledmouse.png},
abstract = {This paper presents an empirical evaluation of mouse-based interaction in seated Virtual Reality (VR) scenarios as an alternative to traditional VR controllers. We introduce Scaled Mouse, an interaction technique that shows the position of the real mouse in VR and maps standard mouse actions to 3D object manipulation using velocity-based scaling. We present two user studies assessing this method. In the first study, we compared a VR controller against our mouse-based method for manipulation tasks. Results show that the mouse consistently achieved higher rotation accuracy in 3D rotation and docking tasks than the controller, while maintaining comparable task completion times. Building on prior scaled interaction techniques, our second study investigated mouse interaction in a productivity-oriented scenario where users could combine 3D manipulation with a 2D adjustment panel. Scaled Mouse interaction was significantly faster and more accurate than the controller for 3D docking tasks and was rated significantly higher in usability and workload measures. Together, these findings establish the mouse as a viable and effective input device for seated VR contexts, offering both familiarity and accuracy advantages over controllers, particularly for professional and productivity-focused applications.},
keywords = {3D pointing, 3D selection, 3D manipulation},
}
@inproceedings{amini2025tunnelsvswires,
title = {Tunnels vs. Wires: A Comparative Analysis of Two 3D Steering Tasks in Virtual Environments},
author = {Amini*, Mohammadreza and Stuerzlinger, Wolfgang and Yamanaka, Shota and Liang, Hai-Ning and Batmaz, Anil Ufuk},
booktitle = {31st Symposium on Virtual Reality Software and Technology},
publisher = {ACM},
series = {VRST '25},
year = {2025},
month = {Nov},
articleno = {15},
numpages = {11},
doi = {https://doi.org/10.1145/3756884.3766023},
pdf = {papers/tunnelsvswires.pdf},
video = {videos/tunnelsvswires.mp4},
teaser = {teasers/tunnelsvswires.png},
abstract = {Steering involves continuous movement along constrained paths, well-studied in 2D. The extensions to 3D using the Ring-and-Wire and Ball-and-Tunnel tasks were often treated as interchangeable in previous work. In this paper, we directly compare these two tasks through a within-subjects user study (n = 18) with varying 3D path orientations. The results show that Ring-and-Wire significantly outperformed Ball-and-Tunnel, with 17.17% lower task time, 21.65% higher throughput, and 21.52% faster average speed. Participants also preferred Ring-and-Wire and reported lower workload. Visual ambiguity, especially near the tunnel's rear surface, complicated spatial perception in the Ball-and-Tunnel task. We thus recommend that future studies choose 3D steering tasks carefully for experiments, as the two tasks are not interchangeable.},
keywords = {3D steering},
award = {This work was nominated for a Best Paper Award},
}
@inproceedings{panda2025evaluatingdyndash,
title = {Evaluating the Utility of Multiple Workspaces and Easy Chart Creation for Visual Analytics},
author = {Panda, Swaroop and Stuerzlinger, Wolfgang},
booktitle = {Human-Computer Interaction},
commented-publisher = {Springer},
series = {HCI International '25},
year = {2025},
month = {May},
volume = {LNCS 15766},
pages = {103-122},
doi = {https://doi.org/10.1007/978-3-031-93835-1_7},
pdf = {papers/evaluatingdyndash.pdf},
teaser = {teasers/evaluatingdyndash.png},
abstract = {Visual Analytics involves interactive visual exploration of data sets. Interaction methods allow data analysts to explore different aspects and investigate various hypotheses. This work investigates if chart creation and multiple tabs enable analysts to pursue multiple hypotheses or analysis paths better than other approaches. To evaluate this, new features were added to an existing Visual Analytics prototype with a multi-tab design. Two user studies with professional data analysts confirmed the utility of our approach within the Visual Analytics process. Analysts can easily work within multiple workspaces, enabling them to frame and track multiple hypotheses about the data and pursue different exploratory analysis paths, ultimately yielding more comprehensive analysis outcomes.},
keywords = {visual analytics},
}
@inproceedings{le2025redirectedstepper,
title = {RedirectedStepper: Exploring Walking-In-Place Locomotion in VR Using a Mini Stepper for Ascents},
author = {Le*, Quang-Tri and Nham*, Huynh-Duc and Tran, Tanh Quang and Fjeld, Morten and Stuerzlinger, Wolfgang and Zank, Markus and Tran, Minh-Triet and Le, Khanh-Duy},
booktitle = {Conference on Human Factors in Computing Systems},
publisher = {ACM},
series = {CHI '25},
year = {2025},
month = {Apr},
articleno = {614},
numpages = {17},
doi = {https://doi.org/10.1145/3706598.3713313},
pdf = {papers/redirectedstepper.pdf},
video = {videos/redirectedstepper.mp4},
teaser = {teasers/redirectedstepper.png},
abstract = {Walking on inclined surfaces is common in some Virtual Reality (VR) scenarios, for instance when moving between floors of a building, climbing a tower, or ascending a virtual mountain. Existing approaches enabling realistic walking experiences in such settings typically require the user to use bulky walking-in-place hardware or to walk in a physical area. Addressing this challenge, we present RedirectedStepper, a locomotion technique leveraging a novel device based on a mini exercise stepper to provide realistic VR staircase walking experiences by alternating the tilt of the two stepper pedals. RedirectedStepper employs a new exponential mapping function to visually morph the user’s real foot motion to a corresponding curved path in the virtual environment (VE). Combining this stepper and the visual mapping function provides an in-place locomotion technique allowing users to virtually ascend an infinite staircase or slope while walking-in-place (WIP). We conducted three within-subject user studies (n=36) comparing RedirectedStepper with a WIP locomotion technique using the Kinect. Our studies indicate that RedirectedStepper improves the users’ sense of realism in walking on staircases in VR. Based on a set of design implications derived from the user studies, we developed SnowRun, a VR exergame application, demonstrating the use of the RedirectedStepper concept.},
keywords = {locomotion, 3d navigation},
}
@inproceedings{amini2025review3dfitts,
title = {A Systematic Review of Fitts' Law in 3D Extended Reality},
author = {Amini*, Mohammadreza and Stuerzlinger, Wolfgang and Teather, Robert J and Batmaz, Anil Ufuk},
booktitle = {Conference on Human Factors in Computing Systems},
publisher = {ACM},
series = {CHI '25},
year = {2025},
month = {Apr},
articleno = {625},
numpages = {25},
doi = {https://doi.org/10.1145/3706598.3713623},
pdf = {papers/review3dfitts.pdf},
teaser = {teasers/review3dfitts.png},
abstract = {Fitts' law is widely used as an evaluation tool for pointing or selection tasks, evolving into diverse applications, including 3D extended reality (XR) environments like virtual, augmented, and mixed reality. Despite standards like ISO 9241:411, the application of Fitts' law varies significantly across studies, complicating comparisons and undermining the reliability of findings in 3D XR research. To address this, we conducted a systematic review of 1957 papers, focusing on 122 studies that used Fitts' law in 3D XR user experiments. Our analysis shows that over half of these studies referenced Fitts' law without thoroughly investigating throughput, movement time, or error rate. We performed an in-depth meta-analysis to examine how Fitts' law is incorporated into research. By highlighting trends and inconsistencies, and making recommendations this review aims to guide researchers in designing and performing more effective and consistent Fitts-based studies in 3D XR, enhancing the quality and impact of future research.},
keywords = {3d pointing, 3d selection},
}
@inproceedings{srabonee2025hexacotext,
title = {Exploring the Impacts of HEXACO Personality Traits on Text Composition and Transcription},
author = {Srabonee*, Jannatul Ferdous and Alharbi, Ohoud and Stuerzlinger, Wolfgang and Arif, Ahmed Sabbir},
booktitle = {Conference on Human Factors in Computing Systems},
publisher = {ACM},
series = {CHI '25},
year = {2025},
month = {Apr},
articleno = {577},
numpages = {24},
doi = {https://doi.org/10.1145/3706598.3714149},
pdf = {papers/hexacotext.pdf},
teaser = {teasers/hexacotext.png},
abstract = {This study investigates the relationship between the HEXACO personality traits and text entry behaviors in composition and transcription tasks. By analyzing metrics such as entry speed, accuracy, editing efforts, and readability, we identified correlations between specific traits and text entry performance. In composition, honesty-humility and agreeableness were the strongest predictors, correlating significantly with composition time, text length, and editing efforts. In transcription, openness, honesty-humility, and agreeableness influenced performance, though no single trait consistently predicted all metrics. Interestingly, extraversion did not show strong correlations in either task, despite its established link to composition performance in academic contexts. These findings suggest that personality traits affect text entry behavior differently depending on the task, with creative tasks like composition being shaped by distinct traits compared to repetitive tasks like transcription. This research provides valuable insights into the relationship between personality and text entry, opening avenues for personalizing interaction systems based on individual traits.},
keywords = {text entry, personality, text composition, transcription},
}
@inproceedings{mutasim2025gazemtd,
title = {There Is More to Dwell Than Meets the Eye: Toward Better Gaze-Based Text Entry Systems With Multi-Threshold Dwell},
author = {Mutasim*, Aunnoy K and Bashar*, Mohammad Raihanul and Lutteroth, Christof and Batmaz, Anil Ufuk and Stuerzlinger, Wolfgang},
booktitle = {Conference on Human Factors in Computing Systems},
publisher = {ACM},
series = {CHI '25},
year = {2025},
month = {Apr},
articleno = {1088},
numpages = {18},
doi = {https://doi.org/10.1145/3706598.3713781},
pdf = {papers/gazemtd.pdf},
video = {videos/gazemtd.mp4},
teaser = {teasers/gazemtd.png},
abstract = {Dwell-based text entry seems to peak at 20 words per minute (WPM). Yet, little is known about the factors contributing to this limit, except that it requires extensive training. Thus, we conducted a longitudinal study, broke the overall dwell-based selection time into six different components, and identified several design challenges and opportunities. Subsequently, we designed two novel dwell keyboards that use multiple yet much shorter dwell thresholds: Dual-Threshold Dwell (DTD) and Multi-Threshold Dwell (MTD). The performance analysis showed that MTD (18.3 WPM) outperformed both DTD (15.3 WPM) and the conventional Constant-Threshold Dwell (12.9 WPM). Notably, absolute novices achieved these speeds within just 30 phrases. Moreover, MTD’s performance is also the fastest-ever reported average text entry speed for gaze-based keyboards. Finally, we discuss how our chosen parameters can be further optimized to pave the way toward more efficient dwell-based text entry.},
keywords = {gaze, eye tracking, text entry},
}
@inproceedings{zhao2025thfp,
title = {A Novel Bare-Handed Manipulation Technique for Distant Objects in Virtual Reality},
author = {Zhao*, Di Bill and Stuerzlinger, Wolfgang},
booktitle = {Conference on Virtual Reality and {3D} User Interfaces Abstracts and Workshops, Workshop on Novel Input Devices and Interaction Techniques at {VR}},
publisher = {IEEE},
series = {NIDIT '25},
year = {2025},
month = {Mar},
pages = {353-360},
doi = {https://doi.org/10.1109/VRW66409.2025.00083},
pdf = {papers/thfp.pdf},
teaser = {teasers/thfp.png},
video = {videos/thfp.mp4},
abstract = {Advancements in bare-hand tracking technology, featured in many modern virtual reality (VR) headsets, have enabled intuitive hand interaction for proximate 3D object manipulation. However, manipulating distant 3D objects in VR with bare hands remains a challenge, and our work explores the potential of two-handed interaction in this context. Previous work highlighted the ease of using the non-dominant wrist as an interactive surface for interaction, by pointing at it with the dominant hand's index finger. Our research expands this paradigm by extending the interactive zone to the entire non-dominant hand so that the user can interact with their index finger on the non-dominant hand’s fingers and palm to adeptly and precisely manipulate a distant 3D object's position and rotation. Through a user study, we compared our Two-Hand Fingertip-Palm technique (THFP) with a bare-hand variant of HOMER (BHOMER) on efficiency, accuracy, and usability. The results demonstrate a notable accuracy improvement (at least 75% better), especially in complex tasks, such as hanging a painting on a slanted wall, albeit at the expense of efficiency (about 47% slower) compared to BHOMER. While BHOMER is faster, it also exhibits more variation in time, and at the average BHOMER end time, our new technique is still substantially more accurate than BHOMER. Further, our method received a more favorable rating on the System Usability Scale (SUS), underscoring our approach's user-centric and intuitive design. Further, the NASA Task Load Index (NASA-TLX) indicates that THFP not only improves the task completion rate and user satisfaction but also reduces the cognitive, physical, and temporal demand for users. In addition, we discuss insights into the integration of constraints, error prevention, and the facilitation of consistent interaction. Our findings lay a solid foundation for using our new method in the quickly advancing VR field.},
keywords = {hand interaction, bare-hand, 3D manipulation, 3D positioning, 3D rotation, 3D pose},
}
@inproceedings{xu2025predictingray,
title = {Predicting Ray Pointer Landing Poses in VR Using Multimodal LSTM-Based Neural Networks},
author = {Xu*, Wenxuan and Wei*, Yushi and Hu*, Xuning and Stuerzlinger, Wolfgang and Wang, Yuntao and Liang, Hai-Ning},
booktitle = {Conference on Virtual Reality and {3D} User Interfaces},
publisher = {IEEE},
series = {VR '25},
year = {2025},
month = {Mar},
pages = {93-103},
doi = {https://doi.org/10.1109/VR59515.2025.00034},
pdf = {papers/predictingray.pdf},
teaser = {teasers/predictingray.png},
abstract = {Target selection is one of the most fundamental tasks in VR interaction systems. Prediction heuristics can provide users with a smoother interaction experience in this process. Our work aims to predict the ray landing pose for hand-based raycasting selection in Virtual Reality (VR) using a Long Short-Term Memory (LSTM)-based neural network with time-series data input of speed and distance over time from three different pose channels: hand, Head-Mounted Display (HMD), and eye. We first conducted a study to collect motion data from these three input channels and analyzed these movement behaviors. Additionally, we evaluated which combination of input modalities yields the optimal result. A second study validates raycasting across a continuous range of distances, angles, and target sizes. On average, our technique's predictions were within 4.6° of the true landing pose when 50% of the way through the movement. We compared our LSTM neural network model to a kinematic information model and further validated its generalizability in two ways: by training the model on one user's data and testing on other users (cross-user) and by training on a group of users and testing on entirely new users (unseen users). Compared to the baseline and a previous kinematic method, our model increased prediction accuracy by a factor of 3.5 and 1.9, respectively, when 40% of the way through the movement.},
keywords = {3D pointing, 3D selection, ray pointing},
}
@inproceedings{gemici2024speedcontrol,
title = {Object Speed Control Based on Signed Distance Field for Mid-Air Object Manipulation in Virtual Reality},
author = {Gemici*, Mucahit and Stuerzlinger, Wolfgang and Batmaz, Anil Ufuk},
booktitle = {International Symposium on Mixed and Augmented Reality},
publisher = {IEEE},
series = {ISMAR '24},
year = {2024},
month = {Oct},
pages = {465-474},
doi = {https://doi.org/10.1109/ISMAR62088.2024.00061},
pdf = {papers/speedcontrol.pdf},
video = {videos/speedcontrol.mp4},
teaser = {teasers/speedcontrol.png},
abstract = {In Virtual Reality (VR) applications, interacting with distant objects relies heavily on mid-air object manipulation. However, the inherent distance between the user and the object often restricts precise movement capabilities. This paper introduces the Signed Distance Field (SDF) algorithm as a method for mid-air object manipulation, and combines it with the ray casting interaction technique to investigate its effect on user performance and user experience. To increase the accuracy of the movements, we leverage the speed-accuracy trade-off to dynamically adjust object manipulation speed based on the SDF algorithm's output. Our study, involving 18 participants, examines the effects of SDF across three different tasks with different complexities. Our results showed that ray casting with SDF reduces the number of errors in complex tasks without slowing down the participants. Further, our proposed method significantly improved the user experience for complex tasks. We hope that our proposed assistive system, designed for tasks and applications, can be used as an interaction technique to enable more accurate manipulation of distant objects in the fields like surgical planning, architecture, and games.},
keywords = {3D manipulation, 3D posing, wire task},
}
@inproceedings{jiang2024flexdoc,
title = {FlexDoc: Flexible Document Adaptation through Optimizing both Content and Layout},
author = {Jiang*, Yue and Lutteroth, Christof and Jain, Rajiv and Tensmeyer, Christopher and Manjunatha, Varun and Stuerzlinger, Wolfgang and Morariu, Vlad},
booktitle = {Symposium on Visual Languages and Human-Centric Computing},
publisher = {IEEE},
series = {VL/HCC '24},
year = {2024},
month = {Sep},
pages={217-222},
doi = {https://doi.org/10.1109/VL/HCC60511.2024.00032},
pdf = {papers/flexdoc.pdf},
video = {videos/flexdoc.mp4},
teaser = {teasers/flexdoc.png},
abstract = {Designing adaptive documents that are visually appealing across various devices and for diverse viewers is a challenging task. This is due to the wide variety of devices and different viewer requirements and preferences. Alterations to a document’s content, style, or layout often necessitate numerous adjustments, potentially leading to a complete layout redesign. We introduce FLEXDOC, a framework for creating and consuming documents that seamlessly adapt to different devices, author, and viewer preferences and interactions. It eliminates the need for manually creating multiple document layouts, as FLEXDOC enables authors to define desired document properties using templates and employs both discrete and continuous optimization in a novel comprehensive optimization process, which leverages automatic text summarization and image carving techniques to adapt both layout and content during consumption dynamically. Further, we demonstrate FLEXDOC in real-world scenarios.},
keywords = {document layout, flexible documents, adaptive documents, responsive documents},
}
@inproceedings{kasahara2024steeringthroughput,
title = {Better Definition and Calculation of Throughput and Effective Parameters for Steering to Account for Subjective Speed-accuracy Tradeoffs},
author = {Kasahara*, Nobuhito and Oba*, Yosuke and Yamanaka, Shota and Batmaz, Anil Ufuk and Stuerzlinger, Wolfgang and Miyashita, Homei},
booktitle = {Conference on Human Factors in Computing Systems},
publisher = {ACM},
series = {CHI '24},
year = {2024},
month = {May},
articleno = {722},
pages = {1-18},
doi = {https://doi.org/10.1145/3613904.3642084},
pdf = {papers/steeringthroughput.pdf},
video = {videos/steeringthroughput.mp4},
teaser = {teasers/steeringthroughput.png},
abstract = {In Fitts' law studies to investigate pointing, throughput is used to characterize the performance of input devices and users, which is claimed to be independent of task difficulty or the user's subjective speed-accuracy bias.
While throughput has been recognized as a useful metric for target-pointing tasks, the corresponding formulation for path-steering tasks and its evaluation have not been thoroughly examined in the past. In this paper, we conducted three experiments using linear, circular, and sine-wave path shapes to propose and investigate a novel formulation for the effective parameters and the throughput of steering tasks. Our results show that the effective width substantially improves the fit to data with mixed speed-accuracy biases for all task shapes. Effective width also smoothed out the throughput across all biases, while the usefulness of the effective amplitude depended on the task shape. Our study thus advances the understanding of user performance in trajectory-based tasks.},
keywords = {steering, throughput},
}
@inproceedings{dash2024me911,
title = {Multimedia-Enabled 911: Exploring 911 Callers’ Experience of Call Taker Controlled Video Calling in Simulated Emergencies},
author = {Dash*, Punyashlok and Axtell, Benett and Geiskkovitch, Denise Y. and Neustaedter, Carman and Stuerzlinger, Wolfgang},
booktitle = {Conference on Human Factors in Computing Systems},
publisher = {ACM},
series = {CHI '24},
year = {2024},
month = {May},
articleno = {500},
pages = {1-15},
doi = {https://doi.org/10.1145/3613904.3643055},
pdf = {papers/me911.pdf},
video = {videos/me911.mp4},
teaser = {teasers/me911.png},
abstract = {Emergency response to large-scale disasters is often supported with multimedia from social media. However, while these features are common in everyday video calls, the complex needs of 911 and other systems make it difficult to directly incorporate these features. We assess an ME911 (Multimedia-Enabled 911) app to understand how the design will need to deviate from common norms and how callers will respond to those non-standard choices. We expand the role of 911 call taker control over emergency situations to the calling interface while incorporating key features like map-based location finding. Participants’ experiences in mock emergencies show the non-standard design helps callers in the unfamiliar setting of emergency calling yet it also causes confusion and delays. We find the need for emergency-specific deviations from design norms is supported by participant feedback. We discuss how broader system changes will support callers to use these non-standard designs during emergencies.},
keywords = {emergency, 911, video calling, teleconference, V4Space},
}
@inproceedings{yamanaka2024latencysteering,
title = {The Effect of Latency on Movement Time in Path-steering},
author = {Yamanaka, Shota and Stuerzlinger, Wolfgang},
booktitle = {Conference on Human Factors in Computing Systems},
publisher = {ACM},
series = {CHI '24},
year = {2024},
month = {May},
articleno = {622},
pages = {1-19},
doi = {https://doi.org/10.1145/3613904.3642316},
pdf = {papers/latencysteering.pdf},
video = {videos/latencysteering_application.mp4},
teaser = {teasers/latencysteering.png},
abstract = {In current graphical user interfaces, there exists a (typically unavoidable) end-to-end latency from each pointing-device movement to its corresponding cursor response on the screen, which is known to affect user performance in target selection, e.g., in terms of movement time (MTs). Previous work also reported that a long latency increases MTs in path-steering tasks, but the quantitative relationship between latency and MT had not been previously investigated for path-steering. In this work, we derive models to predict MTs for path-steering and evaluate them with five tasks: goal crossing as a preliminary task for model derivation, linear-path steering, circular-path steering, narrowing-path steering, and steering with target pointing. The results show that the proposed models yielded an adjusted R^2 > 0.94, with lower AICs and smaller cross-validation RMSEs than the baseline models, enabling more accurate prediction of MTs.},
keywords = {steering, latency},
}
@inproceedings{turkmen2024eyeconguide,
title = {EyeGuide & EyeConGuide: Gaze-based Visual Guides to Improve 3D Sketching Systems},
author = {Turkmen+, Rumeysa and Gelmez+, Zeynep Ecem and Batmaz, Anil Ufuk and Stuerzlinger, Wolfgang and Asente, Paul and Sarac, Mine and Pfeuffer, Ken and Barrera Machuca, Mayra Donaji},
booktitle = {Conference on Human Factors in Computing Systems},
publisher = {ACM},
series = {CHI '24},
year = {2024},
month = {May},
articleno = {178},
pages = {1-14},
doi = {https://doi.org/10.1145/3613904.3641947},
pdf = {papers/eyeconguide.pdf},
video = {videos/eyeconguide.mp4},
teaser = {teasers/eyeconguide.png},
abstract = {Visual guides in Virtual Reality sketching systems help to align strokes and raise accuracy. Guides that appear dynamically where one wants to draw have the potential to both lower the reliance on manual guide activation and improve the sketching experience. We propose novel guide techniques for sketching that exploit eye-tracking to modulate where a grid fragment appears. EyeGuide and EyeConGuide cause this grid fragment to appear spatially close to the user's intended sketches, with one relying on the user's eyes and the other on both the eyes and the hand location. In two user studies, we evaluated the techniques in basic and complex sketching tasks. The results show that gaze-based guides increased sketching accuracy compared to no guides, improved the system usability over manual activation, and were preferred by most users. Our research contributes highly usable techniques to assist accurate sketching and insights into multimodal gaze-contingent sketching.},
keywords = {eye tracking, gaze tracking, 3D sketching, 3D drawing},
}
@inproceedings{rind2024longitudinalehct,
title = {Eye-Hand Coordination Training: A Systematic Comparison of 2D, VR, and AR Screen Technologies and Task Motives},
author = {Rind*, Aliza and Zaugg+, Irene and Celik+, Elif and Stuerzlinger, Wolfgang and Ortega, Francisco and Batmaz, Anil Ufuk and Sarac, Mine},
booktitle = {Conference on Virtual Reality and {3D} User Interfaces},
publisher = {IEEE},
series = {VR '24},
year = {2024},
month = {Mar},
pages = {200-210},
doi = {https://doi.org/10.1109/VR58804.2024.00043},
pdf = {papers/longitudinalehct.pdf},
teaser = {teasers/longitudinalehct.png},
video = {videos/longitudinalehct.mp4},
abstract = {This study compares Augmented Reality (AR), Virtual Reality (VR), and 2D touchscreen approaches for eye-hand coordination training. We thoroughly analyze the motor performance of twenty participants throughout the course of a ten-session longitudinal study. Our study includes five different assessment criteria: speed, error rate, accuracy, precision, and none. We also analyze the participants' performance in terms of effective throughput as a novel evaluation criterion. The results showed that each task execution strategy has a different effect on one or more psychomotor characteristics of the trainee, which highlights the importance of the training program. We also showed that effective throughput is a candidate for monitoring the overall motor performance progress in eye-hand coordination training systems.},
keywords = {3D pointing, vergence-accomodation conflict, virtual hand},
}
@inproceedings{wagner2024taxivis,
title = {Reimagining TaxiVis through an Immersive Space-Time Cube Metaphor and Reflecting on Potential Benefits of Immersive Analytics for Urban Data Exploration},
author = {Wagner Filho*, Jorge and Silva, Claudio and Stuerzlinger, Wolfgang and Nedel, Luciana},
booktitle = {Conference on Virtual Reality and {3D} User Interfaces},
publisher = {IEEE},
series = {VR '24},
year = {2024},
month = {Mar},
pages = {827-838},
doi = {https://doi.org/10.1109/VR58804.2024.00102},
pdf = {papers/immersivetaxivis.pdf},
teaser = {teasers/immersivetaxivis.png},
video = {videos/immersivetaxivis.mp4},
url = {https://arxiv.org/abs/2402.00344},
abstract = {Recent studies suggest that immersion into 3D environments could increase the usability of 3D visualizations by facilitating 3D perception and easier interaction, and also better support collaboration between local or remote analysts. This is particularly relevant for domains with an obvious three-dimensional mapping, such as urban space-time data. To explore how a traditional visualization system could be adapted into an immersive framework, and how it could benefit from this, we decided to revisit a landmark paper presented ten years ago at IEEE VIS. TaxiVis, by Ferreira et al., enabled interactive spatial-temporal querying of a large dataset of taxi trips in New York City. Here, we reimagine how TaxiVis’ functionalities could be implemented and extended in a 3D immersive environment. Among the unique features we identify as being enabled by the Immersive TaxiVis prototype are alternative uses of the additional visual dimension, a fully-visual 3D spatio-temporal query framework, and the opportunity to explore the data at different scales and frames of reference. The intent behind our work is to complement and enhance established forms of visualization, not to replace them. Through reporting on our findings, and on the vision and reasoning behind our design decisions, we hope to contribute to the debate on how conventional and immersive visualization paradigms can help each other and also how the exploration of urban datasets can be facilitated in the coming years.},
keywords = {visual analytics, immersive analytics, space-time cube, 3D visualization, 3D interaction},
}
@inproceedings{batmaz2023gripstyle,
title = {Effect of Grip Style on Pointing in Head Mounted Displays},
author = {Batmaz, Anil Ufuk and Turkmen+, Rumeysa and Sarac, Mine and Barrera Machuca, Mayra Donaji and Stuerzlinger, Wolfgang},
booktitle = {International Symposium on Mixed and Augmented Reality},
publisher = {IEEE},
series = {ISMAR '23},
year = {2023},
month = {Oct},
pages = {425-433},
doi = {https://doi.org/10.1109/ISMAR59233.2023.00057},
pdf = {papers/gripstyle.pdf},
teaser = {teasers/gripstyle.png},
abstract = {When working in Virtual Reality (VR), the user's performance is affected by how the user holds the input device (e.g., controller), typically using either a precision or a power grip. Previous work examined these grip styles for 3D pointing at targets at different depths in peripersonal space. They found that participants had a lower error rate with the precision grip but no difference in movement speed, throughput, or interaction with target depth, but their experiment was potentially affected by tracking differences between devices. This paper reports an experiment that partially replicates and extends this study by evaluating the effect of grip style on the 3D selection of nearby targets with the same device. Furthermore, our experiment investigates the effect of the vergence-accommodation conflict (VAC) present in current stereo displays on 3D pointing in peripersonal space. Our results show that grip style significantly affects user performance. We hope that our results can guide developers, researchers, and designers when creating virtual environments.},
keywords = {3D pointing, vergence-accomodation conflict},
}
@inproceedings{batmaz2023reinvestigatingvac,
title = {Re-investigating the Effect of the Vergence-Accommodation Conflict on 3D Pointing},
author = {Batmaz, Anil Ufuk and Turkmen+, Rumeysa and Sarac, Mine and Barrera Machuca, Mayra Donaji and Stuerzlinger, Wolfgang},
booktitle = {29th Symposium on Virtual Reality Software and Technology},
publisher = {ACM},
series = {VRST '23},
year = {2023},
month = {Oct},
articleno = {8},
numpages = {10},
doi = {https://doi.org/10.1145/3611659.3615686},
pdf = {papers/reinvestigatingvac.pdf},
teaser = {teasers/reinvestigatingvac.png},
abstract = {The vergence-accommodation conflict (VAC) limits user performance in current Virtual Reality (VR) systems. In this paper, we investigate the effects of the VAC in a single focal VR system using three experimental conditions: with no VAC, with a constant VAC, and with a varying VAC. Previous work had yielded conflicting results, so we decided to re-investigate this issue. Eighteen participants performed an ISO 9241:411 task in a study that closely replicates previous work, except that the angle of the task space was rotated 20 degrees downward, to make the task less fatiguing to perform, which addresses a potential confound in previous work. We found that the varying VAC condition had worse performance than the other conditions, which indicates that the contrasting results in previous work were very likely due to biomechanical factors. We hope that our work contributes to the understanding of the influence of the VAC in VR systems and potential strategies for improving user experience and performance in immersive virtual environments.},
keywords = {3D pointing, vergence-accomodation conflict},
}
@inproceedings{han2023drseye,
title = {Dr.’s Eye: The Design and Evaluation of a Video Conferencing System to Support Doctor Appointments in Home Settings},
author = {Han*, Dongqi and Geiskkovitch, Denise Y. and Yuan, Ye and Mills*, Chelsea and Zhong*, Ce and Chen*, Amy Yo Sue and Stuerzlinger, Wolfgang and Neustaedter, Carman},
booktitle = {Conference on Human Factors in Computing Systems},
publisher = {ACM},
series = {CHI '23},
year = {2023},
month = {Apr},
articleno = {343},
numpages = {18},
doi = {https://doi.org/10.1145/3544548.3581350},
pdf = {papers/drseye.pdf},
video = {videos/drseye.mp4},
teaser = {teasers/drseye.png},
abstract = {The spread of COVID-19 has encouraged the practice of using video conferencing for family doctor appointments. Existing applications and devices face challenges in capturing the correct view of patients' bodies and supporting ease of use. We created Dr.’s Eye, a video conferencing prototype to support varying types of body exams in home settings. An exploratory study was conducted with patients in mock appointments to explore the use of our video system. Results show the benefits of providing more flexibility with a decoupled camera and display, and privacy protection by limiting the camera view. Yet, challenges remain in maneuvering two devices, presenting feedback of the camera view, coordinating camera work between the doctor and patient, and coping with discomfort in showing private body regions. This inspires future research on how to design a video system for doctor appointments.},
keywords = {teleconference, doctor},
}
@inproceedings{lee2023multiscaletransitions,
title = {Designing Viewpoint Transition Techniques in Multiscale Virtual Environments},
author = {Lee*, Jong-In and Asente, Paul and Stuerzlinger, Wolfgang},
booktitle = {Conference on Virtual Reality and {3D} User Interfaces},
publisher = {IEEE},
series = {VR '23},
year = {2023},
month = {Mar},
pages = {680-690},
doi = {https://doi.org/10.1109/VR55154.2023.00083},
pdf = {papers/multiscaletransitions.pdf},
video = {videos/multiscaletransitions.mp4},
teaser = {teasers/multiscaletransitions.png},
abstract = {Viewpoint transitions have been shown to improve users' spatial orientation and help them build a cognitive map when they are navigating an unfamiliar virtual environment. Previous work has investigated transitions in single-scale virtual environments, focusing on trajectories and continuity. We extend this work with an in-depth investigation of transition techniques in multiscale virtual environments (MVEs). We identify challenges in navigating MVEs with nested structures and assess how different transition techniques affect spatial understanding and usability. Through two user studies, we investigated transition trajectories, interactive control of transition movement, and speed modulation in a nested MVE. We show that some types of viewpoint transitions enhance users' spatial awareness and confidence in their spatial orientation and reduce the need to revisit a target point of interest multiple times.},
keywords = {3D navigation, multiscale virtual environment, transitions, speed control},
}
@inproceedings{batmaz2023virtualhandvac,
title = {Measuring the Effect of Stereo Deficiencies on Peripersonal Space Pointing},
author = {Batmaz, Anil Ufuk and Hudhud Mughrabi+, Moaaz and Sarac, Mine and Barrera Machuca, Mayra Donaji and Stuerzlinger, Wolfgang},
booktitle = {Conference on Virtual Reality and {3D} User Interfaces},
publisher = {IEEE},
series = {VR '23},
year = {2023},
month = {Mar},
pages = {1-11},
doi = {https://doi.org/10.1109/VR55154.2023.00063},
pdf = {papers/virtualhandvac.pdf},
teaser = {teasers/virtualhandvac.png},
abstract = {State-of-the-art Virtual Reality (VR) and Augmented Reality (AR) headsets rely on singlefocal stereo displays. For objects away from the focal plane, such displays create a vergence-accommodation conflict (VAC), potentially degrading user interaction performance. In this paper, we study how the VAC affects pointing at targets within arm's reach with virtual hand and raycasting interaction in current stereo display systems. We use a previously proposed experimental methodology that extends the ISO 9241-411:2015 multi-directional selection task to enable fair comparisons between selecting targets in different display conditions. We conducted a user study with eighteen participants and the results indicate that participants were faster and had higher throughput in the constant VAC condition with the virtual hand. We hope that our results enable designers to choose more efficient interaction methods in virtual environments.},
keywords = {3D pointing, vergence-accomodation conflict, virtual hand},
}
@inproceedings{shi2022groupalignment,
title = {Group-based Object Alignment in Virtual Reality Environments},
author = {Shi*, Rongkai and Zhang*, Jialin and Stuerzlinger, Wolfgang and Liang, Hai-Ning},
booktitle = {Symposium on Spatial User Interaction},
publisher = {ACM},
series = {SUI '22},
year = {2022},
month = {Dec},
articleno = {2},
numpages = {11},
doi = {https://doi.org/10.1145/3565970.3567682},
pdf = {papers/groupalign3D.pdf},
teaser = {teasers/groupalign3D.png},
abstract = {Group-based object alignment is an essential manipulation task, particularly for complex scenes. In conventional 2D user interfaces, such alignment tasks are generally achieved via a command/menu-based interface. Virtual reality (VR) head-mounted displays (HMDs) provide a rich immersive interaction experience, which opens more design options for group-based object alignment interaction techniques. However, object alignment techniques in immersive environments are underexplored. In this paper, we present four interaction techniques for 3 degrees-of-freedom translational alignments: AlignPanel, AlignWidget, AlignPin, and AlignGesture. We evaluated their performance, workload, and usability in a user study with 20 participants. Our results indicate different benefits and drawbacks of these techniques for group-based alignment in immersive systems. Based on the findings, we distill a set of design choices and recommendations for these techniques in various application scenarios.},
keywords = {3D positioning, 3D manipulation, alignment, 3D user interfaces},
}
@inproceedings{batmaz2022improvingperformance,
title = {Improving Effective Throughput Performance using Auditory Feedback in Virtual Reality Training Systems},
author = {Batmaz, Anil Ufuk and Yu*, Kangyou and Liang, Hai-Ning and Stuerzlinger, Wolfgang},
booktitle = {Symposium on Spatial User Interaction},
publisher = {ACM},
series = {SUI '22},
year = {2022},
month = {Dec},
articleno = {18},
numpages = {11},
doi = {https://doi.org/10.1145/3565970.3567702},
pdf = {papers/audiothroughput.pdf},
teaser = {teasers/audiothroughput.png},
abstract = {During the complex process of motor skill acquisition, novices might focus on different criteria, such as speed or accuracy, in their training. Previous research on virtual reality (VR) training systems has shown that effective throughput could also be used as such an assessment criterion. Effective throughput combines speed, accuracy, and precision into one measure, and can be influenced by auditory feedback. This paper investigates through a user study how to improve participants' effective throughput performance using auditory feedback. In the study, we mapped the speed and accuracy of the participants to the pitch of the auditory error feedback in an ISO 9241-411 multidirectional pointing task and evaluated participants' performance. The results showed it is possible to regulate the time or accuracy performance of the participants and thus the effective throughput. Based on the findings of our work, we also identify that effective throughput is an appropriate assessment criterion for VR training systems. We hope that our results can be used for VR training applications.},
keywords = {3D pointing, auditory feedback, training},
}
@inproceedings{batmaz2022stereodistal,
title = {Effect of Stereo Deficiencies on Virtual Distal Pointing},
author = {Batmaz, Anil Ufuk and Hudhud Mughrabi+, Moaaz and Barrera Machuca, Mayra Donaji and Stuerzlinger, Wolfgang},
booktitle = {28th Symposium on Virtual Reality Software and Technology},
publisher = {ACM},
series = {VRST '22},
year = {2022},
month = {Nov},
articleno = {12},
numpages = {8},
doi = {https://doi.org/10.1145/3562939.3565621},
pdf = {papers/vac_distal.pdf},
teaser = {teasers/vac_distal.png},
abstract = {Previous work has shown that the mismatch between disparity and optical focus cues, i.e., the vergence and accommodation conflict (VAC), affects virtual hand selection in immersive systems. To investigate if the VAC also affects distal pointing with ray casting, we ran a user study with an ISO 9241:411 multidirectional selection task where participants selected 3D targets with three different VAC conditions, no VAC, i.e., targets placed roughly at 75 cm, which matches the focal plane of the VR headset, constant VAC, i.e., at 400 cm from the user, and varying VAC, where the depth distance of targets changed between 75 cm and 400 cm. According to our results, the varying VAC condition requires the most time and decreases the throughput performance of the participants. It also takes longer for users to select targets in the constant VAC condition than without the VAC. Our results show that in distal pointing placing objects at different depth planes has detrimental effect on the user performance.},
keywords = {3D pointing, vergence-accomodation conflict, ray casting},
}
@inproceedings{mutasim2022performance,
title = {Performance Analysis of Saccades for Primary and Confirmatory Target Selection},
author = {Mutasim*, Aunnoy K and Batmaz, Anil Ufuk and Hudhud Mughrabi+, Moaaz and Stuerzlinger, Wolfgang},
booktitle = {28th Symposium on Virtual Reality Software and Technology},
publisher = {ACM},
series = {VRST '22},
year = {2022},
month = {Nov},
articleno = {18},
numpages = {12},
doi = {https://doi.org/10.1145/3562939.3565619},
pdf = {papers/saccadeconfirm.pdf},
video = {videos/saccadeconfirm.mp4},
teaser = {teasers/saccadeconfirm.png},
abstract = {In eye-gaze-based selection, dwell suffers from several issues, e.g., the Midas Touch problem. Here we investigate saccade-based selection techniques as an alternative to dwell. First, we designed a novel user interface (UI) for Actigaze and used it with (goal-crossing) saccades for confirming the selection of small targets (i.e., < 1.5-2°). We compared it with three other variants of Actigaze (with button press, dwell, and target reverse crossing) and two variants of target magnification (with button press and dwell). Magnification-dwell exhibited the most promising performance. Among Actigaze, goal-crossing was the fastest and achieved the highest throughput but suffered the most errors. We then evaluated goal-crossing as a primary selection technique for targets ≥ 2° and implemented a novel UI for such interaction. Results revealed that dwell achieved the best performance. Yet, we identified goal-crossing as a good compromise between dwell and button press. Our findings thus identify novel options for gaze-only interaction.},
keywords = {eye tracking, pointing, saccades},
}
@inproceedings{chidambaram2022editar,
title = {EditAR: A Digital Twin Authoring and Editing Environment for Creation of AR/VR and Video Instructions from a Single Demonstration},
author = {Chidambaram*, Subramanian and Reddy*, Sai Swarup and Rumple*, Matthew David and Ipsita*, Ananya and Villanueva*, Ana M and Redick, Thomas S and Stuerzlinger, Wolfgang and Ramani, Karthik},
booktitle = {International Symposium on Mixed and Augmented Reality},
publisher = {IEEE},
series = {ISMAR '22},
year = {2022},
month = {Oct},
pages = {326-335},
doi = {https://doi.org/10.1109/ISMAR55827.2022.00048},
pdf = {papers/editar.pdf},
video = {videos/editar.mp4},
teaser = {teasers/editar.png},
abstract = {Augmented/Virtual reality and video-based media play a vital role in the digital learning revolution to train novices in spatial tasks. However, creating content for these different media requires expertise in several fields. We present EditAR, a unified authoring and editing workflow to create content for AR, VR, and video with a single demonstration. EditAR captures the user’s interaction within an environment and creates a digital twin enabling users with no prior programming background to develop content. We conducted formative interviews with both subject and media experts to design the system. The prototype then developed was reviewed by experts. We also performed a comparative study on 2D video creation from 3D recordings, via a 3D editor, which uses freehand interaction for in-headset editing vs. traditional video creation. Users took 5x less time to record instructions and preferred EditAR in a qualitative survey, along with giving significantly higher usability scores.},
keywords = {augmented reality, 3d user interfaces, authoring, digital twin},
}
@inproceedings{alharbi2022autocucumber,
title = {Auto-Cucumber: The Impact of Autocorrection Failures on Users' Frustration},
author = {Alharbi*, Ohoud and Stuerzlinger, Wolfgang},
booktitle = {Graphics Interface},
series = {GI '22},
year = {2022},
month = {May},
articleno = {16},
pages = {148-160},
doi = {https://doi.org/10.20380/GI2022.16},
pdf = {papers/autocucumber.pdf},
commented-url = {https://openreview.net/forum?id=dcbsb4qTmnt},
teaser = {teasers/autocucumber.png},
abstract = {Many mobile users rely on autocorrection mechanisms during text entry on their smartphone. Previous studies investigated the effects of autocorrection mechanisms on typing speed and accuracy but did not explore the level of frustration and perceived mental workload often associated with autocorrection. In this paper, we investigate the effect of autocorrection failures on the user’s frustration, mental and physical demand, performance, and effort using a mixed-methods user study. We identified that perceived mental and physical demand, and frustration are directly affected by autocorrection.},
keywords = {text entry, autocorrect, errors, frustration},
}
@inproceedings{batmaz2022vacpointing,
title = {The Effect of the Vergence-Accommodation Conflict on Virtual Hand Pointing in Immersive Displays},
author = {Batmaz, Anil Ufuk and Barrera Machuca, Mayra D. and Sun, Junwei and Stuerzlinger, Wolfgang},
booktitle = {Conference on Human Factors in Computing Systems},
publisher = {ACM},
series = {CHI '22},
year = {2022},
month = {May},
articleno = {633},
numpages = {15},
doi = {https://doi.org/10.1145/3491102.3502067},
pdf = {papers/vacpointing.pdf},
video = {videos/vacpointing.mp4},
teaser = {teasers/vacpointing.png},
abstract = {Previous work hypothesized that for Virtual Reality (VR) and Augmented Reality (AR) displays a mismatch between disparities and optical focus cues, known as the vergence and accommodation conflict (VAC), affects depth perception and thus limits user performance in 3D selection tasks within arm’s reach (peri-personal space). To investigate this question, we built a multifocal stereo display, which can eliminate the influence of the VAC for pointing within the investigated distances. In a user study, participants performed a virtual hand 3D selection task with targets arranged laterally or along the line of sight, with and without a change in visual depth, in display conditions with and without the VAC. Our results show that the VAC influences 3D selection performance in common VR and AR stereo displays and that multifocal displays have a positive effect on 3D selection performance with a virtual hand.},
keywords = {3D pointing, vergence-accomodation conflict, immersive display system, multifocal display},
}
@inproceedings{hudhud2022jitter,
title = {My Eyes Hurt: Effects of Jitter in 3D Gaze Tracking},
author = {Hudhud Mughrabi+, Moaaz and Mutasim*, Aunnoy K and Stuerzlinger, Wolfgang and Batmaz, Anil Ufuk},
booktitle = {Conference on Virtual Reality and {3D} User Interfaces Abstracts and Workshops, Workshop on Novel Input Devices and Interaction Techniques at {VR}},
publisher = {IEEE},
series = {NIDIT '22},
year = {2022},
month = {Mar},
pages = {310-315},
doi = {https://doi.org/10.1109/VRW55335.2022.00070},
pdf = {papers/gazejitter.pdf},
abstract = {Jitter, small fluctuations in the signal, is one of the major sources for a decrease of motor performance and a negative user experience in virtual reality (VR) systems. Current technologies still cannot eliminate jitter in VR systems, especially in the eye-gaze tracking systems embedded in many head-mounted displays. In this work, we used an HTC Vive Pro Eye, artificially added 0.5°, 1°, and 1.5° jitter to the eye-tracking data, and analyzed user performance in a ISO 9241:411 pointing task with targets at 1 or 2 meters visual distance using angular Fitts’ law. The results showed that the user’s error rate significantly increases with increased jitter levels. No significant difference was observed for time and throughput. Additionally, we observed a significant decrease in terms of time, error rate, and throughput for the more distant targets. We hope that our results guide researcher, practitioners, and developers towards better gaze-tracking-based VR applications.},
keywords = {3D pointing, jitter, virtual reality},
}
@inproceedings{batmaz2021anchoring,
title = {When Anchoring Fails: Interactive Alignment of Large Virtual Objects in Occasionally Failing AR Systems},
author = {Batmaz, Anil Ufuk and Stuerzlinger, Wolfgang},
booktitle = {Future Technologies Conference},
publisher = {Springer},
series = {FTC '21},
year = {2021},
month = {Oct},
volume = {LNNS 358},
numpages = {13},
doi = {https://doi.org/10.1007/978-3-030-89906-6_4},
pdf = {papers/aranchoring.pdf},
teaser = {teasers/aranchoring.png},
abstract = {Augmented reality systems show virtual object models overlaid over real ones, which is helpful in many contexts, e.g., during maintenance. Assuming all geometry is known, misalignments in 3D poses will still occur without perfectly robust viewer and object 3D tracking. Such misalignments can impact the user experience and reduce the potential benefits associated with AR systems. In this paper, we implemented several interactive algorithms to make manual virtual object alignment easier, based on previously presented methods, such as HoverCam, SHOCam, and a Signed Distance Field. Our approach also simplifies the user interface for manual 3D pose alignment. The results of our work indicate that our approach can reduce the time needed for interactive 3D pose alignment, which improves the user experience.},
keywords = {augmented reality, 3D navigation, 3D orbiting, 3D tracking, anchoring},
}
@inproceedings{chakraborty2021vizinteract,
title = {VizInteract: Rapid Data Exploration through Multi-Touch Interaction with Multi-Dimensional Visualizations},
author = {Chakraborty*, Supratim and Stuerzlinger, Wolfgang},
booktitle = {Human-Computer Interaction},
publisher = {Springer},
series = {INTERACT '21},
year = {2021},
month = {Aug},
volume = {LNCS 12934},
pages = {610–632},
doi = {https://doi.org/10.1007/978-3-030-85613-7_39},
pdf = {papers/vizinteract.pdf},
url = {https://heysupratim.com/projects/vizinteract},
video = {videos/vizinteract.mp4},
teaser = {teasers/vizinteract.png},
abstract = {Creating and editing multi-dimensional data visualizations with current tools typically involves complex interactions. We present VizInteract, an interactive data visualization tool for touch-enabled displays. VizInteract supports efficient multi-touch data exploration through rapid construction of and interaction with multi-dimensional data visualizations. Building on primitive visualization idioms like histograms, VizInteract addresses the need for easy data exploration by facilitating the construction of multi-dimensional visualizations, such as scatter plots, parallel coordinate plots, radar charts, and scatter plot matrices, through simple multi-touch actions. Touch-based brushing-and-linking as well as attribute-based filter bubbles support “diving into the data” during analysis. We present the results of two explorative studies, one on a tablet and another on a large touchscreen and analyze the usage patterns that emerge while participants conducted visual analytics data exploration tasks in both conditions.},
keywords = {visual analytics, visualization, touch},
}
@inproceedings{chidambaram2021processar,
title = {ProcessAR: An augmented reality-based tool to create in-situ procedural 2D/3D AR Instructions},
author = {Chidambaram*, Subramanian and Huang*, Hank and He*, Fengming and Qian*, Xun and Villanueva*, Ana M and Redick, Thomas S and Stuerzlinger, Wolfgang and Ramani, Karthik},
booktitle = {Designing Interactive Systems},
publisher = {ACM},
series = {DIS '21},
year = {2021},
month = {Jun},
pages = {234-249},
doi = {https://doi.org/10.1145/3461778.3462126},
pdf = {papers/processar.pdf},
video = {videos/processar.mp4},
teaser = {teasers/processar.png},
abstract = {Augmented reality (AR) is an efficient form of delivering spatial information and has great potential for training workers. However, AR is still not widely used due to the technical skills, expertise, required to develop appropriate and interactive AR content. We developed ProcessAR, an AR-based system to develop 2D/3D content by capturing subject matter expert (SME) environment-object interactions, in situ. To enable smooth workflows, ProcessAR locates and identifies different tools/objects in the workspace where the author looks at them, by utilizing a computer vision algorithm. We explored additional features such as embedding 2D videos to detected objects and user-adaptive triggers. The design space for ProcessAR was identified from formative interviews with AR programming experts and SMEs, alongside a comparative design study with SMEs and novice users. A final user evaluation comparing ProcessAR and a baseline AR authoring environment studied, users rated ProcessAR as the better form on qualitative perceptional surveys.},
keywords = {augmented reality, mixed reality, AR authoring},
}
@inproceedings{mutasim2021pinchclickdwell,
title = {Pinch, Click, or Dwell: Comparing Different Selection Techniques for Eye-Gaze-Based Pointing in Virtual Reality},
author = {Mutasim*, Aunnoy K. and Batmaz, Anil Ufuk and Stuerzlinger, Wolfgang},
booktitle = {Symposium on Eye Tracking Research and Applications},
publisher = {ACM},
series = {ETRA '21},
year = {2021},
month = {May},
articleno = {15},
numpages = {7},
doi = {https://doi.org/10.1145/3448018.3457998},
pdf = {papers/pinchclickdwell.pdf},
teaser = {teasers/pinchclickdwell.png},
abstract = {While a pinch action is gaining popularity for selection/activation of virtual objects in eye-gaze-based systems, it is still unknown how well it performs compared to other popular alternatives, e.g., a button click or a dwell action. To determine pinch's performance in terms of execution time, error rate, and throughput, we implemented a Fitts' law task in Virtual Reality (VR) where the subjects pointed with their eye-gaze and selected/activated the targets by either pinch, clicking a button, or dwell. Results revealed that although pinch was slower, resulted in more errors, and had less throughput compared to button clicks, none of these differences between the two conditions were significant. Dwell exhibited the least errors but was significantly slower and achieved less throughput compared to the other conditions. Based on these findings, we conclude that the pinch gesture is a reasonable alternative to button clicks for eye-gaze-based VR systems.},
keywords = {eye tracking, selection, pointing},
}
@inproceedings{jiang2021reverseorc,
title = {{ReverseORC}: Reverse Engineering of Resizable User Interface Layouts with {OR}-Constraints},
author = {Jiang*, Yue and Stuerzlinger, Wolfgang and Lutteroth, Christof},
booktitle = {Conference on Human Factors in Computing Systems},
publisher = {ACM},
series = {CHI '21},
year = {2021},
month = {May},
articleno = {316},
numpages = {18},
doi = {https://doi.org/10.1145/3411764.3445043},
pdf = {papers/reverseorc.pdf},
url = {https://github.com/YueJiang-nj/ReverseORC-CHI2021},
video = {https://youtu.be/uBVRtUvLFSk},
teaser = {teasers/reverseorc.png},
abstract = {Reverse engineering (RE) of user interfaces (UIs) plays an important role in software evolution. However, the large diversity of UI technologies and the need for UIs to be resizable make this challenging.
We propose ReverseORC, a novel RE approach able to discover diverse layout types and their dynamic resizing behaviours independently of their implementation, and to specify them by using OR constraints. Unlike previous RE approaches, ReverseORC infers flexible layout constraint specifications by sampling UIs at different sizes and analyzing the differences between them. It can create specifications that replicate even some non-standard layout managers with complex dynamic layout behaviours. We demonstrate that ReverseORC works across different platforms with very different layout approaches, e.g., for GUIs as well as for the Web. Furthermore, it can be used to detect and fix problems in legacy UIs, extend UIs with enhanced layout behaviours, and support the creation of flexible UI layouts.},
keywords = {GUI, layout, constraints},
}
@inproceedings{batmaz2021pitch,
title = {The Effect of Pitch in Auditory Error Feedback for Fitts' Tasks in Virtual Reality Training Systems},
author = {Batmaz, Anil Ufuk and Stuerzlinger, Wolfgang},
booktitle = {Conference on Virtual Reality and {3D} User Interfaces},
publisher = {IEEE},
series = {VR '21},
year = {2021},
month = {Mar},
pages = {85-94},
doi = {https://doi.org/10.1109/VR50410.2021.00029},
pdf = {papers/pitchfeedback.pdf},
teaser = {teasers/pitchfeedback.png},
abstract = {Fitts' law and the associated throughput measure characterize user pointing performance in virtual reality (VR) training systems and simulators well. Yet, pointing performance can be affected by the feedback users receive from a VR application. This work examines the effect of the pitch of auditory error feedback on user performance in a Fitts' task through a distributed experiment. In our first study, we used middle- and high-frequency sound feedback and demonstrated that high-pitch error feedback significantly decreases user performance in terms of time and throughput. In the second study, we used adaptive sound feedback, where we increased the frequency with the error rate, while asking subjects to execute the task "as fast/as precise/as fast and precise as possible". Results showed that adaptive sound feedback decreases the error rate for "as fast as possible" task execution without affecting the time. The results can be used to enhance and design various VR systems.},
keywords = {3D pointing, feedback, augmented reality, touch},
}
@inproceedings{batmaz2021auditory,
title = {Effects of Different Auditory Feedback Frequencies in Virtual Reality {3D} Pointing Tasks},
author = {Batmaz, Anil Ufuk and Stuerzlinger, Wolfgang},
booktitle = {Conference on Virtual Reality and {3D} User Interfaces, Abstracts and Workshops, Workshop on Novel Input Devices and Interaction Techniques at {VR}},
publisher = {IEEE},
series = {NIDIT '21},
year = {2021},
month = {Mar},
pages = {189-194},
doi = {https://doi.org/10.1109/VRW52623.2021.00042},
pdf = {papers/auditoryfeedback.pdf},
abstract = {Auditory error feedback is commonly used in 3D Virtual Reality (VR) pointing experiments to increase participants' awareness of their misses. However, few papers describe the parameters of the auditory feedback, such as the frequency. In this study, we asked 15 participants to perform an ISO 9241-411 pointing task in a distributed remote experiment. In our study, we used three forms of auditory feedback, i.e., C4 (262 Hz), C8 (4186 Hz) and none. According to the results, we observed a speed-accuracy trade-off for the C8 tones compared to C4 ones: subjects were slower, and their throughput performance decreased with the C8 while their error rate decreased. Still, for larger targets there was no speed-accuracy trade-off, and subjects were only slower with C8 tones. Overall, the frequency of the feedback had a significant impact on the user's performance. We thus suggest that practitioners, developers, and designers report the frequency they used in their VR applications.},
keywords = {3D pointing, feedback, virtual reality},
}
@inproceedings{batmaz2020nojitter,
title = {No Jitter Please: Effects of Rotational and Positional Jitter on {3D} Mid-Air Interaction},
author = {Batmaz, Anil Ufuk and Rajabi Seraji*, Mohammad and Kneifel*, Johanna and Stuerzlinger, Wolfgang},
booktitle = {Future Technologies Conference},
publisher = {Springer},
series = {FTC '20},
year = {2020},
month = {Nov},
volume = {AISC 1289},
commented-volume = {2},
numpages = {16},
doi = {https://doi.org/10.1007/978-3-030-63089-8_52},
pdf = {papers/nojitter.pdf},
teaser = {teasers/nojitter.png},
abstract = {Virtual Reality (VR) 3D tracking systems are susceptible to minor fluctuations in signal (jitter). In this study, we explored how different levels of jitter affect user performance for 3D pointing. We designed a Fitts' Law experiment investigating target positional jitter and cursor rotational jitter at 3 different depth distances. Performance was negatively affected when up to ± 0.5° rotational jitter was applied to the controller and up to ± 0.375 cm positional jitter was applied to the target. At 2.25 m distance, user performance did not improve with decreasing positional jitter or rotational jitter compared to the no jitter condition. Our results can inform the design of 3D user interfaces, controllers, and interaction techniques in VR. Specifically, we suggest a focus on counteracting controller rotational jitter as this would globally increase performance for ray-based selection tasks.},
keywords = {3D pointing, mid-air, jitter},
}
@inproceedings{lee2020automatic,
title = {Evaluating Automatic Parameter Control Methods for Locomotion in Multiscale Virtual Environments},
author = {Lee*, Jong-In and Asente, Paul and Kim, Byungmoon and Kim, Yeojin and Stuerzlinger, Wolfgang},
booktitle = {26th Symposium on Virtual Reality Software and Technology},
publisher = {ACM},
series = {VRST '20},
year = {2020},
month = {Nov},
articleno = {11},
numpages = {10},
doi = {https://doi.org/10.1145/3385956.3418961},
pdf = {papers/navmultiscaleve.pdf},
video = {videos/navmultiscaleve.mp4},
teaser = {teasers/navmultiscaleve.png},
abstract = {Virtual environments with a wide range of scales are becoming commonplace in Virtual Reality applications. Methods to control locomotion parameters can help users explore such environments more easily. For multi-scale virtual environments, point-and-teleport locomotion with a well-designed distance control method can enable mid-air teleportation, which makes it competitive to flying interfaces. Yet, automatic distance control for point-and-teleport has not been studied in such environments. We present a new method to automatically control the distance for point-and-teleport. In our first user study, we used a solar system environment to compare three methods: automatic distance control for point-and-teleport, manual distance control for point-and-teleport, and automatic speed control for flying. Results showed that automatic control significantly reduces overshoot compared with manual control for point-and-teleport, but the discontinuous nature of teleportation made users prefer flying with automatic speed control. We conducted a second study to compare automatic-speed-controlled flying and two versions of our teleportation method with automatic distance control, one incorporating optical flow cues. We found that point-and-teleport with optical flow cues and automatic distance control was more accurate than flying with automatic speed control, and both were equally preferred to point-and-teleport without the cues.},
keywords = {3D navigation, multiscale virtual environment, teleportation, automatic distance, speed control},
}
@inproceedings{batmaz2020eyehand,
title = {Eye-Hand Coordination Training for Sports with Mid-air {VR}},
author = {Batmaz, Anil Ufuk and Sun*, Xintian and Taskiran, Dogu and Stuerzlinger, Wolfgang},
booktitle = {26th Symposium on Virtual Reality Software and Technology},
publisher = {ACM},
series = {VRST '20},
year = {2020},
month = {Nov},
articleno = {19},
numpages = {10},
doi = {https://doi.org/10.1145/3385956.3418971},
pdf = {papers/eyehandsports.pdf},
video = {videos/eyehandsports.mp4},
teaser = {teasers/eyehandsports.png},
abstract = {A relatively recent application area for Virtual Reality (VR) systems is sports training and user performance assessment. One of these applications is eye-hand coordination training systems (EHCTSs). Previous research identified that VR-based training systems have great potential for EHCTSs. While previous work investigated 3D targets on a 2D plane, here we aim to study full 3D movements and extend the application of throughput analysis to EHCTSs. We conducted two user studies to investigate how user performance is affected by different target arrangements, feedback conditions, and handedness in VR-based EHCTSs. In the first study, we explored handedness as well as vertical and horizontal target arrangements, and showed that user performance increases with the dominant hand and a vertical target plane. In the second study, we investigated different combinations of visual and haptic feedback and how they affect user performance with different target and cursor sizes. Results illustrate that haptic feedback did not increase user performance when it is added to visual feedback. Our results inform the creation of better EHCTSs with mid-air VR systems.},
keywords = {3D pointing, eye-hand coordination, sports training},
}
@inproceedings{jiang2020orcsolver,
title = {{ORCSolver}: An Efficient Solver for Adaptive {GUI} Layout with {OR}-Constraints},
author = {Jiang*, Yue and Stuerzlinger, Wolfgang and Zwicker, Matthias and Lutteroth, Christof},
booktitle = {Conference on Human Factors in Computing Systems},
publisher = {ACM},
series = {CHI '20},
year = {2020},
month = {Apr},
articleno = {483},
numpages = {14},
doi = {https://doi.org/10.1145/3313831.3376610},
url = {https://yuejiang-nj.github.io/papers/CHI2020_ORCSolver/project_page.html},
pdf = {papers/orcsolver.pdf},
video = {https://youtu.be/0S77vVG8btE},
teaser = {teasers/orcsolver.png},
abstract = {OR-constrained (ORC) graphical user interface layouts unify conventional constraint-based layouts with flow layouts, which enables the definition of flexible layouts that adapt to screens with different sizes, orientations, or aspect ratios with only a single layout specification. Unfortunately, solving ORC layouts with current solvers is time-consuming and the needed time increases exponentially with the number of widgets and constraints. To address this challenge, we propose ORCSolver, a novel solving technique for adaptive ORC layouts, based on a branch-and-bound approach with heuristic preprocessing. We demonstrate that ORCSolver simplifies ORC specifications at runtime and our approach can solve ORC layout specifications efficiently at near-interactive rates.},
keywords = {GUI, layout, constraints},
}
@inproceedings{putze2020eegautocorrect,
title = {Platform for Studying Self-Repairing Auto-Corrections in Mobile Text Entry Based on Brain Activity, Gaze, and Context},
author = {Putze, Felix and Ihrig*, Tilman and Schultz, Tanja and Stuerzlinger, Wolfgang},
booktitle = {Conference on Human Factors in Computing Systems},
publisher = {ACM},
series = {CHI '20},
year = {2020},
month = {Apr},
numpages = {13},
doi = {https://doi.org/10.1145/3313831.3376815},
pdf = {papers/eegautocorrect.pdf},
teaser = {teasers/eegautocorrect.png},
abstract = {Auto-correction is a standard feature of mobile text entry. While the performance of state-of-the-art auto-correct methods is usually relatively high, any errors that occur are cumbersome to repair, interrupt the flow of text entry, and challenge the user's agency over the process. In this paper, we describe a system that aims to automatically identify and repair auto-correction errors. This system comprises a multi-modal classifier for detecting auto-correction errors from brain activity, eye gaze, and context information, as well as a strategy to repair such errors by replacing the erroneous correction or suggesting alternatives. We integrated both parts in a generic Android component and thus present a research platform for studying self-repairing end-to-end systems. To demonstrate its feasibility, we performed a user study to evaluate the classification performance and usability of our approach.},
keywords = {autocorrect, EEG, errors, text entry},
}
@inproceedings{batmaz2020grip,
title = {Precision vs. Power Grip: A Comparison of Pen Grip Styles for Selection in Virtual Reality},
author = {Batmaz, Anil Ufuk and Mutasim*, Aunnoy K. and Stuerzlinger, Wolfgang},
booktitle = {Conference on Virtual Reality and {3D} User Interfaces, Abstracts and Workshops, Workshop on Novel Input Devices and Interaction Techniques at {VR}},
publisher = {IEEE},
series = {NIDIT '20},
year = {2020},
month = {Mar},
pages = {23-28},
doi = {https://doi.org/10.1109/VRW50115.2020.00012},
pdf = {papers/precisiongrip.pdf},
abstract = {While commercial Virtual Reality (VR) controllers are mostly designed to be held in a power grip, previous research showed that using pen-like devices with a precision grip can improve user performance for selection in VR, potentially even matching that achievable with a mouse. However, it is not known if the improvement is due to the grip style. In this work, 12 subjects performed a Fitts' task at 3 different depth conditions with a pen-like input device used in both a precision and power grip. Our results identify that the precision grip significantly improves user performance in VR through a significant reduction in error rate, but we did not observe a significant effect of the distance of targets from the user. We believe that our results are useful for designers and researchers to improve the usability of and user performance in VR systems.},
keywords = {3D pointing, grip},
}
@inproceedings{batmaz2020touch,
title = {Touch the Wall: Comparison of Virtual and Augmented Reality with Conventional {2D} Screen Eye-hand Coordination Training Systems},
author = {Batmaz, Anil Ufuk and Mutasim*, Aunnoy K. and Malekmakan*, Morteza and Sadr*, Elham and Stuerzlinger, Wolfgang},
booktitle = {Conference on Virtual Reality and {3D} User Interfaces},
publisher = {IEEE},
series = {VR '20},
year = {2020},
month = {Mar},
pages = {184-193},
doi = {https://doi.org/10.1109/VR46266.2020.1581205539914},
pdf = {papers/touchthewall.pdf},
teaser = {teasers/touchthewall.png},
abstract = {Previous research on eye-hand coordination training systems has investigated user performance on a wall, 2D touchscreens, and in Virtual Reality (VR). In this paper, we designed an eye-hand coordination reaction test to investigate and compare user performance in three different virtual environments (VEs) – VR, Augmented Reality (AR), and a 2D touchscreen. VR and AR conditions also included two feedback conditions – mid-air and passive haptics. Results showed that compared to AR, participants were significantly faster and made fewer errors both in 2D and VR. However, compared to VR and AR, throughput performance of the participants was significantly higher in the 2D touchscreen condition. No significant differences were found between the two feedback conditions. The results show the importance of assessing precision and accuracy in eye-hand coordination training and suggest that it is currently not advisable to use AR headsets in such systems.},
keywords = {3D pointing, eye-hand coordination, mid-air, passive haptics, augmented reality, touch},
}
@inproceedings{pham2019mightypen,
title = {Is the Pen Mightier than the Controller? A Comparison of Input Devices for Selection in Virtual and Augmented Reality},
author = {Pham*, Duc-Minh and Stuerzlinger, Wolfgang},
booktitle = {25th Symposium on Virtual Reality Software and Technology},
publisher = {ACM},
series = {VRST '19},
year = {2019},
month = {Nov},
articleno = {35},
numpages = {11},
doi = {https://doi.org/10.1145/3359996.3364264},
pdf = {papers/mightypen.pdf},
teaser = {teasers/mightypen.png},
abstract = {Controllers are currently the typical input device for commercial Virtual Reality (VR) systems. Yet, such controllers are not as efficient as other devices, including the mouse. This motivates us to investigate devices that substantially exceed the controller's performance, for both VR and Augmented Reality (AR) systems. We performed a user study to compare several input devices, including a mouse, controller, and a 3D pen-like device on a VR and AR pointing task. Our results show that the 3D pen significantly outperforms modern VR controllers in all evaluated measures and that it is comparable to the mouse. Participants also liked the 3D pen more than the controller. Finally, we show how 3D pen devices could be integrated into today's VR and AR systems.},
keywords = {3D pointing, input device},
}
@inproceedings{batmaz2019hittingwall,
title = {Hitting the Wall: Mid-Air Interaction for Eye-Hand Coordination},
author = {Batmaz, Anil Ufuk and Sun*, Xintian and Taskiran, Dogu and Stuerzlinger, Wolfgang},
booktitle = {25th Symposium on Virtual Reality Software and Technology},
publisher = {ACM},
series = {VRST '19},
year = {2019},
month = {Nov},
articleno = {30},
numpages = {5},
doi = {https://doi.org/10.1145/3359996.3364249},
pdf = {papers/hittingthewall.pdf},
video = {videos/hittingthewall.mp4},
teaser = {teasers/hittingthewall.png},
abstract = {Reaction time training systems are used to improve user performance. Until now, such setups use physical 2D flat surfaces, e.g., a 2D touch screen or buttons mounted on a wall. We designed and investigated a mid-air reaction time training system with an immersive virtual reality (VR) headset. 12 participants performed an eye-hand coordination reaction test in three conditions: both in mid-air with or without VR controller as well as with passive haptic feedback through hitting a soft-surface wall. We also altered target and cursor sizes and used a Fitts' law task to analyze user performance. According to the results, subjects were slower and their throughput was lower when they hit a solid surface to interact with virtual targets. Our results show that Fitts's model can be applied to these systems to measure and assess participant training.},
keywords = {3D pointing, mid-air, passive haptics, eye-hand coordination, augmented reality},
}
@inproceedings{machuca2019smart3dguides,
title = {{Smart3DGuides}: Making Unconstrained Immersive {3D} Drawing More Accurate},
author = {Barrera Machuca*, Mayra D. and Stuerzlinger, Wolfgang and Asente, Paul},
booktitle = {25th Symposium on Virtual Reality Software and Technology},
publisher = {ACM},
series = {VRST '19},
year = {2019},
month = {Nov},
articleno = {37},
numpages = {13},
doi = {https://doi.org/10.1145/3359996.3364254},
pdf = {papers/smart3dguides.pdf},
video = {videos/smart3dguides.mp4},
teaser = {teasers/smart3dguides.png},
abstract = {Most current commercial Virtual Reality (VR) drawing applications for creativity rely on freehand 3D drawing as their main interaction paradigm. However, the presence of the additional third dimension makes accurate freehand drawing challenging. Some systems address this problem by constraining or beautifying user strokes, which can be intrusive and can limit the expressivity of freehand drawing. In this paper, we evaluate the effectiveness of relying solely on visual guidance to increase overall drawing shape-likeness. We identified a set of common mistakes that users make while creating freehand strokes in VR and then designed a set of visual guides, the Smart3DGuides, which help users avoid these mistakes. We evaluated Smart3DGuides in two user studies, and our results show that non-constraining visual guides help users draw more accurately.},
keywords = {3D drawing, 3D sketching, 3D user interfaces, 3D modeling},
}
@inproceedings{pham2019hawkey,
title = {{HawKEY}: Efficient and Versatile Text Entry for Virtual Reality},
author = {Pham*, Duc-Minh and Stuerzlinger, Wolfgang},
booktitle = {25th Symposium on Virtual Reality Software and Technology},
publisher = {ACM},
series = {VRST '19},
year = {2019},
month = {Nov},
articleno = {21},
numpages = {11},
doi = {https://doi.org/10.1145/3359996.3364265},
pdf = {papers/hawkey.pdf},
teaser = {teasers/hawkey.png},
abstract = {Text entry is still a challenging task in modern Virtual Reality (VR) systems. The lack of efficient text entry methods limits the applications that can be used productively in VR. Previous work has addressed this issue through virtual keyboards or showing the physical keyboard in VR. While physical keyboards afford faster text entry, they usually require a seated user and an instrumented environment. We introduce a new keyboard, worn on a hawker's tray in front of the user, which affords a compact, simple, flexible, and efficient text entry solution for VR, without restricting physical movement. In our new video condition, we also show the keyboard only when the user is looking down at it. To evaluate our novel solution and to identify good keyboard visualizations, we ran a user study where we asked participants to enter both lowercase sentences as well as complex text while standing. The results show that text entry rates are affected negatively by simplistic keyboard visualization conditions and that our solution affords desktop text entry rates, even when standing.},
keywords = {3D user interfaces, text entry, augmented reality},
}
@inproceedings{sun2019sliding,
title = {Extended Sliding in Virtual Reality},
author = {Sun*, Junwei and Stuerzlinger, Wolfgang},
booktitle = {25th Symposium on Virtual Reality Software and Technology},
publisher = {ACM},
series = {VRST '19},
year = {2019},
month = {Nov},
articleno = {38},
numpages = {5},
doi = {https://doi.org/10.1145/3359996.3364251},
pdf = {papers/extendedsliding.pdf},
video = {videos/extendedsliding.mp4},
teaser = {teasers/extendedsliding.png},
abstract = {Although precise 3D positioning is not always necessary in virtual environments, it is still an important task for current and future applications of Virtual Reality (VR), including 3D modelling, engineering, and scientific applications. We focus on 3D positioning techniques in immersive environments that use a 6DOF controller as input device and present a new technique that improves 3D positioning performance in VR, in both speed and accuracy. Towards this goal, we adapted an extended sliding technique to VR systems with a controller as input device and compared it with previously presented 3DOF positioning techniques. The results showed that our new Extended VR Sliding technique significantly improved the accuracy for 3D positioning tasks, especially for targets in contact with the scene.},
keywords = {3D manipulation, 3D positioning, sliding},
}
@inproceedings{hayatpur2019planeraypoint,
title = {Plane, Ray, and Point: Enabling Precise Spatial Manipulations with Shape Constraints},
author = {Hayatpur+, Devamardeep and Heo, Seongkook and Xia, Haijun and Stuerzlinger, Wolfgang and Wigdor, Daniel},
booktitle = {32nd Annual Symposium on User Interface Software and Technology},
publisher = {ACM},
series = {UIST '19},
year = {2019},
month = {Oct},
pages = {1185–1195},
doi = {https://doi.org/10.1145/3332165.3347916},
pdf = {papers/planeraypoint.pdf},
video = {videos/planeraypoint.mp4},
teaser = {teasers/planeraypoint.png},
abstract = {We present Plane, Ray, and Point, a set of interaction techniques that utilizes shape constraints to enable quick and precise object alignment and manipulation in virtual reality. Users create the three types of shape constraints, Plane, Ray, and Point, by using symbolic gestures. The shape constraints are used like scaffoldings and limit and guide the movement of virtual objects that collide or intersect with them. The same set of gestures can be performed with the other hand, which allow users to further control the degrees of freedom for precise and constrained manipulation. The combination of shape constraints and bimanual gestures yield a rich set of interaction techniques to support object transformation. An exploratory study conducted with 3D design experts and novice users found the techniques to be useful in 3D scene design workflows and easy to learn and use.},
keywords = {3D manipulation},
}
@inproceedings{machuca2019spatial,
title = {The Effect of Spatial Ability on Immersive {3D} Drawing},
author = {Barrera Machuca*, Mayra D. and Stuerzlinger, Wolfgang and Asente, Paul},
booktitle = {Conference on Creativity and Cognition},
publisher = {ACM},
series = {C&C '19},
year = {2019},
month = {Jun},
pages = {173–186},
doi = {https://doi.org/10.1145/3325480.3325489},
pdf = {papers/drawingspatialability.pdf},
teaser = {teasers/drawingspatialability.png},
abstract = {Virtual Reality (VR) headsets have made immersive 3D drawing available to the general public. However, compared to 2D drawing, the presence of an additional dimension makes sketching in VR challenging, since creating precise strokes that are positioned as intended in all three dimensions imposes higher demands on the users' perception, motor and spatial skills. Another challenge users face is creating accurate shapes in which strokes are positioned correctly relative to previous ones, as they may need to use different views to plan their next hand movement. In this paper, we analyze the behaviours of users with different spatial abilities while drawing in VR. Our results indicate that there are different types of behaviours that affect different aspects of the sketches. We also found that the user's spatial ability affects the shape of the drawing, but not the line precision. Finally, we give recommendations for designing 3D drawing interfaces.},
keywords = {virtual reality, 3D sketching, 3D drawing, 3D modeling, spatial cognition},
}
@inproceedings{papoi20193dspeedcontrol,
title = {Improved Automatic Speed Control for {3D} Navigation},
author = {Papoi*, Domi and Stuerzlinger, Wolfgang},
booktitle = {Advances in Computer Graphics},
publisher = {Springer},
series = {CGI '19},
year = {2019},
month = {Jun},
volume = {LNCS 11542},
pages = {278-290},
doi = {https://doi.org/10.1007/978-3-030-22514-8_23},
pdf = {papers/navspeed.pdf},
video = {videos/navspeed.mp4},
teaser = {teasers/navspeed.png},
abstract = {As technology progresses, it is possible to increase the size and complexity of 3D virtual environments. Thus, we need deal with multiscale virtual environments today. Ideally, the user should be able to navigate such environments efficiently and robustly, which requires control of the user speed during navigation. Manual speed control across multiple scales of magnitude suffers from issues such as overshooting behaviors and introduces additional complexity. Most previously presented methods to automatically control the speed of navigation do not generalize well to environments with varying scales. We present an improved method to automatically control the speed of the user in 3D virtual environment navigation. The main benefit of our approach is that it automatically adapts the navigation speed in a manner that enables efficient navigation with maximum freedom, while still avoiding collisions. The results of a usability test show a significant reduction in completion time for a multi-scale navigation task.},
keywords = {3D navigation, speed control},
note = {Computer Graphics International},
}
@inproceedings{blum2019immersiveanalytics,
title = {Immersive Analytics Sensemaking on Different Platforms},
author = {Blum*, Sebastian and Cetin*, Gokhan and Stuerzlinger, Wolfgang},
booktitle = {Winter School of Computer Graphics},
series = {WSCG '19, CSRN 2902},
issn = {2464-4617},
year = {2019},
month = {Jan},
pages = {69-80},
url = {http://wscg.zcu.cz/DL/wscg_DL.htm},
doi = {https://doi.org/10.24132/CSRN.2019.2902.2.9},
pdf = {papers/VAonLHRD+VR.pdf},
teaser = {teasers/VAonLHRD+VR.png},
abstract = {In this work we investigated sensemaking activities on different immersive platforms. We observed user behaviours during a classification task on a very large wall-display system (experiment I) and in a modern Virtual Reality headset (experiment II). In experiment II, we also evaluated a condition with a VR headset with an extended field of view, through a sparse peripheral display. We evaluated the results across the two studies by analyzing quantitative and qualitative data, such as task completion time, number of classifications, followed strategies, and shape of clusters. The results showed differences in user behaviours between the different immersive platforms, i.e., the very large display wall and the VR headset. Even though quantitative data showed no significant differences, qualitatively, users used additional strategies on the wall-display, which hints at a deeper level of sensemaking compared to a VR Headset. The qualitative and quantitative results of the comparison between VR Headsets do not indicate that users perform differently with a VR Headset with an extended field of view.},
keywords = {immersive analytics, virtual reality, large display system, immersive display system, large display interaction, V4Space},
}
@inproceedings{alharbi2019wisetype,
title = {{WiseType}: A Tablet Keyboard with Color-Coded Visualization and Various Editing Options for Error Correction},
author = {Alharbi*, Ohoud and Arif, Ahmed Sabbir and Stuerzlinger, Wolfgang and Dunlop, Mark D. and Komninos, Andreas},
booktitle = {Graphics Interface},
series = {GI '19},
year = {2019},
month = {May},
articleno = {4},
numpages = {10},
doi = {https://doi.org/10.20380/GI2019.04},
pdf = {papers/wisetype.pdf},
video = {videos/wisetype.mp4},
teaser = {teasers/wisetype.png},
abstract = {To address the problem of improving text entry accuracy in mobile devices, we present a new tablet keyboard that offers both immediate and delayed feedback on language quality through auto-correction, prediction, and grammar checking. We combine different visual representations for grammar and spelling errors, accepted predictions, and auto-corrections. and also support interactive swiping/tapping features and improved interaction with previous errors, predictions, and auto-corrections. Additionally, we added smart error correction features to the system to decrease the overhead of correcting errors and to decrease the number of operations. We designed our new input method with an iterative user-centered approach through multiple pilots. We conducted a lab-based study with a refined experimental methodology and found that WiseType outperforms a standard keyboard in terms of text entry speed and error rate. The study shows that color-coded text background highlighting and underlining of potential mistakes in combination with fast correction methods can improve both writing speed and accuracy.},
keywords = {text entry, autocorrect, errors},
award = {This work received a Michael J Sweeney Best HCI Student Paper Award},
}
@inproceedings{sun2019selecting,
title = {Selecting and Sliding Hidden Objects in {3D} Desktop Environments},
author = {Sun*, Junwei and Stuerzlinger, Wolfgang},
booktitle = {Graphics Interface},
series = {GI '19},
year = {2019},
month = {May},
articleno = {8},
numpages = {8},
doi = {https://doi.org/10.20380/GI2019.08},
pdf = {papers/transparency.pdf},
video = {videos/transparency.mp4},
teaser = {teasers/transparency.png},
abstract = {Selecting and positioning objects in 3D space are fundamental tasks in 3D user interfaces. We present two new techniques to improve 3D selection and positioning. We first augment 3D user interfaces with a new technique that enables users to select objects that are hidden from the current viewpoint. This layer-based technique for selecting hidden objects works for arbitrary objects and scenes. We then also extend a mouse-based sliding technique to work even if the manipulated object is hidden behind other objects, by making the manipulated object always fully visible through a transparency mask during drag-and-drop positioning. Our user study shows that with the new techniques, users can easily select hidden objects and that sliding with transparency performs faster than the common 3D widgets technique.},
keywords = {3D manipulation, 3D positioning, sliding, transparency},
}
@inproceedings{machuca2019stereo,
title = {The Effect of Stereo Display Deficiencies on Virtual Hand Pointing},
author = {Barrera Machuca*, Mayra D. and Stuerzlinger, Wolfgang},
booktitle = {Conference on Human Factors in Computing Systems},
publisher = {ACM},
series = {CHI '19},
year = {2019},
month = {May},
articleno = {207},
numpages = {14},
doi = {https://doi.org/10.1145/3290605.3300437},
pdf = {papers/virtualhandfitts.pdf},
video = {videos/virtualhandfitts.mp4},
teaser = {teasers/virtualhandfitts.png},
abstract = {The limitations of stereo display systems affect depth perception, e.g., due to the vergence-accommodation conflict or diplopia. We performed three studies to understand how stereo display deficiencies impact 3D pointing for targets in front of a screen and close to the user, i.e., in peripersonal space. Our first two experiments compare movements with and without a change in visual depth for virtual respectively physical targets. Results indicate that selecting targets along the depth axis is slower and has less throughput for virtual targets, while physical pointing demonstrates the opposite result. We then propose a new 3D extension for Fitts' law that models the effect of stereo display deficiencies. Next, our third experiment verifies the model and measures more broadly how the change in visual depth between targets affects pointing performance in peripersonal space and confirms significant effects on time and throughput. Finally, we discuss implications for 3D user interface design.},
keywords = {3D pointing, mid-air, stereo},
}
@inproceedings{yamanaka2019lassomodel,
title = {Modeling Fully and Partially Constrained Lasso Movements in a Grid of Icons},
author = {Yamanaka, Shota and Stuerzlinger, Wolfgang},
booktitle = {Conference on Human Factors in Computing Systems},
publisher = {ACM},
series = {CHI '19},
year = {2019},
month = {May},
articleno = {120},
numpages = {12},
doi = {https://doi.org/10.1145/3290605.3300350},
pdf = {papers/gridlassomodel.pdf},
teaser = {teasers/gridlassomodel.png},
abstract = {Lassoing objects is a basic function in illustration software and presentation tools. Yet, for many common object arrangements lassoing is sometimes time-consuming to perform and requires precise pen operation. In this work, we studied lassoing movements in a grid of objects similar to icons. We propose a quantitative model to predict the time to lasso such objects depending on the margins between icons, their sizes, and layout, which all affect the number of stopping and crossing movements. Results of two experiments showed that our models predict fully and partially constrained movements with high accuracy. We also analyzed the speed profiles and pen stroke trajectories and identified deeper insights into user behaviors, such as that an unconstrained area can induce higher movement speeds even in preceding path segments.},
keywords = {lasso, steering, group selection},
}
@inproceedings{jiang2019orclayout,
title = {{ORC} Layout: Adaptive {GUI} Layout with {OR}-Constraints},
author = {Jiang*, Yue and Du*, Ruofei and Lutteroth, Christof and Stuerzlinger, Wolfgang},
booktitle = {Conference on Human Factors in Computing Systems},
publisher = {ACM},
series = {CHI '19},
year = {2019},
month = {May},
articleno = {413},
numpages = {12},
doi = {https://doi.org/10.1145/3290605.3300643},
pdf = {papers/orclayout.pdf},
video = {videos/orclayout.mp4},
teaser = {teasers/orclayout.png},
abstract = {We propose a novel approach for constraint-based graphical user interface (GUI) layout based on OR-constraints (ORC) in standard soft/hard linear constraint systems. ORC layout unifies grid layout and flow layout, supporting both their features as well as cases where grid and flow layouts individually fail. We describe ORC design patterns that enable designers to safely create flexible layouts that work across different screen sizes and orientations. We also present the ORC Editor, a GUI editor that enables designers to apply ORC in a safe and effective manner, mixing grid, flow and new ORC layout features as appropriate. We demonstrate that our prototype can adapt layouts to screens with different aspect ratios with only a single layout specification, easing the burden of GUI maintenance. Finally, we show that ORC specifications can be modified interactively and solved efficiently at runtime.},
keywords = {GUI, layout, constraints},
}
@inproceedings{kruijff2019flexurface,
title = {Multilayer Haptic Feedback for Pen-Based Tablet Interaction},
author = {Kruijff, Ernst and Biswas*, Saugata and Trepkowski*, Christina and Maiero*, Jens and Ghinea, George and Stuerzlinger, Wolfgang},
booktitle = {Conference on Human Factors in Computing Systems},
publisher = {ACM},
series = {CHI '19},
year = {2019},
month = {May},
articleno = {143},
numpages = {14},
doi = {https://doi.org/10.1145/3290605.3300373},
pdf = {papers/flexurface.pdf},
video = {videos/flexurface.mp4},
teaser = {teasers/flexurface.png},
abstract = {We present a novel, multilayer interaction approach that enables state transitions between spatially above-screen and 2D on-screen feedback layers. This approach supports the exploration of haptic features that are hard to simulate using rigid 2D screens. We accomplish this by adding a haptic layer above the screen that can be actuated and interacted with (pressed on) while the user interacts with on-screen content using pen input. The haptic layer provides variable firmness and contour feedback, while its membrane functionality affords additional tactile cues like texture feedback. Through two user studies, we look at how users can use the layer in haptic exploration tasks, showing that users can discriminate well between different firmness levels, and can perceive object contour characteristics. Demonstrated also through an art application, the results show the potential of multilayer feedback to extend on-screen feedback with additional widget, tool and surface properties, and for user guidance.},
keywords = {haptics, multilayer, pen},
}
@inproceedings{batmaz2019nidit,
title = {Effects of {3D} Rotational Jitter and Selection Methods on {3D} Pointing Tasks},
author = {Batmaz, Anil Ufuk and Stuerzlinger, Wolfgang},
booktitle = {Workshop on Novel Input Devices and Interaction Techniques at {VR}},
publisher = {IEEE},
series = {NIDIT '19},
year = {2019},
month = {Mar},
pages = {1687-1692},
doi = {https://doi.org/10.1109/VR.2019.8798038},
pdf = {papers/rotjitterselection.pdf},
abstract = {3D pointing is an integral part of Virtual Reality interaction. Typical pointing devices rely on 3D trackers and are thus subject to fluctuations in the reported pose, i.e., jitter. In this work, we explored how different levels of rotational jitter affect pointing performance and if different selection methods can mitigate the effects of jitter. Towards this, we designed a Fitts' Law experiment with three selection methods. In the first method, subjects used a single controller to position and select the object. In the second method, subjects used the controller in their dominant hand to point at objects and the trigger button of a second controller, held in their non-dominant hand, to select objects. Finally, subjects used the controller in their dominant hand to point the objects and pressed the space bar on a keyboard to select the object in the third condition. During the pointing task we added five different levels of jitter: no jitter, ±0.5°, ±1°, and ±2° uniform noise, as well as White Gaussian noise with 1° standard deviation. Results showed that the Gaussian noise and ±2° of jitters significantly reduced the throughput of the participants. Moreover, subjects made fewer errors when they performed the experiment with two controllers. Our results inform the design of 3D user interfaces, input devices and interaction techniques.},
keywords = {3D pointing, jitter},
}
@inproceedings{batmaz2019stereo,
title = {Do Head-Mounted Display Stereo Deficiencies Affect {3D} Pointing Tasks in {AR} and {VR}?},
author = {Batmaz, Anil Ufuk and Barrera Machuca*, Mayra D. and Pham*, Duc-Minh and Stuerzlinger, Wolfgang},
booktitle = {Conference on Virtual Reality and {3D} User Interfaces},
publisher = {IEEE},
series = {VR '19},
year = {2019},
month = {Mar},
pages = {585-592},
doi = {https://doi.org/10.1109/VR.2019.8797975},
pdf = {papers/virtualhandARVR.pdf},
video = {videos/virtualhandARVR.mp4},
teaser = {teasers/virtualhandARVR.png},
abstract = {Most AR and VR headsets use stereoscopic displays to show virtual objects in 3D. However, the limitations of current stereo display systems affect depth perception through conflicting depth cues, which then also affect virtual hand interaction in peri-personal space, i.e., within arm's reach. We performed a Fitts' law experiment to better understand the impact of stereo display deficiencies of AR and VR headsets on pointing at close-by targets arranged laterally or along the line of sight. According to our results, the movement direction and the corresponding change in target depth affect pointing time and throughput; subjects' movements towards/away from their head were slower and less accurate than their lateral movements (left/right). However, even though subjects moved faster in AR, we did not observe a significant difference for pointing performance between AR and VR headsets, which means that previously identified differences in depth perception between these platforms seem to have no strong effect on interaction. Our results also help 3D user interface designers understand how changes in target depth affect users' performance in different movement directions in AR and VR.},
keywords = {3D pointing, mid-air, stereo},
}
@inproceedings{marquardt2018audiotactile,
title = {Audio-Tactile Proximity Feedback for Enhancing {3D} Manipulation},
author = {Marquardt*, Alexander and Kruijff, Ernst and Trepkowski*, Christina and Maiero*, Jens and Schwandt, Andrea and Hinkenjann, André and Stuerzlinger, Wolfgang and Schöning, Johannes},
booktitle = {24th Symposium on Virtual Reality Software and Technology},
publisher = {ACM},
series = {VRST '18},
year = {2018},
month = {Nov},
articleno = {2},
numpages = {10},
doi = {https://doi.org/10.1145/3281505.3281525},
pdf = {papers/tactaproximity.pdf},
teaser = {teasers/tactaproximity.png},
abstract = {In presence of conflicting or ambiguous visual cues in complex scenes, performing 3D selection and manipulation tasks can be challenging. To improve motor planning and coordination, we explore audio-tactile cues to inform the user about the presence of objects in hand proximity, e.g., to avoid unwanted object penetrations. We do so through a novel glove-based tactile interface, enhanced by audio cues. Through two user studies, we illustrate that proximity guidance cues improve spatial awareness, hand motions, and collision avoidance behaviors, and show how proximity cues in combination with collision and friction cues can significantly improve performance.},
keywords = {haptics, tactile feedback, 3D manipulation},
}
@inproceedings{marquardt2018guidance,
title = {Tactile Hand Motion and Pose Guidance for {3D} Interaction},
author = {Marquardt*, Alexander and Maiero*, Jens and Kruijff, Ernst and Trepkowski*, Christina and Schwandt, Andrea and Hinkenjann, André and Schöning, Johannes and Stuerzlinger, Wolfgang},
booktitle = {24th Symposium on Virtual Reality Software and Technology},
publisher = {ACM},
series = {VRST '18},
year = {2018},
month = {Nov},
articleno = {3},
numpages = {10},
doi = {https://doi.org/10.1145/3281505.3281526},
pdf = {papers/tactaguide.pdf},
video = {videos/tactaguide.mp4},
teaser = {teasers/tactaguide.png},
abstract = {We present a novel forearm-and-glove tactile interface that can enhance 3D interaction by guiding hand motor planning and coordination. In particular, we aim to improve hand motion and pose actions related to selection and manipulation tasks. Through our user studies, we illustrate how tactile patterns can guide the user, by triggering hand pose and motion changes, for example to grasp (select) and manipulate (move) an object. We discuss the potential and limitations of the interface, and outline future work.},
keywords = {haptics, guidance, tactile feedback, 3D manipulation},
}
@inproceedings{cetin2018valarge,
title = {Visual Analytics on Large Displays: Exploring User Spatialization and How Size and Resolution Affect Task Performance},
author = {Cetin*, Gokhan and Stuerzlinger, Wolfgang and Dill, John},
booktitle = {Symposium on Big Data Visual Analytics},
publisher = {IEEE},
series = {BDVA '18},
year = {2018},
month = {Oct},
pages = {21-30},
doi = {https://doi.org/10.1109/BDVA.2018.8534027},
pdf = {papers/space2VA.pdf},
teaser = {teasers/space2VA.png},
abstract = {Large, high-resolution displays (LHRDs) have been shown to enable increased productivity over conventional monitors. Previous work has identified the benefits of LHRDs for Visual Analytics tasks, where the user is analyzing complex data sets. However, LHRDs are fundamentally different from desktop and mobile computing environments, presenting some unique usability challenges and opportunities, and need to be better understood. There is thus a need for additional studies to analyze the impact of LHRD size and display resolution on content spatialization strategies and Visual Analytics task performance. We present the results of two studies of the effects of physical display size and resolution on analytical task successes and also analyze how participants spatially cluster visual content in different display conditions. Overall, we found that navigation technique preferences differ significantly among users, that the wide range of observed spatialization types suggest several different analysis techniques are adopted, and that display size affects clustering task performance whereas display resolution does not.},
keywords = {visual analytics, visualization, large display system, large display interaction, V4Space},
}
@inproceedings{elmeseery2018dynspace,
title = {Multiple Workspaces in Visual Analytics},
author = {El Meseery*, Maha and Wu*, Yuyao and Stuerzlinger, Wolfgang},
booktitle = {Symposium on Big Data Visual Analytics},
publisher = {IEEE},
series = {BDVA '18},
year = {2018},
month = {Oct},
pages = {70-81},
doi = {https://doi.org/10.1109/BDVA.2018.8534019},
pdf = {papers/dynspace.pdf},
video = {videos/dynspace.mp4},
teaser = {teasers/dynspace.png},
abstract = {Exploratory visual analysis is an iterative process, where analysts often start from an overview of the data. Subsequently, they often pursue different hypotheses through multiple rounds of interaction and analysis. Commercial visualization packages support mostly a model with a single analysis path, where the system view represents only the final state of the users' current analysis. In this paper, we investigate the benefit of using multiple workspaces to support alternative analyses, enabling users to create different workspaces to pursue multiple analysis paths at the same time. We implemented a prototype for multiple workspaces using a multi-tab design in a visual analytics system. The results of our user studies show that multiple workspaces: enable analysts to work on concurrent tasks, work well for organizing an analysis, and make it easy to revisit previous parts of their work.},
keywords = {visual analytics, visualization, alternatives, scenarios},
}
@inproceedings{machuca2018multiplanes,
title = {Multiplanes: Assisted Freehand VR Sketching},
author = {Barrera Machuca*, Mayra D. and Asente, Paul and Lu*, Jingwan and Kim, Byungmoon and Stuerzlinger, Wolfgang},
booktitle = {Symposium on Spatial User Interaction},
publisher = {ACM},
series = {SUI '18},
year = {2018},
month = {Oct},
pages = {36-47},
doi = {https://doi.org/10.1145/3267782.3267786},
pdf = {papers/multiplanes.pdf},
video = {videos/multiplanes.mp4},
teaser = {teasers/multiplanes.png},
abstract = {The presence of a third dimension makes accurate drawing in virtual reality (VR) more challenging than 2D drawing. These challenges include higher demands on spatial cognition and motor skills, as well as the potential for mistakes caused by depth perception errors. We present Multiplanes, a VR drawing system that supports both the flexibility of freehand drawing and the ability to draw accurate shapes in 3D by affording both planar and beautified drawing. The system was designed to address the above-mentioned challenges. Multiplanes generates snapping planes and beautification trigger points based on previous and current strokes and the current controller pose. Based on geometrical relationships to previous strokes, beautification trigger points serve to guide the user to reach specific positions in space. The system also beautifies user's strokes based on the most probable intended shape while the user is drawing them. With Multiplanes, in contrast to other systems, users do not need to manually activate such guides, allowing them to focus on the creative process.},
keywords = {3D sketching, 3D drawing, 3D modeling, 3D user interfaces},
}
@inproceedings{sun2018comparing,
title = {Comparing Input Methods and Cursors for {3D} Positioning with Head-Mounted Displays},
author = {Sun*, Junwei and Stuerzlinger, Wolfgang and Riecke, Bernhard E.},
booktitle = {15th Symposium on Applied Perception},
publisher = {ACM},
series = {SAP '18},
year = {2018},
month = {Aug},
articleno = {8},
numpages = {8},
doi = {https://doi.org/10.1145/3225153.3225167},
pdf = {papers/input4VR.pdf},
teaser = {teasers/input4VR.png},
abstract = {Moving objects is an important task in 3D user interfaces. In this work, we focus on (precise) 3D object positioning in immersive virtual reality systems, especially head-mounted displays (HMDs). To evaluate input method performance for 3D positioning, we focus on an existing sliding algorithm, in which objects slide on any contact surface. Sliding enables rapid positioning of objects in 3D scenes on a desktop system but is yet to be evaluated in an immersive system. We performed a user study that compared the efficiency and accuracy of different input methods (mouse, hand-tracking, and trackpad) and cursor display conditions (stereo cursor and one-eyed cursor) for 3D positioning tasks with the HTC Vive. The results showed that the mouse outperformed hand-tracking and the trackpad, in terms of efficiency and accuracy. Stereo cursor and one-eyed cursor did not demonstrate a significant difference in performance, yet the stereo cursor condition was rated more favourable. For situations where the user is seated in immersive VR, the mouse is thus still the best input device for precise 3D positioning.},
keywords = {3D positioning, input device},
}
@inproceedings{yamanaka2018steering,
title = {Steering Through Successive Objects},
author = {Yamanaka*, Shota and Stuerzlinger, Wolfgang and Miyashita, Homei},
booktitle = {Conference on Human Factors in Computing Systems},
publisher = {ACM},
series = {CHI '18},
year = {2018},
month = {Apr},
articleno = {603},
numpages = {13},
doi = {https://doi.org/10.1145/3173574.3174177},
pdf = {papers/steervscross.pdf},
teaser = {teasers/steervscross.png},
abstract = {We investigate stroking motions through successive objects with styli. There are several promising models for stroking motions, such as crossing tasks, which require endpoint accuracy of a stroke, or steering tasks, which require continuous accuracy throughout the trajectory. However, a task requiring users to repeatedly steer through constrained path segments has never been studied, although such operations are needed in GUIs, e.g., for selecting icons or objects on illustration software through lassoing. We empirically confirmed that the interval, trajectory width, and obstacle size significantly affect the movement speed. Existing models can not accurately predict user performance in such tasks. We found several unexpected results such as that steering through denser objects sometimes required less times than expected. Speed profile analysis showed the reasons behind such behaviors, such as participants' anticipation strategies. We also discuss the applicability of exiting performance models and revisions.},
keywords = {steering, lasso, group selection},
}
@inproceedings{ortega2018wiggle,
title = {Pointing at Wiggle {3D} Displays},
author = {Ortega, Michael and Stuerzlinger, Wolfgang},
booktitle = {Conference on Virtual Reality and {3D} User Interfaces},
publisher = {IEEE},
series = {VR '18},
year = {2018},
month = {Mar},
pages = {335-340},
doi = {https://doi.org/10.1109/VR.2018.8447552},
pdf = {papers/wigglepoint.pdf},
video = {videos/wigglepoint.m4v},
teaser = {teasers/wigglepoint.png},
abstract = {This paper presents two new pointing techniques for wiggle 3D displays, which present the 2D projection of 3D content with automatic (rotatory) motion parallax. Standard pointing at targets in wiggle 3D displays is challenging as the content is constantly in motion. The two pointing techniques presented here take advantage of the cursor's current position or the user's gaze direction for collocating the wiggle rotation center and potential targets. We evaluate the performance of the pointing techniques with a novel methodology that integrates 3D distractors into the ISO-9241-9 standard task. The experimental results indicate that the new techniques are significantly more efficient than standard pointing techniques in wiggle 3D displays. Given that we observed no performance variation for different targets, our new techniques seem to negate any interaction performance penalties of wiggle 3D displays.},
keywords = {3D pointing},
}
@inproceedings{nguyenvo2018referenceframe,
title = {Simulated Reference Frame: A Cost-Effective Solution to Improve Spatial Orientation in {VR}},
author = {Nguyen-Vo*, Thinh and Riecke, Bernhard E. and Stuerzlinger, Wolfgang},
booktitle = {Conference on Virtual Reality and {3D} User Interfaces},
publisher = {IEEE},
series = {VR '18},
year = {2018},
month = {Mar},
pages = {415-422},
doi = {https://doi.org/10.1109/VR.2018.8446383},
pdf = {papers/spatialreferenceframe.pdf},
teaser = {teasers/spatialreferenceframe.png},
abstract = {Virtual Reality (VR) is increasingly used in spatial cognition research, as it offers high experimental control in naturalistic multimodal environments, which is hard to achieve in real-world settings. Although recent technological advances offer a high level of photorealism, locomotion in VR is still restricted because people might not perceive their self-motion as they would in the real world. This might be related to the inability to use embodied spatial orientation processes, which support automatic and obligatory updating of our spatial awareness. Previous research has identified the roles reference frames play in retaining spatial orientation. Here, we propose using visually overlaid rectangular boxes, simulating reference frames in VR, to provide users with a better insight into spatial direction in landmark-free virtual environments. The current mixed-method study investigated how different variations of the visually simulated reference frames might support people in a navigational search task. Performance results showed that the existence of a simulated reference frame yields significant effects on participants completion time and travel distance. Though a simulated CAVE translating with the navigator (one of the simulated reference frames) did not provide significant benefits, the simulated room (another simulated reference frame depicting a rest frame) significantly boosted user performance in the task as well as improved participants preference in the post-experiment evaluation. Results suggest that adding a visually simulated reference frame to VR applications might be a cost-effective solution to the spatial disorientation problem in VR.},
keywords = {3D navigation},
}
@inproceedings{tran2017virtualarm,
title = {Effects of Virtual Arm Representations on Interaction in Virtual Environments},
author = {Tran+, Tanh Quang and Shin*, HyunJu and Stuerzlinger, Wolfgang and Han, JungHyun},
booktitle = {23rd Symposium on Virtual Reality Software and Technology},
publisher = {ACM},
series = {VRST '17},
year = {2017},
month = {Nov},
articleno = {40},
numpages = {9},
doi = {https://doi.org/10.1145/3139131.3139149},
pdf = {papers/armrepresentation.pdf},
teaser = {teasers/armrepresentation.png},
abstract = {Many techniques for visualization and interaction that potentially increase user performance have been studied in the growing field of virtual reality. However, the effects of virtual-arm representations on users' performance and perception in selection tasks have not been studied before. This paper presents the results of a user study of three different representations of the virtual arm: "hand only," "hand+forearm," and "whole arm" which includes the upper arm. In addition to the representations' effects on performance and perception in selection tasks, we investigate how the users' performance changes depending on whether collisions with objects are allowed or not. The relationship between the virtual-arm representations and the senses of agency and ownership are also explored. Overall, we found that the "whole arm" condition performed worst.},
keywords = {3D pointing, presence},
}
@inproceedings{putze2017eeg,
title = {Automatic Classification of Auto-Correction Errors in Predictive Text Entry Based on {EEG} and Context Information},
author = {Putze, Felix and Schünemann*, Maik and Schultz, Tanja and Stuerzlinger, Wolfgang},
booktitle = {19th Conference on Multimodal Interaction},
publisher = {ACM},
series = {ICMI '17},
year = {2017},
month = {Nov},
pages = {137–145},
doi = {https://doi.org/10.1145/3136755.3136784},
pdf = {papers/classifyAutoCorrectEEG.pdf},
teaser = {teasers/classifyAutoCorrectEEG.png},
abstract = {State-of-the-art auto-correction methods for predictive text entry systems work reasonably well, but can never be perfect due to the properties of human language. We present an approach for the automatic detection of erroneous auto-corrections based on brain activity and text-entry-based context features. We describe an experiment and a new system for the classification of human reactions to auto-correction errors. We show how auto-correction errors can be detected with an average accuracy of 85%.},
keywords = {EEG, text entry, autocorrect, errors},
}
@inproceedings{zaman2017mace,
title = {{MACE}: A New Interface for Comparing and Editing of Multiple Alternative Documents for Generative Design},
author = {Zaman, Loutfouz and Stuerzlinger, Wolfgang and Neugebauer+, Christian},
booktitle = {Symposium on Document Engineering},
publisher = {ACM},
series = {DocEng '17},
year = {2017},
month = {Sep},
pages = {67–76},
doi = {https://doi.org/10.1145/3103010.3103013},
pdf = {papers/mace.pdf},
teaser = {teasers/mace.png},
abstract = {We present a new interface for interactive comparisons of more than two alternative documents in the context of a generative design system that uses generative data-flow networks defined via directed acyclic graphs. To better show differences between such networks, we emphasize added, deleted, (un)changed nodes and edges. We emphasize differences in the output as well as parameters using highlighting and enable post-hoc merging of the state of a parameter across a selected set of alternatives. To minimize visual clutter, we introduce new difference visualizations for selected nodes and alternatives using additive and subtractive encodings, which improve readability and keep visual clutter low. We analyzed similarities in networks from a set of alternative designs produced by architecture students and found that the number of similarities outweighs the differences, which motivates use of subtractive encoding. We ran a user study to evaluate the two main proposed difference visualization encodings and found that they are equally effective.},
keywords = {alternatives, difference visualization, design},
}
@inproceedings{zeidler2017automatic,
title = {Automatic Generation of User Interface Layouts for Alternative Screen Orientations},
author = {Zeidler*, Clemens and Weber, Gerald and Stuerzlinger, Wolfgang and Lutteroth, Christof},
booktitle = {Human-Computer Interaction},
publisher = {Springer},
series = {INTERACT '17},
year = {2017},
month = {Sep},
volume = {LNCS 10513},
pages = {13-35},
doi = {https://doi.org/10.1007/978-3-319-67744-6_2},
pdf = {papers/autoorientlayout.pdf},
video = {videos/autoorientlayout.mp4},
teaser = {teasers/autoorientlayout.png},
abstract = {Creating multiple layout alternatives for graphical user interfaces to accommodate different screen orientations for mobile devices is labor intensive. Here, we investigate how such layout alternatives can be generated automatically from an initial layout. Providing good layout alternatives can inspire developers in their design work and support them to create adaptive layouts. We performed an analysis of layout alternatives in existing apps and identified common real-world layout transformation patterns. Based on these patterns we developed a prototype that generates landscape and portrait layout alternatives for an initial layout. In general, there is a very large number of possibilities of how widgets can be rearranged. For this reason we developed a classification method to identify and evaluate "good" layout alternatives automatically. From this set of "good" layout alternatives, designers can choose suitable layouts for their applications. In a questionnaire study we verified that our method generates layout alternatives that appear well structured and are easy to use.},
keywords = {GUI, layout},
award = {This work received a Reviewer's Choice Award},
}
@inproceedings{bjerre2017predictive,
title = {Predictive Model for Group Selection Performance on Touch Devices},
author = {Bjerre+, Per and Christensen+, Allan and Pedersen+, Andreas Køllund and Pedersen+, Simon André and Stuerzlinger, Wolfgang and Stenholt, Rasmus},
booktitle = {Human-Computer Interaction, Interaction Contexts},
publisher = {Springer},
series = {HCI International '17},
year = {2017},
month = {Jul},
volume = {LNCS 10272},
pages = {142-161},
doi = {https://doi.org/10.1007/978-3-319-58077-7_12},
pdf = {papers/lazytouch.pdf},
teaser = {teasers/lazytouch.png},
abstract = {Users spend hours making selections with ineffective tools, we therefore examine selection methods for efficiency in various touch trials. In a preliminary study three alternative selection methods were identified, we compared these to a smart selection tool. The study showed that a single selection method was the fastest; however, when the amount of targets increased, a multiple selection tool became more efficient. A secondary study with more targets revealed similar results. We therefore examined the single selection method against traditional selection methods in a user study. The results reveal a model of the average action and time cost for all methods within the parameters of mental preparation and target addition. The study revealed that the most favored selection methods were a lasso and brush selection tool. The study provides evidence towards a predictive model of selection performance for multiple target selection trials.},
keywords = {group selection, touch},
}
@inproceedings{yamanaka2017steering,
title = {Steering Through Sequential Linear Path Segments},
author = {Yamanaka*, Shota and Stuerzlinger, Wolfgang and Miyashita, Homei},
booktitle = {Conference on Human Factors in Computing Systems},
publisher = {ACM},
series = {CHI '17},
year = {2017},
month = {May},
pages = {232–243},
doi = {https://doi.org/10.1145/3025453.3025836},
pdf = {papers/pathsequencesteering.pdf},
teaser = {teasers/pathsequencesteering.png},
abstract = {The steering law models human motor performance and has been verified to hold for a single linear and/or circular path. Some extensions investigated steering around corners. Yet, little is known about human performance in navigating joined linear paths, i.e., successions of path segments with different widths. Such operations appear in graphical user interface tasks, including lasso operations in illustration software. In this work, we conducted several experiments involving joined paths. The results show that users significantly changed their behavior, and that this strategy change can be predicted beforehand. A simple model summing the two indexes of difficulty (IDs) for each path predicts movement time well, but more sophisticated models were also evaluated. The best model in terms of both of R2 and AIC values includes the ID of the crossing operation to enter the second path.},
keywords = {steering, lasso, group selection},
}
@inproceedings{jang2017fatigue,
title = {Modeling Cumulative Arm Fatigue in Mid-Air Interaction Based on Perceived Exertion and Kinetics of Arm Motion},
author = {Jang*, Sujin and Stuerzlinger, Wolfgang and Ambike, Satyajit and Ramani, Karthik},
booktitle = {Conference on Human Factors in Computing Systems},
publisher = {ACM},
series = {CHI '17},
year = {2017},
month = {May},
pages = {3328–3339},
doi = {https://doi.org/10.1145/3025453.3025523},
url = {https://github.com/CDesignGitHub/Cumulative-Arm-Fatigue_CHI-2017},
pdf = {papers/cumulativearmfatigue.pdf},
teaser = {teasers/cumulativearmfatigue.png},
abstract = {Quantifying cumulative arm muscle fatigue is a critical factor in understanding, evaluating, and optimizing user experience during prolonged mid-air interaction. A reasonably accurate estimation of fatigue requires an estimate of an individual's strength. However, there is no easy-to-access method to measure individual strength to accommodate inter-individual differences. Furthermore, fatigue is influenced by both psychological and physiological factors, but no current HCI model provides good estimates of cumulative subjective fatigue. We present a new, simple method to estimate the maximum shoulder torque through a mid-air pointing task, which agrees with direct strength measurements. We then introduce a cumulative fatigue model informed by subjective and biomechanical measures. We evaluate the performance of the model in estimating cumulative subjective fatigue in mid-air interaction by performing multiple cross-validations and a comparison with an existing fatigue metric. Finally, we discuss the potential of our approach for real-time evaluation of subjective fatigue as well as future challenges.},
keywords = {fatigue, mid-air, model},
}
@inproceedings{yamanaka2017analysis,
title = {Analysis and Modeling of Steering Behavior of Connected Straight Paths},
author = {Yamanaka*, Shota and Stuerzlinger, Wolfgang and Miyashita, Homei},
booktitle = {Interaction},
year = {2017},
month = {Mar},
pages = {17-26},
url = {http://www.interaction-ipsj.org/proceedings/2017},
pdf = {papers/steeringanalysis.pdf},
teaser = {teasers/steeringanalysis.png},
commented-title = {Analysis and Modeling of the Operation of Steering a Connected Linear Route},
abstract = {The steering law models human motor performance and has been verified to hold for a single linear and/or circular path. Some extensions investigated steering around corners. Yet, little is known about human performance in navigating joined linear paths, i.e., successions of path segments with different widths, although such operations appear in our graphical user interface tasks, including lasso operations in illustration software. In this work, we conducted three experiments involving joined paths. The results showed that users significantly changed their behavior, and that that strategy change can be determined beforehand. A simple model summing the two indexes of difficulty (IDs) for each path was efficient to predict the time (R2 > 0.96), but more sophisticated models were also evaluated. The best model includes the ID of the crossing operation to enter the second path, in terms of both of R2 and AIC values.},
keywords = {steering, lasso, group selection},
award = {This work received a Best Paper Award},
note = {In Japanese},
}
@inproceedings{kim2016holostation,
title = {{HoloStation}: Augmented Visualization and Presentation},
author = {Kim*, Minju and Lee*, Jungjin and Stuerzlinger, Wolfgang and Wohn, Kwangyun},
booktitle = {{SIGGRAPH} {ASIA} Symposium on Visualization},
publisher = {ACM},
series = {SA Vis '16},
year = {2016},
month = {Dec},
articleno = {12},
numpages = {9},
doi = {https://doi.org/10.1145/3002151.3002161},
pdf = {papers/holostation.pdf},
teaser = {teasers/holostation.png},
abstract = {As much as stories need to be told, images need to be presented. Although visualizations are meant to be self-explanatory, often enhancing their expressive power by incorporating a certain degree of interactivity, visualized images today often fail to encourage the active engagement of the user/audience. In many cases, interactive interventions by a human presenter have the potential to drastically improve the engagement with visualization. Rather than just showing the content, the presenter then enhances information delivery, e.g., by providing the context of the visualization. In this paper, we propose a novel concept called augmented presentation in which the human presenter occupies the same physical space as the visualized information, thereby presenting and interacting with the visualized images seamlessly. Depending on the level of engagement the presenter's role may vary: from a simple storyteller to an augmented presenter who may be regarded as a part of the visualized entity. To further the development of the new idea of augmented presentation, we have designed, implemented, and user-tested a visualization system named HoloStation. The presenter is placed between two projection screens: the front one is half-mirrored and the rear one is a conventional wall screen. The 3D stereoscopic images are rendered to appear in-between, thereby creating a coherent 3D visualization space filled with digital information and the human presenter. We have conducted a controlled experiment to investigate the subjective level of immersion and engagement of the audience with HoloStation compared to the traditional presentation. Our results suggest that our new form of augmented presentation has a potential not only to enhance the quality of information presentation but also to enrich the user experience on visualizations.},
keywords = {stereo, display, augmented reality},
}
@inproceedings{waese2016rsvp,
title = {An Evaluation of Interaction Methods for Controlling RSVP Displays in Visual Search Tasks},
author = {Waese*, Jamie and Stuerzlinger, Wolfgang and Provart, Nicholas},
booktitle = {Symposium on Big Data Visual Analytics},
publisher = {IEEE},
series = {BDVA '16},
year = {2016},
month = {Nov},
pages = {1-8},
doi = {https://doi.org/10.1109/BDVA.2016.7787041},
pdf = {papers/rsvp.pdf},
teaser = {teasers/rsvp.png},
abstract = {Accurately identifying images with subtly varying features from a large set of similar images can be a challenging task. To succeed, viewers must perceive subtle differences between multiple nearly identical images and react appropriately. The Rapid Serial Visual Presentation (RSVP) display technique has the potential to improve performance as it exploits our ability to preattentively recognize differences between images when they are flashed on a screen in a rapid and serial manner. We compared the speed and accuracy of three RSVP interface methods ("Hover", "Slide Show" and "Velocity") against a traditional "Point & Click" non-RSVP interface to test whether an RSVP display improves performance in visual search tasks. In a follow-up study we compared "Hover" and "Velocity" RSVP interface methods against a "Small Multiples" non-RSVP interface to explore the interaction of interface type and target size on visual search tasks. We found the "Hover" RSVP interface to significantly reduce the time it takes to perform visual search tasks with no reduction in accuracy, regardless of the size of the search targets. Beyond the gene identification task tested here, these experiments inform the design of user interfaces for many other visual search tasks.},
keywords = {visual analytics, rsvp, visualization, search},
}
@inproceedings{sun2016depthpop,
title = {Shift-Sliding and Depth-Pop for {3D} Positioning},
author = {Sun*, Junwei and Stuerzlinger, Wolfgang and Shuralyov*, Dmitri},
booktitle = {Symposium on Spatial User Interaction},
publisher = {ACM},
series = {SUI '16},
year = {2016},
month = {Oct},
pages = {69-78},
doi = {https://doi.org/10.1145/2983310.2985748},
pdf = {papers/depthpop.pdf},
video = {videos/depthpop.mp4},
teaser = {teasers/depthpop.png},
abstract = {Moving objects is an important task in 3D user interfaces. We describe two new techniques for 3D positioning, designed for a mouse, but usable with other input devices. The techniques enable rapid, yet easy-to-use positioning of objects in 3D scenes. With sliding, the object follows the cursor and moves on the surfaces of the scene. Our techniques enable precise positioning of constrained objects. Sliding assumes that by default objects stay in contact with the scene's front surfaces, are always at least partially visible, and do not interpenetrate other objects. With our new Shift-Sliding method the user can override these default assumptions and lift objects into the air or make them collide with other objects. Shift-Sliding uses the local coordinate system of the surface that the object was last in contact with, which is a new form of context-dependent manipulation. We also present Depth-Pop, which maps mouse wheel actions to all object positions along the mouse ray, where the object meets the default assumptions for sliding. For efficiency, both methods use frame buffer techniques. Two user studies show that the new techniques significantly speed up common 3D positioning tasks.},
keywords = {3D manipulation, sliding, 3D positioning},
award = {This work received a Best Demonstration Award},
}
@inproceedings{brown2016inair,
title = {Exploring the Throughput Potential of In-Air Pointing},
author = {Brown*, Michelle A. and Stuerzlinger, Wolfgang},
booktitle = {18th International Conference on Human-Computer Interaction. Interaction Platforms and Techniques, Part {II}},
publisher = {Springer},
series = {HCI International '16},
year = {2016},
month = {Jul},
volume = {LNCS 9732},
pages = {13–24},
doi = {https://doi.org/10.1007/978-3-319-39516-6_2},
pdf = {papers/fingercast.pdf},
teaser = {teasers/fingercast.png},
abstract = {We present an analysis of how pointing performance in in-air un-instrumented pointing can be improved, towards throughput equal to the mouse. Pointing using a chopstick is found to achieve the highest average throughput, with 3.89 bps. This is a substantial improvement over using the finger to point at the screen. Two potential reasons for the throughput gap between chopstick and finger operation were explored: the natural curvature of human fingers and tracking issues that occurs when fingers bend toward the device. Yet, neither one of these factors seems to significantly affect throughput. Thus other, yet unexplored factors must be the cause. Lastly, the effect of unreliable click detection was also explored, as this also affects un-instrumented performance, and was found to have a linear effect.},
keywords = {mid-air, 3D pointing, errors},
}
@inproceedings{bjerre2016transition,
title = {Transition Times for Manipulation Tasks in Hybrid Interfaces},
author = {Christensen+, Allan and Pedersen+, Simon André and Bjerre+, Per and Pedersen+, Andreas Køllund and Stuerzlinger, Wolfgang},
booktitle = {18th International Conference on Human-Computer Interaction. Interaction Platforms and Techniques, Part {II}},
publisher = {Springer},
series = {HCI International '16},
year = {2016},
month = {Jul},
volume = {LNCS 9732},
pages = {138-150},
doi = {https://doi.org/10.1007/978-3-319-39516-6_13},
pdf = {papers/transitions.pdf},
teaser = {teasers/transitions.png},
abstract = {Compared to the mouse, uninstrumented in-air interaction has been shown to be slower and less precise for pointing. Yet, in-air input is preferable or advantageous in some interaction scenarios. Thus, we examine a three-device hybrid setup involving the mouse, keyboard, and a Leap Motion. We performed a user study to quantify the costs associated with transitioning between these interaction devices, while performing simple 2D manipulation tasks using the mouse and Leap Motion. We found that transitioning to and from the Leap Motion takes on average 0.87 s longer than those between the mouse and keyboard.},
keywords = {mid-air, 3D manipulation, 3D positioning},
}
@inproceedings{arif2016smartbackspace,
title = {Evaluation of a Smart-Restorable Backspace Technique to Facilitate Text Entry Error Correction},
author = {Arif, Ahmed Sabbir and Kim, Sunjun and Stuerzlinger, Wolfgang and Lee, Geehyuk and Mazalek, Ali},
booktitle = {Conference on Human Factors in Computing Systems},
publisher = {ACM},
series = {CHI '16},
year = {2016},
month = {Apr},
pages = {5151–5162},
doi = {https://doi.org/10.1145/2858036.2858407},
pdf = {papers/smartrestorablebackspace.pdf},
video = {videos/SmartRestorableBackspace.mp4},
teaser = {teasers/smartrestorablebackspace.png},
abstract = {We present a new smart-restorable backspace technique to facilitate correction of "overlooked" errors on touchscreen-based tablets. We conducted an empirical study to compare the new backspace technique with the conventional one. Results of the study revealed that the new technique improves the overall text entry performance, both in terms of speed and operations per character, by significantly reducing error correction efforts. In addition, results showed that most users preferred the new technique to the one they use on their tablets, and found it easy to learn and use. Most of them also felt that it improved their overall text entry performance, thus wanted to keep using it.},
keywords = {text entry, errors},
}
@inproceedings{chan2016microgestures,
title = {User Elicitation on Single-Hand Microgestures},
author = {Chan*, Edwin and Seyed*, Teddy and Stuerzlinger, Wolfgang and Yang, Xing-Dong and Maurer, Frank},
booktitle = {Conference on Human Factors in Computing Systems},
publisher = {ACM},
series = {CHI '16},
year = {2016},
month = {Apr},
pages = {3403–3414},
doi = {https://doi.org/10.1145/2858036.2858589},
pdf = {papers/singlehandmicrogestureelicitation.pdf},
teaser = {teasers/singlehandmicrogestureelicitation.png},
abstract = {Gestural interaction has become increasingly popular, as enabling technologies continue to transition from research to retail. The mobility of miniaturized (and invisible) technologies introduces new uses for gesture recognition. This paper investigates single-hand microgestures (SHMGs), detailed gestures in a small interaction space. SHMGs are suitable for the mobile and discrete nature of interactions for ubiquitous computing. However, there has been a lack of end-user input in the design of such gestures. We performed a user-elicitation study with 16 participants to determine their preferred gestures for a set of referents. We contribute an analysis of 1,632 gestures, the resulting gesture set, and prevalent conceptual themes amongst the elicited gestures. These themes provide a set of guidelines for gesture designers, while informing the designs of future studies. With the increase in hand-tracking and electronic devices in our surroundings, we see this as a starting point for designing gestures suitable to portable ubiquitous computing.},
keywords = {gesture recognition, gestures, elicitation, mid-air},
award = {This work received a Best Paper Honorable Mention Award},
}
@inproceedings{perteneder2016ambientlight,
title = {Glowworms and Fireflies: Ambient Light on Large Interactive Surfaces},
author = {Perteneder*, Florian and Grossauer*, Eva-Maria Beatrix and Leong*, Joanne and Stuerzlinger, Wolfgang and Haller, Michael},
booktitle = {Conference on Human Factors in Computing Systems},
publisher = {ACM},
series = {CHI '16},
year = {2016},
month = {Apr},
pages = {5849–5861},
doi = {https://doi.org/10.1145/2858036.2858524},
pdf = {papers/glowwormsfireflies.pdf},
video = {videos/glowworms.mp4},
teaser = {teasers/glowworms.png},
abstract = {Ambient light is starting to be commercially used to enhance the viewing experience for watching TV. We believe that ambient light can add value in meeting and control rooms that use large vertical interactive surfaces. Therefore, we equipped a large interactive whiteboard with a peripheral ambient light display and explored its utility for different scenarios by conducting two controlled experiments. In the first experiment, we investigated how ambient light can be used for peripheral notifications, and how perception is influenced by the user's position and the type of work they are engaged in. The second experiment investigated the utility of ambient light for off-screen visualization. We condense our findings into several design recommendations that we then applied to application scenarios to show the versatility and usefulness of ambient light for large surfaces.},
keywords = {ambient light, large display system},
}
@inproceedings{makonin2016mixedinitiative,
title = {Mixed-Initiative for Big Data: The Intersection of Human + Visual Analytics + Prediction},
author = {Makonin, Stephen and {McVeigh}+, Daniel and Stuerzlinger, Wolfgang and Tran*, Khoa and Popowich, Fred},
booktitle = {Hawaii International Conference on System Sciences},
publisher = {IEEE},
series = {HICSS '16},
year = {2016},
month = {Jan},
pages = {1427-1436},
doi = {https://doi.org/10.1109/HICSS.2016.181},
pdf = {papers/mixedinitiativesurvey.pdf},
teaser = {teasers/mixedinitiativesurvey.png},
abstract = {Existing surveys in visual analytics focus on the importance of the topic. However, many do not discuss the increasingly critical area of mixed-initiative systems. In this survey we discuss the importance of research in mixed-initiative systems and how it is different from visual analytics and other research fields. We present the conceptual architecture of a mixed-initiative visual analytics system (MIVAS) and the five key components that make up MIVASs (data wrangling, alternative discovery and comparison, parametric interaction, history tracking and exploration, and system agency and adaptation), which forms our main contribution. We compare and contrast different research that claims to be mixed-initiative against MIVASs and show how there is still a considerable amount of work that needs to be accomplished before any system can truly be mixed-initiative.},
keywords = {visual analytics, visualization, mixed initiative},
}
@inproceedings{strothoff2015pinsntouches,
title = {Pins 'n' Touches: An Interface for Tagging and Editing Complex Groups},
author = {Strothoff*, Sven and Stuerzlinger, Wolfgang and Hinrichs, Klaus},
booktitle = {Conference on Interactive Tabletops & Surfaces},
publisher = {ACM},
series = {ITS '15},
year = {2015},
month = {Nov},
pages = {191–200},
doi = {https://doi.org/10.1145/2817721.2817731},
pdf = {papers/pinsntouches.pdf},
video = {videos/pinsntouches.mp4},
teaser = {teasers/pinsntouches.png},
abstract = {Influenced by mouse/pen-based user interfaces, most touch-based object tagging techniques rely mostly on a single interaction point. Once objects are tagged, typically only individual object inclusions/exclusions are possible. Yet, for tagging larger groups with complex spatial layouts, more refinement may be necessary to achieve the desired result. We apply visual tag markers to objects to visualize their group association. Through a new multi-touch pin gesture that "pins" one or more objects "down" while tagging, our new interface is capable of efficiently grouping objects, as identified in our user studies.},
keywords = {touch, group selection},
}
@inproceedings{ortega2015shocam,
title = {{SHOCam}: A {3D} Orbiting Algorithm},
author = {Ortega, Michael and Stuerzlinger, Wolfgang and Scheurich*, Doug},
booktitle = {28th Annual Symposium on User Interface Software & Technology},
publisher = {ACM},
series = {UIST '15},
year = {2015},
month = {Nov},
pages = {119–128},
doi = {https://doi.org/10.1145/2807442.2807496},
pdf = {papers/shocam.pdf},
video = {videos/SHOcam.mp4},
teaser = {teasers/shocam.png},
abstract = {In this paper we describe a new orbiting algorithm, called SHOCam, which enables simple, safe and visually attractive control of a camera moving around 3D objects. Compared with existing methods, SHOCam provides a more consistent mapping between the user's interaction and the path of the camera by substantially reducing variability in both camera motion and look direction. Also, we present a new orbiting method that prevents the camera from penetrating object(s), making the visual feedback - and with it the user experience - more pleasing and also less error prone. Finally, we present new solutions for orbiting around multiple objects and multi-scale environments.},
keywords = {3D navigation, 3D orbiting},
}
@inproceedings{vuibert2015docking,
title = {Evaluation of Docking Task Performance Using Mid-Air Interaction Techniques},
author = {Vuibert*, Vanessa and Stuerzlinger, Wolfgang and Cooperstock, Jeremy R.},
booktitle = {3rd Symposium on Spatial User Interaction},
publisher = {ACM},
series = {SUI '15},
year = {2015},
month = {Aug},
pages = {44–52},
doi = {https://doi.org/10.1145/2788940.2788950},
pdf = {papers/midairdock.pdf},
teaser = {teasers/midairdock.png},
abstract = {Mid-air interaction has the potential to manipulate objects in 3D with more natural input mappings. We compared the performance attainable using various mid-air interaction methods with a mechanically constrained input device in a 6 degrees-of-freedom (DoF) docking task in both accuracy and completion time. We found that tangible mid-air input devices supported faster docking performance, while exhibiting accuracy close to that of constrained devices. Interaction with bare hands in mid-air achieved similar time performance and accuracy compared to the constrained device.},
keywords = {3D manipulation, 3D positioning, docking, mid-air},
}
@inproceedings{teather2015factors,
title = {Factors Affecting Mouse-Based {3D} Selection in Desktop {VR} Systems},
author = {Teather, Robert J. and Stuerzlinger, Wolfgang},
booktitle = {3rd Symposium on Spatial User Interaction},
publisher = {ACM},
series = {SUI '15},
year = {2015},
month = {Aug},
pages = {10–19},
doi = {https://doi.org/10.1145/2788940.2788946},
pdf = {papers/mousestereo.pdf},
video = {videos/mousestereo.mp4},
teaser = {teasers/mousestereo.png},
abstract = {We present two experiments on mouse-based point selection in a desktop virtual reality system using stereo display and head-tracking. To address potential issues of using a mouse cursor with stereo display, we also evaluate the impact of using a one-eyed (mono) cursor. While a one-eyed cursor visualization eliminates depth conflicts, recent work suggests it offers worse performance than stereo cursors, possibly due to eye discomfort. Our results indicate that presenting the cursor in stereo significantly reduces performance for targets at different depths. The one-eyed cursor eliminates this effect, offering better performance than both screen-plane and geometry-sliding cursors visualized in stereo. However, it also performed slightly worse than stereo cursors in situations without depth conflicts. Our study suggests that this difference is not due exclusively to the relative transparency of such a cursor, hence eye fatigue or similar may be responsible.},
keywords = {3D positioning, stereo},
}
@inproceedings{zaman2015gemni,
title = {{GEM-NI}: A System for Creating and Managing Alternatives In Generative Design},
author = {Zaman*, Loutfouz and Stuerzlinger, Wolfgang and Neugebauer+, Christian and Woodbury, Robert and Elkhaldi*, Maher and Shireen*, Naghmi and Terry, Michael},
booktitle = {33rd Annual ACM Conference on Human Factors in Computing Systems},
publisher = {ACM},
series = {CHI '15},
year = {2015},
month = {Apr},
pages = {1201–1210},
doi = {https://doi.org/10.1145/2702123.2702398},
pdf = {papers/gem-ni.pdf},
video = {videos/GEM-NI.m4v},
teaser = {teasers/gem-ni.png},
abstract = {We present GEM-NI - a graph-based generative-design tool that supports parallel exploration of alternative designs. Producing alternatives is a key feature of creative work, yet it is not strongly supported in most extant tools. GEM-NI enables various forms of exploration with alternatives such as parallel editing, recalling history, branching, merging, comparing, and Cartesian products of and for alternatives. Further, GEM-NI provides a modal graphical user interface and a design gallery, which both allow designers to control and manage their design exploration. We conducted an exploratory user study followed by in-depth one-on-one interviews with moderately and highly skills participants and obtained positive feedback for the system features, showing that GEM-NI supports creative design work well.},
keywords = {alternatives, design},
}
@inproceedings{pfeiffer2015emsfeedback,
title = {{3D} Virtual Hand Pointing with {EMS} and Vibration Feedback},
author = {Pfeiffer*, Max and Stuerzlinger, Wolfgang},
booktitle = {Symposium on {3D} User Interfaces},
publisher = {IEEE},
series = {3DUI '15},
year = {2015},
month = {Mar},
pages = {117-120},
doi = {https://doi.org/10.1109/3DUI.2015.7131735},
pdf = {papers/EMSfeedback.pdf},
teaser = {teasers/EMSfeedback.png},
abstract = {Pointing is one of the most basic interaction methods for 3D user interfaces. Previous work has shown that visual feedback improves such actions. Here we investigate if electrical muscle stimulation (EMS) and vibration is beneficial for 3D virtual hand pointing. In our experiment we used a 3D version of a Fitts' task to compare visual feedback, EMS, vibration, with no feedback. The results demonstrate that both EMS and vibration provide reasonable addition to visual feedback. We also found good user acceptance for both technologies.},
keywords = {3D pointing, haptics},
}
@inproceedings{arif2014pseudopressure,
title = {The Use of Pseudo Pressure in Authenticating Smartphone Users},
author = {Arif*, Ahmed Sabbir and Ali, Mazalek and Stuerzlinger, Wolfgang},
booktitle = {11th International Conference on Mobile and Ubiquitous Systems: Computing, Networking and Services},
publisher = {ICST},
series = {MOBIQUITOUS '14},
year = {2014},
month = {Dec},
pages = {151–160},
doi = {https://doi.org/10.4108/icst.mobiquitous.2014.257919},
pdf = {papers/pressureauthentication.pdf},
teaser = {teasers/pressureauthentication.png},
abstract = {In this article, we present a new user authentication technique for touchscreen-based smartphone users that augments pseudo touch pressure as an extra security measure to the conventional digit-lock technique. The new technique enhances security by offering more unique password combinations than the most popular ones, by making each password specific to its owner, and by reducing the threat of smudge attacks. A study comparing the new technique with the digit-lock technique showed that overall it is slower and more error-prone, but performs substantially better in short term. Also, most users felt more secure using it and wanted to use it dominantly on their smartphones. A second study confirmed that it does enhance security by making it relatively more resistant to smudge attacks and less vulnerable to situations where attackers are already in possession of users' passwords.},
keywords = {authentication, password, mobile device},
}
@inproceedings{teather2014visualaids,
title = {Visual Aids in {3D} Point Selection Experiments},
author = {Teather*, Robert J. and Stuerzlinger, Wolfgang},
booktitle = {2nd Symposium on Spatial User Interaction},
publisher = {ACM},
series = {SUI '14},
year = {2014},
month = {Oct},
pages = {127–136},
doi = {https://doi.org/10.1145/2659766.2659770},
pdf = {papers/visualaidspointing.pdf},
video = {videos/3DvisualAids.mp4},
teaser = {teasers/visualaidspointing.png},
abstract = {We present a study investigating the influence of visual aids on 3D point selection tasks. In a Fitts' law pointing experiment, we compared the effects of texturing, highlighting targets upon being touched, and the presence of support cylinders intended to eliminate floating targets. Results of the study indicate that texturing and support cylinders did not significantly influence performance. Enabling target highlighting increased movement speed, while decreasing error rate. Pointing throughput was unaffected by this speed-accuracy tradeoff. Highlighting also eliminated significant differences between selection coordinate depth deviation and the deviation in the two orthogonal axes.},
keywords = {3D pointing, stereo},
}
@inproceedings{brown2014performance,
title = {The Performance of Un-Instrumented in-Air Pointing},
author = {Brown*, Michelle A. and Stuerzlinger, Wolfgang and de Mendonça Filho+, Euclides José},
booktitle = {Graphics Interface},
series = {GI '14},
year = {2014},
month = {May},
pages = {59–66},
url = {https://dl.acm.org/doi/10.5555/2619648.2619659},
footnote = {https://graphicsinterface.org/proceedings/gi2014/gi2014-8},
pdf = {papers/inairpointing.pdf},
teaser = {teasers/inairpointing.png},
abstract = {We present an analysis of in-air finger and hand controlled object pointing and selection. The study used a tracking system that required no instrumentation on the user. We compared the performance of the two pointing methods with and without elbow stabilization and found that the method that yielded the best performance varied for each participant, such that there was no method that performed significantly better than all others. We also directly compared user performance between un-instrumented in-air pointing and the mouse. We found that the un-instrumented in-air pointing performed significantly worse, at less than 75% of mouse throughput. Yet, the larger range of applications for un-instrumented 3D hand tracking makes this technology still an attractive option for user interfaces.},
keywords = {3D pointing, mid-air},
}
@inproceedings{arif2014adaptation,
title = {User Adaptation to a Faulty Unistroke-Based Text Entry Technique by Switching to an Alternative Gesture Set},
author = {Arif*, Ahmed Sabbir and Stuerzlinger, Wolfgang},
booktitle = {Graphics Interface},
series = {GI '14},
year = {2014},
month = {May},
pages = {183–192},
url = {https://dl.acm.org/doi/10.5555/2619648.2619679},
footnote = {https://graphicsinterface.org/proceedings/gi2014/gi2014-24},
pdf = {papers/faultygestures.pdf},
teaser = {teasers/faultygestures.png},
abstract = {This article presents results of two user studies to investigate user adaptation to a faulty unistroke gesture recognizer of a text entry technique. The intent was to verify the hypothesis that users gradually adapt to a faulty gesture recognition technique' s misrecognition errors and that this adaptation rate is dependent on how frequently they occur. Results confirmed that users gradually adapt to misrecognition errors by replacing the error prone gestures with alternative ones, as available. Also, users adapt to a particular misrecognition error faster if it occurs more frequently than others.},
keywords = {errors, gesture recognition, adaptation},
}
@inproceedings{latoschik2014evaluation,
title = {On the Art of the Evaluation and Presentation of RIS-Engineering},
author = {Latoschik, Marc Erich and Stuerzlinger, Wolfgang},
booktitle = {Software Engineering and Architectures for Realtime Interactive Systems},
publisher = {IEEE},
series = {SEARIS '14},
year = {2014},
month = {Mar},
pages = {9-17},
doi = {https://doi.org/10.1109/SEARIS.2014.7152796},
pdf = {papers/rispresent.pdf},
teaser = {teasers/rispresent.png},
abstract = {This article analyses the tasks of presenting and evaluating relevant scientific research in the field of Real-time Interactive Systems (RIS), i.e., in areas such as Virtual, Mixed, and Augmented Reality (VR, MR, and AR) and advanced Human-Computer Interaction. It identifies different methods for a structured approach to the description and evaluation of systems and their properties, including commonly found best practices as well as dos and don'ts. The article is targeted at authors as well as reviewers to guide both groups in the presentation as well as the appraisal of system engineering work.},
keywords = {systems, evaluation, virtual reality, augmented reality},
}
@inproceedings{arif2013pseudopressure,
title = {Pseudo-Pressure Detection and Its Use in Predictive Text Entry on Touchscreens},
author = {Arif*, Ahmed Sabbir and Stuerzlinger, Wolfgang},
booktitle = {Australian Computer-Human Interaction Conference: Augmentation, Application, Innovation, Collaboration},
series = {OzCHI '13},
year = {2013},
month = {Nov},
pages = {383-392},
doi = {https://doi.org/10.1145/2541016.2541024},
pdf = {papers/pseudopressure.pdf},
teaser = {teasers/pseudopressure.png},
abstract = {In this article we first present a new hybrid technique that combines existing time- and touch-point-based approaches to simulate pressure detection on standard touchscreens. Results of two user studies show that the new hybrid technique can distinguish (at least) two pressure levels, where the first requires on average 1.04 N and the second 3.24 N force on the surface. Then, we present a novel pressure-based predictive text entry technique that utilizes our hybrid pressure detection to enable users to bypass incorrect predictions by applying extra pressure on the next key. For inputting short English phrases with 10% non-dictionary words a comparison with conventional text entry in a study showed that the new technique increases entry speed by 9% and decreases error rates by 25%. Also, most users (83%) favour the new technique.},
keywords = {text entry, pressure, touch},
award = {This work received a Best Paper Award},
}
@inproceedings{arif2013evaluation,
title = {Evaluation of a New Error Prevention Technique for Mobile Touchscreen Text Entry},
author = {Arif*, Ahmed Sabbir and Stuerzlinger, Wolfgang},
booktitle = {Australian Computer-Human Interaction Conference: Augmentation, Application, Innovation, Collaboration},
series = {OzCHI '13},
year = {2013},
month = {Nov},
pages = {397-400},
doi = {https://doi.org/10.1145/2541016.2541063},
pdf = {papers/textpressure.pdf},
teaser = {teasers/textpressure.png},
abstract = {This paper presents a new pressure-based error prevention technique for mobile touchscreen text entry. Two user studies were conducted to compare the new technique with a conventional virtual keyboard, one with novice and another with expert users. Results of the first user study showed that with practice the new technique significantly improves accuracy. Yet, no such indication was observed during the second study.},
keywords = {text entry, errors, pressure, touch},
}
@inproceedings{lindlbauer2013perceptual,
title = {Perceptual Grouping: Selection Assistance for Digital Sketching},
author = {Lindlbauer*, David and Haller, Michael and Hancock, Mark and Scott, Stacey and Stuerzlinger, Wolfgang},
booktitle = {Conference on Interactive Tabletops and Surfaces},
publisher = {ACM},
series = {ITS '13},
year = {2013},
month = {Oct},
pages = {51-60},
doi = {https://doi.org/10.1145/2512349.2512801},
pdf = {papers/suggero.pdf},
video = {videos/Suggero.mp4},
teaser = {teasers/suggero.png},
abstract = {Modifying a digital sketch may require multiple selections before a particular editing tool can be applied. Especially on large interactive surfaces, such interactions can be fatiguing. Accordingly, we propose a method, called Suggero, to facilitate the selection process of digital ink. Suggero identifies groups of perceptually related drawing objects. These "perceptual groups" are used to suggest possible extensions in response to a person's initial selection. Two studies were conducted. First, a background study investigated participant's expectations of such a selection assistance tool. Then, an empirical study compared the effectiveness of Suggero with an existing manual technique. The results revealed that Suggero required fewer pen interactions and less pen movement, suggesting that Suggero minimizes fatigue during digital sketching.},
keywords = {group selection},
}
@inproceedings{zeidler2013ale,
title = {The Auckland Layout Editor: An Improved {GUI} Layout Specification Process},
author = {Zeidler*, Clemens and Lutteroth, Christof and Stuerzlinger, Wolfgang and Weber, Gerald},
booktitle = {26th Annual Symposium on User Interface Software and Technology},
publisher = {ACM},
series = {UIST '13},
year = {2013},
month = {Oct},
pages = {343-352},
doi = {https://doi.org/10.1145/2501988.2502007},
pdf = {papers/layoutALE.pdf},
video = {videos/ALE.mp4},
teaser = {teasers/layoutALE.png},
abstract = {Layout managers are used to control the placement of widgets in graphical user interfaces (GUIs). Constraint-based layout managers are among the most powerful. However, they are also more complex and their layouts are prone to problems such as over-constrained specifications and widget overlap. This poses challenges for GUI builder tools, which ideally should address these issues automatically. We present a new GUI builder - the Auckland Layout Editor (ALE) - that addresses these challenges by enabling GUI designers to specify constraint-based layouts using simple, mouse-based operations. We give a detailed description of ALE's edit operations, which do not require direct constraint editing. ALE guarantees that all edit operations lead to sound specifications, ensuring solvable and non-overlapping layouts. To achieve that, we present a new algorithm that automatically generates the constraints necessary to keep a layout non-overlapping. Furthermore, we discuss how our innovations can be combined with manual constraint editing in a sound way. Finally, to aid designers in creating layouts with good resize behavior, we propose a novel automatic layout preview. This displays the layout at its minimum and in an enlarged size, which allows visualizing potential resize issues directly. All these features permit GUI developers to focus more on the overall UI design.},
keywords = {GUI, layout, constraints, GUI builder},
}
@inproceedings{zabramski2013easy,
title = {Easy vs Tricky: The Shape Effect in Tracing, Selecting, and Steering With Mouse, Stylus, and Touch},
author = {Zabramski*, Stanislaw and Shrestha*, Suman and Stuerzlinger, Wolfgang},
booktitle = {International Conference on Making Sense of Converging Media},
series = {MindTrek '13},
year = {2013},
month = {Oct},
pages = {99-103},
doi = {https://doi.org/10.1145/2523429.2523444},
pdf = {papers/shapeeffect.pdf},
teaser = {teasers/shapeeffect.png},
abstract = {This short paper is a work-in-progress report on an experimental comparison and evaluation of users' performance in four line-tracing tasks based on two shapes and performed with three input methods (mouse, stylus, and touch-input). The shapes' properties used in the study created the two classes of shapes: easy and hard to replicate. As expected these two classes had different impact on user's performance in each task tested (tracing, lasso selection, steering through narrow and wide tunnel). The results show that participants replicating the shapes using touch-input were the least accurate but were the fastest in comparison to the remaining input methods. The stylus was the least error-prone method and the mouse was the slowest device in drawing tasks (tracing and selection). The differences in error distances between the input methods were less pronounced in steering tasks but timing data showed that mouse was still the slowest one. While the time of replication did not differ between the two shapes tested, the differences between the errors participants made were significant for all tasks and input devices, and patterns of these differences were consistent between the shapes. These results confirm predictions from a previous study and show which shapes' properties can make their replication more difficult. The results can be used to design shapes that are easy to replicate, e.g., in surface-based gestural interaction.},
keywords = {steering, tracing, drawing},
}
@inproceedings{agarwal2013widgetlens,
title = {{WidgetLens}: A System for Adaptive Content Magnification of Widgets},
author = {Agarwal*, Bhavna and Stuerzlinger, Wolfgang},
booktitle = {27th International BCS Human Computer Interaction Conference},
series = {BCS-HCI '13},
year = {2013},
month = {Sep},
articleno = {2},
numpages = {10},
doi = {https://doi.org/10.14236/ewic/HCI2013.4},
pdf = {papers/widgetlens.pdf},
video = {videos/WidgetLensOLD.mp4},
teaser = {teasers/widgetlens.png},
abstract = {On displays with high pixel densities or on mobile devices and due to limitations in current graphical user interface toolkits, content can appear (too) small and be hard to interact with. We present WidgetLens, a novel adaptive widget magnification system, which improves access to and interaction with graphical user interfaces. It is designed for usage of unmodified applications on screens with high pixel densities, remote desktop scenarios, and may also address some situations with visual impairments. It includes a comprehensive set of adaptive magnification lenses for standard widgets, each adjusted to the properties of that type of widget. These lenses enable full interaction with content that appears too small. We also present several extensions.},
keywords = {GUI, widget, magnification, layout},
}
@inproceedings{zabramski2013didwemiss,
title = {Did We Miss Something? Correspondence Analysis of Usability Data},
author = {Zabramski*, Stanislaw and Stuerzlinger, Wolfgang},
booktitle = {Human-Computer Interaction},
publisher = {Springer},
series = {INTERACT '13},
year = {2013},
month = {Sep},
volume = {LNCS 8120},
pages = {272-279},
doi = {https://doi.org/10.1007/978-3-642-40498-6_20},
pdf = {papers/correspondenceanalysisshort.pdf},
teaser = {teasers/correspondenceanalysisshort.png},
abstract = {We have applied a multivariate exploratory technique called Correspondence Analysis (CA) to create and analyze a model of the dataset of experiment results. The dataset originates from a comparative usability study of tracing with the use of mouse, pen, and touch input and contains both categorical and continuous data – i.e. results of questionnaires and task measurements. CA allowed to visually and numerically assess the main variables in the dataset and how they interact with each other. In our study, pen input had the best measured performance and was preferred by the users. Touch input was the least accurate of all input methods tested but it was preferred by users over mouse especially in the conditions lacking of visual feedback of drawing. CA helped to detect that secondary effect even though it cannot be explained by the performance results alone. The importance of the influence of user's previous experience is also noted. We conclude that CA helped to identify all major phenomena known from previous studies but also was sensitive to minor and secondary effects, what makes it a well suited method to quickly evaluate usability data.},
keywords = {steering, drawing, steering},
}
@inproceedings{zeidler2013evaluating,
title = {Evaluating Direct Manipulation Operations for Constraint-based Layout},
author = {Zeidler*, Clemens and Lutteroth, Christof and Stuerzlinger, Wolfgang and Weber, Gerald},
booktitle = {Human-Computer Interaction},
publisher = {Springer},
series = {INTERACT '13},
year = {2013},
month = {Sep},
volume = {LNCS 8118},
pages = {513-529},
doi = {https://doi.org/10.1007/978-3-642-40480-1_35},
pdf = {papers/layoutALEstudy.pdf},
teaser = {teasers/layoutALEstudy.png},
abstract = {Layout managers are used to control the placement of widgets in graphical user interfaces (GUIs). Constraint-based layout managers are more powerful than other ones. However, they are also more complex and their layouts are prone to problems that usually require direct editing of constraints. Today, designers commonly use GUI builders to specify GUIs. The complexities of traditional approaches to constraint-based layouts pose challenges for GUI builders.We evaluate a novel GUI builder, the Auckland Layout Editor (ALE), which addresses these challenges by enabling GUI designers to specify constraint-based layouts via direct manipulation using simple, mouse-based operations. These operations hide the complexity of the constraint-based layout model, while giving designers access to its benefits.In a user evaluation we compared ALE with two other mainstream layout builders, a grid-based and a constraint-based one. The time taken to create realistic sample layouts with our builder was significantly shorter, and most participants preferred ALE's approach. The evaluation demonstrates that good usability for authoring constraint-based layouts is possible.},
keywords = {GUI, layout, constraints},
}
@inproceedings{bruder2013touching,
title = {Touching the Void Revisited: Analyses of Touch Behavior On and Above Tabletop Surfaces},
author = {Bruder*, Gerd and Steinicke, Frank and Stuerzlinger, Wolfgang},
booktitle = {Human-Computer Interaction},
publisher = {Springer},
series = {INTERACT '13},
year = {2013},
month = {Sep},
volume = {LNCS 8117},
pages = {278-296},
doi = {https://doi.org/10.1007/978-3-642-40483-2_19},
pdf = {papers/stereotouchobserv.pdf},
teaser = {teasers/stereotouchobserv.png},
abstract = {Recent developments in touch and display technologies made it possible to integrate touch-sensitive surfaces into stereoscopic three-dimensional (3D) displays. Although this combination provides a compelling user experience, interaction with stereoscopically displayed objects poses some fundamental challenges. If a user aims to select a 3D object, each eye sees a different perspective of the same scene. This results in two distinct projections on the display surface, which raises the question where users would touch in 3D or on the two-dimensional (2D) surface to indicate the selection. In this paper we analyze the relation between the 3D positions of stereoscopically displayed objects and the on- as well as off-surface touch areas. The results show that 2D touch interaction works better close to the screen but also that 3D interaction is more suitable beyond 10cm from the screen. Finally, we discuss implications for the development of future touch-sensitive interfaces with stereoscopic display.},
keywords = {3D pointing, mid-air, touch},
}
@inproceedings{scheurich2013onehanded,
title = {A One-Handed Multi-Touch Method for {3D} Rotations},
author = {Scheurich*, Doug and Stuerzlinger, Wolfgang},
booktitle = {Human-Computer Interaction},
publisher = {Springer},
series = {INTERACT '13},
year = {2013},
month = {Sep},
volume = {LNCS 8117},
pages = {56-69},
doi = {https://doi.org/10.1007/978-3-642-40483-2_4},
pdf = {papers/touchrot.pdf},
video = {videos/touchRot.mp4},
teaser = {teasers/touchrot.png},
abstract = {Rotating 3D objects is a difficult task. We present a new rotation technique based on collision-free "mating" to expedite 3D rotations. It is specifically designed for one-handed interaction on tablets or touchscreens. A user study found that our new technique decreased the time to rotate objects in 3D by more than 60% in situations where objects align. We found similar results when users translated and rotated objects in a 3D scene. Also, angle errors were 35% less with mating. In essence, our new rotation technique improves both the speed and accuracy of common 3D rotation tasks.},
keywords = {3D manipulation, touch},
}
@inproceedings{das2013unified,
title = {Unified Modeling of Proactive Interference and Memorization Effort: A New Mathematical Perspective Within {ACT-R} Theory},
author = {Das*, Arindam and Stuerzlinger, Wolfgang},
booktitle = {Annual Meeting of the Cognitive Science Society},
series = {CogSci '13},
isbn = {978-097683189-1},
year = {2013},
month = {Jul},
pages = {358-363},
url = {https://escholarship.org/uc/item/1p05s7db},
pdf = {papers/proactivememorymodel.pdf},
teaser = {teasers/proactivememorymodel.png},
abstract = {We parsimoniously model the effect of proactive interference and memorization effort in learning stable graphical layouts. We model the visual search cost, i.e. the number of distractors visually encoded while looking for a target item, as a reasonable surrogate of onscreen proactive interference. Further, we show that a novel quantity that we term "effort factor" is an acceptable estimate for comparing the memorization effort across different access cost of onscreen information during the early stages of practice.},
keywords = {text entry, learning},
}
@inproceedings{zabramski2013activity,
title = {Activity or Product? - Drawing and {HCI}},
author = {Zabramski*, Stanislaw and Stuerzlinger, Wolfgang},
booktitle = {International Conference on Multimedia, Interaction, Design and Innovation},
series = {MIDI '13},
year = {2013},
month = {Jun},
pages = {29-38},
doi = {https://doi.org/10.1145/2500342.2500346},
pdf = {papers/drawingactivity.pdf},
teaser = {teasers/drawingactivity.png},
abstract = {Drawing tasks are rarely addressed experimentally by the HCI community, and even then pointing, steering, or gesturing is promoted as an approach towards drawing. We critically analyze the status quo, propose an improved framework for task analysis, and give suggestions on how to perceive drawing task at a meta-level.},
keywords = {drawing, steering},
}
@comment{c, c={leave the "_stuerzlinger" in the ID to enable umlaut-free search!}}
@inproceedings{bruder_stuerzlinger2013totouch,
title = {To Touch or not to Touch? Comparing {2D} Touch and {3D} Mid-Air Interaction on Stereoscopic Tabletop Surfaces},
author = {Bruder*, Gerd and Steinicke, Frank and Stürzlinger, Wolfgang},
booktitle = {Symposium on Spatial User Interaction},
publisher = {ACM},
series = {SUI '13},
year = {2013},
month = {Jul},
pages = {9-16},
doi = {https://doi.org/10.1145/2491367.2491369},
pdf = {papers/2D3Dtouch.pdf},
video = {videos/stereoTouch.mp4},
teaser = {teasers/2D3Dtouch.png},
abstract = {Recent developments in touch and display technologies have laid the groundwork to combine touch-sensitive display systems with stereoscopic three-dimensional (3D) display. Although this combination provides a compelling user experience, interaction with objects stereoscopically displayed in front of the screen poses some fundamental challenges: Traditionally, touch-sensitive surfaces capture only direct contacts such that the user has to penetrate the visually perceived object to touch the 2D surface behind the object. Conversely, recent technologies support capturing finger positions in front of the display, enabling users to interact with intangible objects in mid-air 3D space. In this paper we perform a comparison between such 2D touch and 3D mid-air interactions in a Fitts' Law experiment for objects with varying stereoscopical parallax. The results show that the 2D touch technique is more efficient close to the screen, whereas for targets further away from the screen, 3D selection outperforms 2D touch. Based on the results, we present implications for the design and development of future touch-sensitive interfaces for stereoscopic displays.},
keywords = {3D pointing, touch, mid-air},
}
@inproceedings{teather2013pointing,
title = {Pointing at {3D} Target Projections with One-Eyed and Stereo Cursors},
author = {Teather*, Robert J. and Stuerzlinger, Wolfgang},
booktitle = {{SIGCHI} Conference on Human Factors in Computing Systems},
publisher = {ACM},
series = {CHI '13},
year = {2013},
month = {Apr},
pages = {159-168},
doi = {https://doi.org/10.1145/2470654.2470677},
pdf = {papers/stereocursor.pdf},
video = {videos/3DoneEyedCursor.mp4},
teaser = {teasers/stereocursor.png},
abstract = {We present a study of cursors for selecting 2D-projected 3D targets. We compared a stereo- and mono-rendered (one-eyed) cursor using two mouse-based and two remote pointing techniques in a 3D Fitts' law pointing experiment. The first experiment used targets at fixed depths. Results indicate that one-eyed cursors only improve screen-plane pointing techniques, and that constant target depth does not influence pointing throughput. A second experiment included pointing between targets at varying depths and used only "screen-plane" pointing techniques. Our results suggest that in the absence of stereo cue conflicts, screen-space projections of Fitts' law parameters (target size and distance) yield constant throughput despite target depth differences and produce better models of performance.},
keywords = {3D pointing, stereo},
}
@inproceedings{bruder2013effects,
title = {Effects of Visual Conflicts on {3D} Selection Task Performance in Stereoscopic Display Environments},
author = {Bruder*, Gerd and Steinicke, Frank and Stuerzlinger, Wolfgang},
booktitle = {Symposium on {3D} User Interfaces},
publisher = {IEEE},
series = {3DUI '13},
year = {2013},
month = {Mar},
pages = {115-118},
doi = {https://doi.org/10.1109/3DUI.2013.6550207},
pdf = {papers/offsettouch.pdf},
teaser = {teasers/offsettouch.png},
abstract = {Mid-air direct-touch interaction in stereoscopic display environments poses challenges to the design of 3D user interfaces. Not only is passive haptic feedback usually absent when selecting a virtual object displayed with positive or negative parallax relative to a display surface, but such setups also suffer from inherent visual conflicts, such as vergence/accommodation mismatches and double vision. In particular, if the user tries to select a virtual object with a finger or input device, either the virtual object or the user's finger will appear blurred, resulting in an ambiguity for selections that may significantly impact the user's performance. In this paper we evaluate the effect of visual conflicts for mid-air 3D selection performance within arm's reach on a stereoscopic table with a Fitts' Law experiment. We compare three different techniques with different levels of visual conflicts for selecting a virtual object: real hand, virtual offset cursor, and virtual offset hand. Our results show that the error rate is highest for the real hand condition and less for the virtual offset-based techniques. However, our results indicate that selections with the real hand resulted in the highest effective throughput of all conditions. This suggests that virtual offset-based techniques do not improve overall performance.},
keywords = {3D pointing, stereo},
}
@inproceedings{zabramski2012effect,
title = {The Effect of Shape Properties on Ad-hoc Shape Replication with Mouse, Pen, and Touch Input},
author = {Zabramski*, Stanislaw and Stuerzlinger, Wolfgang},
booktitle = {Proceeding of the 16th International Academic {MindTrek} Conference},
series = {MindTrek '12},
year = {2012},
month = {Oct},
pages = {275-278},
doi = {https://doi.org/10.1145/2393132.2393192},
pdf = {papers/shapereplication.pdf},
teaser = {teasers/shapereplication.png},
abstract = {This paper summarizes observations from four empirical studies focusing on shape replication with three input methods. The aim was to identify and assess how the components of several semi-randomly generated shapes influence how accurately untrained users can replicate each of these components. We found that the pen is the least and touch the most error-prone method when used for drawing. Additionally, the distribution of errors was analyzed. The results may be used to predict which shape properties make shape replication more difficult. Additionally, the results may be used to design shapes that are easy to replicate.},
keywords = {steering, drawing},
}
@inproceedings{liang20123dmanipulation,
title = {User-defined Surface+Motion Gestures for {3D} Manipulation of Objects at a Distance Through a Mobile Device},
author = {Liang, Hai-Ning and Williams*, Cary and Semegen, Myron and Stuerzlinger, Wolfgang and Irani, Pourang},
booktitle = {10th Asia Pacific Conference on Computer Human Unteraction},
series = {APCHI '12},
year = {2012},
month = {Aug},
pages = {299-308},
doi = {https://doi.org/10.1145/2350046.2350098},
pdf = {papers/dualsurface.pdf},
teaser = {teasers/dualsurface.png},
abstract = {One form of input for interacting with large shared surfaces is through mobile devices. These personal devices provide interactive displays as well as numerous sensors to effectuate gestures for input. We examine the possibility of using surface and motion gestures on mobile devices for interacting with 3D objects on large surfaces. If effective use of such devices is possible over large displays, then users can collaborate and carry out complex 3D manipulation tasks, which are not trivial to do. In an attempt to generate design guidelines for this type of interaction, we conducted a guessability study with a dual-surface concept device, which provides users access to information through both its front and back. We elicited a set of end-user surface- and motion-based gestures. Based on our results, we demonstrate reasonably good agreement between gestures for choice of sensory (i.e. tilt), multi-touch and dual-surface input. In this paper we report the results of the guessability study and the design of the gesture-based interface for 3D manipulation.},
keywords = {3D manipulation, touch},
}
@inproceedings{arif2011extending,
title = {Extending Mobile User Ambient Awareness for Nomadic Text Entry},
author = {Arif*, Ahmed Sabbir and Iltisberger+, Benedikt and Stuerzlinger, Wolfgang},
booktitle = {Australian Computer-Human Interaction Conference},
series = {OzCHI '11},
year = {2011},
month = {Nov},
pages = {21-30},
doi = {https://doi.org/10.1145/2071536.2071539},
pdf = {papers/nomadictextentry.pdf},
teaser = {teasers/nomadictextentry.png},
abstract = {Nowadays, we input text not only on stationary devices, but also on handheld devices while walking, driving, or commuting. Text entry on the move, which we term as nomadic text entry, is generally slower. This is partially due to the need for users to move their visual focus from the device to their surroundings for navigational purposes and back. To investigate if better feedback about users' surroundings on the device can improve performance, we present a number of new and existing feedback systems: textual, visual, textual & visual, and textual & visual via translucent keyboard. Experimental comparisons between the conventional and these techniques established that increased ambient awareness for mobile users enhances nomadic text entry performance. Results showed that the textual and the textual & visual via translucent keyboard conditions increased text entry speed by 14% and 11%, respectively, and reduced the error rate by 13% compared to the regular technique. The two methods also significantly reduced the number of collisions with obstacles.},
keywords = {text entry, mobile device, awareness},
}
@inproceedings{patel2011simulation,
title = {Simulation of a Virtual Reality Tracking System},
author = {Patel+, Kapil and Stuerzlinger, Wolfgang},
booktitle = {International Conference on Virtual Environments, Human-Computer Interfaces and Measurement Systems Proceedings},
publisher = {IEEE},
series = {VECIMS '11},
year = {2011},
month = {Sep},
pages = {78-83},
doi = {https://doi.org/10.1109/VECIMS.2011.6053849},
pdf = {papers/hedgesim.pdf},
teaser = {teasers/hedgesim.png},
abstract = {Virtual reality tracking systems are used to detect the position and orientation of a user inside spatially immersive systems. In this paper, we simulate a laser-based tracking system that was originally developed for a six-sided spatially immersive system in environments with one and five walls to evaluate its performance for other installations. As expected, the results show that performance degrades with the number of walls, but they also show that tracking with even one wall is still very feasible.},
keywords = {3D tracking, simulation, virtual reality},
}
@inproceedings{zhao2011comparison,
title = {Comparison of Multiple {3D} Rotation Methods},
author = {Zhao*, Yao Jun and Shuralyov*, Dmitri and Stuerzlinger, Wolfgang},
booktitle = {International Conference on Virtual Environments, Human-Computer Interfaces and Measurement Systems Proceedings},
publisher = {IEEE},
series = {VECIMS '11},
year = {2011},
month = {Sep},
pages = {13-17},
doi = {https://doi.org/10.1109/VECIMS.2011.6053855},
pdf = {papers/comparerotation.pdf},
teaser = {teasers/comparerotation.png},
abstract = {In this paper, we present an experimental comparison of 3D rotation techniques. In all techniques, the third degree of freedom is controlled by the mouse-wheel. The investigated techniques are Bell's Trackball, Shoemake's Arcball and the Two-axis Valuator method. The result from a pilot showed no performance or accuracy difference among these three. However, we did observe minor differences in an experiment with more participants and trials, though these differences were not significant. Also, from questionnaires, we found that most of the users considered the use of mouse wheel helpful for completing the tasks.},
keywords = {3D manipulation},
}
@inproceedings{mcclymont2011comparison,
title = {Comparison of {3D} Navigation Interfaces},
author = {{McClymont}*, Joshua and Shuralyov*, Dmitri and Stuerzlinger, Wolfgang},
booktitle = {International Conference on Virtual Environments, Human-Computer Interfaces and Measurement Systems Proceedings},
publisher = {IEEE},
series = {VECIMS '11},
year = {2011},
month = {Sep},
pages = {7-12},
doi = {https://doi.org/10.1109/VECIMS.2011.6053842},
pdf = {papers/comparenavigation.pdf},
teaser = {teasers/comparenavigation.png},
abstract = {This paper evaluates two different interfaces for navigation in a 3D environment. The first is a `Click-to-Move' style interface that involves using a mouse. The second is a gaming style interface that uses both mouse and keyboard (i.e. the `WASD' keys) for view direction and movement respectively. In the user study, participants were asked to navigate a supermarket environment and collect a specific subset of items. Results revealed significant differences only for some of the sub-measures. Yet, some revealing observations were made regarding user behavior and interaction with the user interface.},
keywords = {3D navigation},
}
@inproceedings{dadgari2011merging,
title = {New Techniques for Merging Text Versions},
author = {Dadgari*, Darius and Stuerzlinger, Wolfgang},
booktitle = {Human-Computer Interaction, Interaction Techniques and Environments},
publisher = {Springer},
series = {HCI International '11},
year = {2011},
month = {Jul},
volume = {LNCS 6762},
pages = {331-340},
doi = {https://doi.org/10.1007/978-3-642-21605-3_37},
pdf = {papers/version4text.pdf},
teaser = {teasers/version4text.png},
abstract = {Versioning helps users to keep track of different sets of edits on a document. Version merging methods enable users to determine which parts of which version they wish to include in the next or final version. We explored several existing and two new methods (highlighting and overlay) in single and multiple window settings. We present the results of our quantitative user studies, which show that the new highlighting and overlay techniques are preferred for version merging tasks. The results suggest that the most useful methods are those which clearly and easily present information that is likely important to the user, while simultaneously hiding less important information. Also, multi window version merging is preferred over single window merging.},
keywords = {difference visualization, merging},
}
@inproceedings{zaman2011effect,
title = {The Effect of Animation Dual-View, Difference Layers and Relative Re-Layout in Hierarchical Diagram Differencing},
author = {Zaman*, Loutfouz and Kalra+, Ashish and Stuerzlinger, Wolfgang},
booktitle = {Graphics Interface},
series = {GI '11},
year = {2011},
month = {May},
pages = {183-190},
url = {https://graphicsinterface.org/proceedings/gi2011/gi2011-24},
pdf = {papers/versiondiff4diagrams.pdf},
teaser = {teasers/versiondiff4diagrams.png},
abstract = {We present a new system for visualizing and merging differences in diagrams that uses animation, dual views, a storyboard, relative re-layout, and layering. We ran two user studies investigating the benefits of the system. The first user study compared pairs of hierarchical diagrams with matching node positions. The results underscore that naïve dual-view visualization is undesirable. On the positive side, participants particularly liked the dual-view with difference layer technique. The second user study focused on diagrams with partially varying node positions and difference visualization and animation. We found evidence that both techniques are beneficial, and that the combination was preferred.},
keywords = {difference visualization, diagram},
}
@inproceedings{ashtiani20112d,
title = {{2D} Similarity Transformations on Multi-Touch Surfaces},
author = {Ashtiani*, Behrooz and Stuerzlinger, Wolfgang},
booktitle = {Graphics Interface},
series = {GI '11},
year = {2011},
month = {May},
pages = {57-64},
url = {https://graphicsinterface.org/proceedings/gi2011/gi2011-8},
pdf = {papers/xnt2d.pdf},
video = {videos/XNT.mp4},
teaser = {teasers/xnt2d.png},
abstract = {We present and comparatively evaluate two new object transformation techniques for multi-touch surfaces. Specifying complete two-dimensional similarity transformations requires a minimum of four degrees of freedom: two for position, one for rotation, and another for scaling. Many existing techniques for object transformation are designed to function with traditional input devices such as mice, single-touch surfaces, or stylus pens. The challenge is to map controls appropriately for each of these devices. A few multi-touch techniques have been proposed in the past, but no comprehensive evaluation has been presented.
XNT is a new three-finger object transformation technique, designed for multi-touch surfaces. It provides a natural interface for two-dimensional manipulation. XNT and several existing techniques were evaluated in a user study. The results show that XNT is superior for all tasks that involve scaling and competitive for tasks that involve only rotation and positioning.},
keywords = {touch, manipulation},
}
@inproceedings{pavlovych2011target,
title = {Target Following Performance in the Presence of Latency, Jitter, and Signal Dropouts},
author = {Pavlovych*, Andriy and Stuerzlinger, Wolfgang},
booktitle = {Graphics Interface},
series = {GI '11},
year = {2011},
month = {May},
pages = {33-40},
url = {https://graphicsinterface.org/proceedings/gi2011/gi2011-5},
pdf = {papers/trackingperformance.pdf},
teaser = {teasers/trackingperformance.png},
abstract = {In this paper we describe how human target following performance changes in the presence of latency, latency variations, and signal dropouts. Many modern games and game systems allow for networked, remote participation. In such networks latency, variations and dropouts are commonly encountered factors.
Our user study reveals that all of the investigated factors decrease tracking performance. The errors increase very quickly for latencies of over 110 ms, for latency jitters above 40 ms, and for dropout rates of more than 10 %. The effects of target velocity on errors are close to linear, and transverse errors are smaller than longitudinal ones. The results can be used to better quantify the effects of different factors on moving objects in interactive scenarios. They also aid the designers in selecting target sizes and velocities, as well as in adjusting smoothing, prediction and compensation algorithms.},
keywords = {target following, jitter},
}
@inproceedings{teather2011pointing,
title = {Pointing at {3D} Targets in a Stereo Head-Tracked Virtual Environment},
author = {Teather*, Robert J. and Stuerzlinger, Wolfgang},
booktitle = {Symposium on {3D} User Interfaces},
publisher = {IEEE},
series = {3DUI '11},
year = {2011},
month = {Mar},
pages = {87-94},
doi = {https://doi.org/10.1109/3DUI.2011.5759222},
pdf = {papers/fishtankfitts.pdf},
teaser = {teasers/fishtankfitts.png},
abstract = {We present three experiments that systematically examine pointing tasks in fish tank VR using the ISO 9241-9 standard. All experiments used a tracked stylus for a both direct touch and ray-based technique. Mouse-based techniques were also studied. Our goal was to investigate means of comparing 2D and 3D pointing techniques. The first experiment used a 2D task constrained to the display surface, allowing direct validation against other 2D studies. The second experiment used targets stereoscopically presented above and parallel to the display, i.e., the same task, but without tactile feedback afforded by the screen. The third experiment used targets varying in all three dimensions. Results of these studies suggest that the conventional 2D formulation of Fitts' law works well for planar pointing tasks even without tactile feedback, and with stereo display. Fully 3D motions using the ray and mouse based techniques are less well modeled.},
keywords = {3D pointing},
}
@inproceedings{dehmeshki2010designeval,
title = {Design and Evaluation of a Perceptual-based Object Group Selection Technique},
author = {Dehmeshki*, Hoda and Stuerzlinger, Wolfgang},
booktitle = {24th BCS Interaction Specialist Group Conference},
series = {BCS-HCI '10},
year = {2010},
month = {Sep},
pages = {365-372},
doi = {https://doi.org/10.14236/ewic/HCI2010.43},
pdf = {papers/persel.pdf},
video = {videos/PerSel.mp4},
teaser = {teasers/persel.png},
abstract = {Selecting groups of objects is a frequent task in graphical user interfaces since it precedes all manipulation operations. Current selection techniques such as lasso become time-consuming and error-prone in dense configurations or when the area covered by targets is large or hard to reach. Perceptual-based selection techniques can considerably improve the selection task when the targets have a perceptual structure, driven by Gestalt principles of proximity and good continuity. However, current techniques use ad hoc grouping algorithms that often lack evidence from perception science. Moreover, they do not allow selecting arbitrary groups (i.e. without a perceptual structure) or modifying a selection. This paper presents a domain-independent perceptual-based selection technique that addresses these issues. It is built upon an established group detection model from perception research and provides intuitive interaction techniques for selecting (whole or partial) groups with curvi-linear or random structures. Our user study shows that this technique not only outperforms rectangle selection and lasso techniques when targets have perceptual structure, but also it is competitive when targets have arbitrary arrangements.},
keywords = {group selection},
}
@inproceedings{dadgari2010novel,
title = {Novel User Interfaces for Diagram Versioning and Differencing},
author = {Dadgari*, Darius and Stuerzlinger, Wolfgang},
booktitle = {24th BCS Interaction Specialist Group Conference},
series = {BCS-HCI '10},
year = {2010},
month = {Sep},
pages = {62-71},
doi = {https://doi.org/10.14236/ewic/HCI2010.10},
pdf = {papers/version4diagram.pdf},
teaser = {teasers/version4diagram.png},
abstract = {Easily available software for diagram creation does not support the comparison of different versions and the merging of such versions. We present new methods and techniques for easy versioning of general two-dimensional diagrams. Multiple novel versioning methods for diagram versioning are compared to each other as well as to previous work in a user study. Participants in a user study preferred the Translucency View and Master Diagram Scenario to the other investigated methods and scenarios.},
keywords = {difference visualization, diagram},
}
@inproceedings{das2010proactive,
title = {Proactive Interference in Location Learning: A New Closed-Form Approximation},
author = {Das*, Arindam and Stuerzlinger, Wolfgang},
booktitle = {International Conference on Cognitive Modeling},
publisher = {Drexel University},
series = {ICCM '10},
year = {2010},
month = {Aug},
pages = {37-42},
url = {https://iccm-conference.neocities.org/2010/proceedings},
pdf = {papers/proactiveinter.pdf},
teaser = {teasers/proactiveinter.png},
abstract = {The ACT-R cognitive theory models forgetting in general with a constant "decay due to passage of time" parameter. However, this is not sufficient to predict learning for frequently executed tasks in dense arrangements of items. Prominent examples are two-dimensional location learning in finding keys on a keyboard or clicking on items on a web page or in a graphical user interface. Our work presents a new way to theoretically model the effect of Proactive Interference, i.e. the effect of the history of events on location learning, through an extension to ACT-R's mathematical model of declarative memory strength. It predicts that each time an item is searched for and found, the item gets "stronger", i.e. easier to remember. However, this strength diminishes not only through the passage of time, but also due to interference from other (non-target) items that have been encountered in the past. We tested the predictions of our new model against empirical measurements from two previous studies that involve simple visual search and selection. The predictions fit the experimental data very well.},
keywords = {learning, text entry},
}
@inproceedings{zaman2010cloning,
title = {A New Interface for Cloning Objects in Drawing Systems},
author = {Zaman*, Loutfouz and Stuerzlinger, Wolfgang},
booktitle = {Graphics Interface},
series = {GI '10},
year = {2010},
month = {May},
pages = {27-34},
url = {https://graphicsinterface.org/proceedings/gi2010/gi2010-5},
pdf = {papers/cloning.pdf},
teaser = {teasers/cloning.png},
abstract = {Cloning objects is a common operation in graphical user interfaces. One example is calendar systems, where users commonly create and modify recurring events, i.e. repeated clones of a single event. Inspired by the calendar paradigm, we introduce a new cloning technique for 2D drawing programs. This technique allows users to clone objects by first selecting them and then dragging them to create clones along the dragged path. Moreover, it allows editing the generated sequences of clones similar to the editing of calendar events. Novel approaches for the generation of clones of clones are also presented.
We compared our new clone creation technique with generic duplication via copy-and-paste, smart duplication, and a dialog driven technique on a standard desktop system. The results show that the new cloning method is always faster than dialogs and smart duplication for most conditions. We also compared our clone editing method against rectangular selection. The results show that our method is better in general. In situations where rectangle selection is effective, our method is still competitive. Participants preferred the new techniques overall, too.},
keywords = {drawing, cloning, copy, paste},
}
@inproceedings{arif2010predicting,
title = {Predicting the Cost of Error Correction in Character-Based Text Entry Technologies},
author = {Arif*, Ahmed Sabbir and Stuerzlinger, Wolfgang},
booktitle = {{SIGCHI} Conference on Human Factors in Computing Systems},
publisher = {ACM},
series = {CHI '10},
year = {2010},
month = {Apr},
pages = {5-14},
doi = {https://doi.org/10.1145/1753326.1753329},
pdf = {papers/errorcostmodel.pdf},
teaser = {teasers/errorcostmodel.png},
abstract = {Researchers have developed many models to predict and understand human performance in text entry. Most of the models are specific to a technology or fail to account for human factors and variations in system parameters, and the relationship between them. Moreover, the process of fixing errors and its effects on text entry performance has not been studied. Here, we first analyze real-life text entry error correction behaviors. We then use our findings to develop a new model to predict the cost of error correction for character-based text entry technologies. We validate our model against quantities derived from the literature, as well as with a user study. Our study shows that the predicted and observed cost of error correction correspond well. At the end, we discuss potential applications of our new model.},
keywords = {text entry, errors},
}
@inproceedings{phillips2009friction,
title = {Can Friction Improve Mouse-Based Text Selection?},
author = {Phillips*, Dustin and Stuerzlinger, Wolfgang},
booktitle = {International Conference Science and Technology for Humanity},
publisher = {IEEE},
series = {TIC-STH '09},
year = {2009},
month = {Sep},
pages = {89-94},
doi = {https://doi.org/10.1109/TIC-STH.2009.5444369},
pdf = {papers/frictionselect.pdf},
teaser = {teasers/frictionselect.png},
abstract = {Text selection via caret positioning is a common task in modern word processing interfaces. It is a difficult task as target size - the distance between characters - is very small. We adapt Baudisch's snap-and-go technique for target acquisition to insert additional motor space at such targets when the mouse is decelerating. This increases the size of the target in motor space, thus potentially reducing the difficulty of text selection tasks. We expand this idea by introducing the concept of context-sensitive friction to improve target acquisition for common targets. We performed two pilot studies and a controlled user study to evaluate the new techniques. Our results indicate that selectively introducing friction into the interface can reduce total task time in common text selection tasks.},
keywords = {selection, snapping, mouse},
}
@inproceedings{arif2009analysis,
title = {Analysis of Text Entry Performance Metrics},
author = {Arif*, Ahmed Sabbir and Stuerzlinger, Wolfgang},
booktitle = {International Conference Science and Technology for Humanity},
publisher = {IEEE},
series = {TIC-STH '09},
year = {2009},
month = {Sep},
pages = {100-105},
doi = {https://doi.org/10.1109/TIC-STH.2009.5444533},
pdf = {papers/textperfmetrics.pdf},
teaser = {teasers/textperfmetrics.png},
abstract = {Researchers have proposed many text entry systems to enable users to perform this frequent task as quickly and precise as possible. Unfortunately the reported data varies widely and it is difficult to extract meaningful average entry speeds and error rates from this body of work. In this article we collect data from well-designed and well-reported experiments for the most important text entry methods, including those for handheld devices. Our survey results show that thumb keyboard is the fastest text entry method after the standard QWERTY keyboard, and that Twiddler is fastest amongst non-QWERTY methods. Moreover, we survey how text entry errors were handled in these studies. Finally, we conducted a user study to detect which effect different error-handling methodologies have on text entry performance metrics. Our study results show that the way human errors are handled has indeed a significant effect on all frequently used error metrics.},
keywords = {text entry, errors},
}
@inproceedings{teather2009evaluating,
title = {Evaluating Visual/Motor Co-location in Fish-Tank Virtual Reality},
author = {Teather*, Robert J. and Allison, Robert and Stuerzlinger, Wolfgang},
booktitle = {International Conference Science and Technology for Humanity},
publisher = {IEEE},
series = {TIC-STH '09},
year = {2009},
month = {Sep},
pages = {624-629},
doi = {https://doi.org/10.1109/TIC-STH.2009.5444423},
pdf = {papers/colocateddisjoint.pdf},
teaser = {teasers/colocateddisjoint.png},
abstract = {Virtual reality systems often co-locate the display and input (motor) spaces. Many input devices, such as the mouse, use indirect input mappings, and are disjoint from the display space. A study of visual/motor co-location was conducted to determine if there is any benefit to working directly "in" a virtual environment. Using a fish-tank VR setup, participants performed a 3D object movement task. This required moving an object from the centre of the environment to target regions, using a tracked pen, in both co-located and disjoint display/input conditions. Results were analyzed in the context of Fitts' Law, which models rapid aimed movements. Ultimately, no significant differences were found between co-located and disjoint conditions. However, when analyzing object movement in specific directions, the co-located condition was somewhat better than the disjoint one. In particular, movement into the scene was faster when the display and input device were co-located rather than disjoint.},
keywords = {3D pointing},
}
@inproceedings{dehmeshki2009icelasso,
title = {ICE-Lasso: An Enhanced Form Of Lasso Selection},
author = {Dehmeshki*, Hoda and Stuerzlinger, Wolfgang},
booktitle = {International Conference Science and Technology for Humanity},
publisher = {IEEE},
series = {TIC-STH '09},
year = {2009},
month = {Sep},
pages = {630-635},
doi = {https://doi.org/10.1109/TIC-STH.2009.5444424},
pdf = {papers/icelasso.pdf},
teaser = {teasers/icelasso.png},
abstract = {Lasso selection tends to be inefficient in many circumstances such as selecting spatially large clusters. ICE-Lasso is a novel technique that infers likely target clusters during an ongoing lasso gesture. It provides efficient gesture-based interaction techniques as shortcuts to select partial, complete, and multiple clusters. Additionally, it is overloaded on the traditional lasso via automatic mode switching. A comparative user study show that ICE-Lasso is significantly more efficient than lasso and also well-liked by users.},
keywords = {group selection},
}
@inproceedings{scoditti2009new,
title = {A New Layout Method for Graphical User Interfaces},
author = {Scoditti*, Adriano and Stuerzlinger, Wolfgang},
booktitle = {International Conference Science and Technology for Humanity},
publisher = {IEEE},
series = {TIC-STH '09},
year = {2009},
month = {Sep},
pages = {642-647},
doi = {https://doi.org/10.1109/TIC-STH.2009.5444422},
pdf = {papers/intuilayout.pdf},
teaser = {teasers/intuilayout.png},
abstract = {The layout mechanisms for many GUI toolkits are hard to understand, the associated tools and API's often difficult to use. This work investigates new, easy-to-understand layout mechanisms and evaluates its implementation. We will analyze the requirements for the definition of layouts of a graphical user interface. Part of the issue is that several aspects need to be considered simultaneously while laying-out a component: the alignment with other components as well as its own behaviour while resizing its container. Moreover, the used tools should isolate the designer/drawer from the implementation details of the framework. We present the details of our new GUI layout system, discuss the choices we made for our new layout algorithm and detail implementation issues. Moreover, we present also the user interface for our new GUI builder system that contains several innovations, such as a preview window to show the effects of layout configuration choices in real-time. We present an evaluation of our new system by attacking the complex GUI layout problem mentioned above.},
keywords = {GUI, layout},
}
@inproceedings{pavlovych2009tradeoff,
title = {The Tradeoff Between Spatial Jitter and Latency in Pointing Tasks},
author = {Pavlovych*, Andriy and Stuerzlinger, Wolfgang},
booktitle = {Symposium on Engineering Interactive Computing Systems},
publisher = {ACM},
series = {EICS '09},
year = {2009},
month = {Jul},
pages = {187-196},
doi = {https://doi.org/10.1145/1570433.1570469},
pdf = {papers/latencyjitter.pdf},
teaser = {teasers/latencyjitter.png},
abstract = {Interactive computing systems frequently use pointing as an input modality, while also supporting other forms of input such as alphanumeric, voice, gesture, and force.We focus on pointing and investigate the effects of input device latency and spatial jitter on 2D pointing speed and accuracy. First, we characterize the latency and jitter of several common input devices. Then we present an experiment, based on ISO 9241-9, where we systematically explore combinations of latency and jitter on a desktop mouse to measure how these factors affect human performance. The results indicate that, while latency has a stronger effect on human performance compared to low amounts of spatial jitter, jitter dramatically increases the error rate, roughly inversely proportional to the target size.The findings can be used in the design of pointing devices for interactive systems, by providing a guideline for choosing parameters of spatial filtering to compensate for jitter, since stronger filtering typically also increases lag. We also describe target sizes at which error rates start to increase notably, as this is relevant for user interfaces where hand tremor or similar factors play a major role.},
keywords = {pointing, jitter},
}
@inproceedings{dehmeshki2009gpsel,
title = {GPSel: A Gestural Perceptual-based Path Selection Technique},
author = {Dehmeshki*, Hoda and Stuerzlinger, Wolfgang},
booktitle = {Smart Graphics},
publisher = {Springer},
series = {SG '09},
year = {2009},
month = {May},
volume = {LNCS 5531},
pages = {243-252},
doi = {https://doi.org/10.1007/978-3-642-02115-2_21},
pdf = {papers/gpsel.pdf},
teaser = {teasers/gpsel.png},
abstract = {This paper introduces a gestural perceptual-based approach to select objects, i.e., nodes and/or edges along paths. Based on known results from perception research, we propose a model to detect perceptually salient paths formed by the Gestalt principles of good continuity and closure. Then we introduce gestural interaction techniques that enable users to select single or multiple perceptual paths, as well as resolving ambiguities in selection. The result of a user study shows that our system outperforms current techniques for path selection.},
keywords = {group selection, gestures},
}
@inproceedings{teather2009effectstracking,
title = {Effects of Tracking Technology, Latency, and Spatial Jitter on Object Movement},
author = {Teather*, Robert J. and Pavlovych*, Andriy and Stuerzlinger, Wolfgang and {MacKenzie}, I. Scott},
booktitle = {Symposium on {3D} User Interfaces},
publisher = {IEEE},
series = {3DUI '09},
year = {2009},
month = {Mar},
pages = {43-50},
doi = {https://doi.org/10.1109/3DUI.2009.4811204},
pdf = {papers/deviceeffects3D.pdf},
teaser = {teasers/deviceeffects3D.png},
abstract = {We investigate the effects of input device latency and spatial jitter on 2D pointing tasks and 3D object movement tasks. First, we characterize jitter and latency in a 3D tracking device and an optical mouse used as a baseline comparison. We then present an experiment based on ISO 9241-9, which measures performance characteristics of pointing devices. We artificially introduce latency and jitter to the mouse and compared the results to the 3D tracker. Results indicate that latency has a much stronger effect on human performance than low amounts of spatial jitter. In a second study, we use a subset of conditions from the first to test latency and jitter on 3D object movement. The results indicate that large, uncharacterized jitter ldquospikesrdquo significantly impact 3D performance.},
keywords = {3D pointing, latency, jitter},
}
@inproceedings{das2008modeling,
title = {Modeling Learning Effects in Mobile Texting},
author = {Das*, Arindam and Stuerzlinger, Wolfgang},
booktitle = {International Conference on Mobile and Ubiquitous Multimedia},
publisher = {ACM},
series = {MUM '08},
year = {2008},
month = {Dec},
pages = {154-161},
doi = {https://doi.org/10.1145/1543137.1543169},
pdf = {papers/learneffectsmodel.pdf},
teaser = {teasers/learneffectsmodel.png},
abstract = {No work on mobile text messaging so far has taken into account the effect of learning on the change in visual exploration behavior as users progress from non-expert to expert level. We discuss within the domain of multi-tap texting on mobile phone and address the process of searching versus selecting a letter on the keypad interface. We develop a simulation model that forecasts the probability of letter location recall by non-expert users and thereby models learning, as the user acquires expertise in recalling, with practice, session after session. We then plugin this probability within a model of visual strategy that combines the effect of different ways visual exploration: non-expert users search for a letter while expert users select a letter. The observed non-expert non-motor time preceding a key press (for a letter) correlates extremely well with the simulation results.},
keywords = {text entry, learning},
}
@inproceedings{teather2008exaggerated,
title = {Exaggerated Head Motions for Game Viewpoint Control},
author = {Teather*, Robert J. and Stuerzlinger, Wolfgang},
booktitle = {Conference on Future Play: Research, Play, Share},
publisher = {ACM},
series = {FuturePlay '08},
year = {2008},
month = {Nov},
pages = {240-243},
doi = {https://doi.org/10.1145/1496984.1497034},
pdf = {papers/headmotion.pdf},
teaser = {teasers/headmotion.png},
abstract = {In this paper, we present an evaluation of exaggerated headcoupled camera motions in a game-like 3D object movement. Three exaggeration levels were compared to determine if the exaggeration was more beneficial than a realistic 1:1 mapping.The results suggest that there is some user preference for this type of exaggeration; however, no significant differences by the experimental conditions were found, other than a learning effect.},
keywords = {3D navigation, head motion},
}
@inproceedings{pavlovych2008screenconfiguration,
title = {Effect of Screen Configuration and Interaction Devices in Shared Display Groupware},
author = {Pavlovych*, Andriy and Stuerzlinger, Wolfgang},
booktitle = {3rd Workshop on Human-centered Computing},
publisher = {ACM},
series = {HCC '08},
year = {2008},
month = {Oct},
pages = {49-56},
doi = {https://doi.org/10.1145/1462027.1462035},
pdf = {papers/multi_effects.pdf},
teaser = {teasers/multi_effects.png},
abstract = {Interactive tabletop and wall surfaces support collaboration and interactivity in novel ways. Apart from keyboards and mice, such systems can also incorporate other input devices, namely laser pointers, marker pens with screen location sensors, or touch-sensitive surfaces. Similarly, instead of a vertically positioned desktop monitor, collaborative setups typically use much larger displays, which are oriented either vertically (wall) or horizontally (tabletop), or combine both kinds of surfaces.In this paper we describe an empirical study that investigates how technical system constraints can affect group performance in high pace collaborative tasks. For this, we compare various input and output modalities in a system that consists of several interactive tabletop and wall surface(s). We observed that the performance of a group of people scaled almost linearly with the number of participants on an almost perfectly parallel task. We also found that mice were significantly faster than laser pointers, but only by 21%. Also, interaction on walls was significantly faster than on the tabletop, by 51%.},
keywords = {groupware, large display interaction, large display system},
}
@inproceedings{dehmeshki2008groupselect,
title = {Intelligent Mouse-based Object Group Selection},
author = {Dehmeshki*, Hoda and Stuerzlinger, Wolfgang},
booktitle = {Smart Graphics 2008},
publisher = {Springer},
series = {SG '08},
year = {2008},
month = {Aug},
volume = {LNCS 5166},
pages = {33-44},
doi = {https://doi.org/10.1007/978-3-540-85412-8_4},
pdf = {papers/gestaltclick1.pdf},
video = {videos/Gestalt.mp4},
teaser = {teasers/gestaltclick1.png},
abstract = {Modern graphical user interfaces support direct manipulation of objects and object groups. Current object group selection techniques such as lasso and rectangle selection can be time-consuming and error-prone. This paper presents a new approach to group selection that exploits the way human perception naturally groups objects, also known as Gestalt grouping. Based on known results from perception research, we present a novel method to group objects via models of the Gestalt principles of proximity and (curvi-)linearity. Then, we introduce several new mouse-based selection techniques that exploit these Gestalt groups. The results of a user study show that our new technique outperforms lasso and rectangle selection for object groups with an implicit structure, such as (curvi-)linear arrangements or clusters.},
keywords = {group selection},
}
@inproceedings{kerr2008context,
title = {Context-Sensitive Cut, Copy, and Paste},
author = {Kerr+, Reid and Stuerzlinger, Wolfgang},
booktitle = {Conference on Computer Science and Software Engineering},
publisher = {ACM},
series = {C3S2E '08},
year = {2008},
month = {May},
pages = {159-166},
doi = {https://doi.org/10.1145/1370256.1370283},
pdf = {papers/csccap.pdf},
teaser = {teasers/csccap.png},
abstract = {Creating and editing source code are tedious and error-prone processes. One important source of errors in editing programs is the failure to correctly adapt a block of copied code to a new context. This occurs because several dependencies to the surrounding code usually need to be adapted for the new context and it is easy to forget one of them. Conversely, this also makes such errors hard to find.This paper presents a new method for identifying some common types of errors in cut, copy and paste operations. The method analyzes the context of the original block of code and tries to match it with the context in the new location. It utilizes a simple, pattern-based model of context, which we found to be well suited to the analysis of relocated blocks of text. Furthermore, we discuss the ability of our technique to detect semantic errors. While semantic errors are relatively difficult to recognize in a static document, our new technique can infer important information from the original context to detect some semantic mismatches. Finally, we present a proof-of-concept implementation and discuss our simple user interface for context-sensitive cut, copy and paste.},
keywords = {copy, paste, editing, context-sensitive},
}
@inproceedings{teather2008assessing,
title = {Assessing the Effects of Orientation and Device on (Constrained) {3D} Movement Techniques},
author = {Teather*, Robert J. and Stuerzlinger, Wolfgang},
booktitle = {Symposium on {3D} User Interfaces},
publisher = {IEEE},
series = {3DUI '08},
year = {2008},
month = {Mar},
pages = {43-50},
doi = {https://doi.org/10.1109/3DUI.2008.4476590},
pdf = {papers/move3deval.pdf},
teaser = {teasers/move3deval.png},
abstract = {We present two studies to assess which physical factors influence 3D object movement tasks with various input devices. Since past research has shown that a mouse with suitable mapping techniques can serve as a good input device for some 3D object movement tasks, we also evaluate which characteristics of the mouse sustain its success. Our first study evaluates the effect of a supporting surface across orientation of input device movement and display orientation. A 3D tracking device was used in all conditions for consistency. The results of this study are inconclusive; no significant differences were found between the factors examined. The results of a second study show that the mouse outperforms the tracker for speed in all instances. The presence of support also improved accuracy when tracker movement is limited to 2D operation. A 3DOF movement mode performed worst overall.},
keywords = {3D positioning, 3D pointing, orientation},
}
@inproceedings{teather2007guidelines,
title = {Guidelines for {3D} Positioning Techniques},
author = {Teather*, Robert J. and Stuerzlinger, Wolfgang},
booktitle = {Conference on Future Play},
publisher = {ACM},
series = {Futureplay '07},
year = {2007},
month = {Nov},
pages = {61-68},
doi = {https://doi.org/10.1145/1328202.1328214},
pdf = {papers/move3dguidelines.pdf},
teaser = {teasers/move3dguidelines.png},
abstract = {In this paper, we present a set of guidelines for designing 3D positioning techniques. These guidelines are intended for developers of object interaction schemes in 3D games, modeling packages, computer aided design systems, and virtual environments. The guidelines promote intuitive object movement techniques in these types of environments.We then present a study comparing 3D positioning techniques based on these guidelines with 2D and 3D/6D devices across VR display technologies. Display technologies such as stereoscopic graphics and head-coupled perspective provide additional depth cues and could affect how a user perceives and thus interacts with a 3D scene - regardless of the input device/technique used. Thus they are examined as well. The results suggest that 2D devices using "smart" movement algorithms can outperform 3D devices.},
keywords = {3D positioning, orientation},
}
@inproceedings{das2007cognitive,
title = {A Cognitive Simulation Model for Novice Text Entry on Cell Phone Keypads},
author = {Das*, Arindam and Stuerzlinger, Wolfgang},
booktitle = {14th European Conference on Cognitive Ergonomics: Invent! Explore!},
publisher = {ACM},
series = {ECCE '07},
year = {2007},
month = {Aug},
pages = {141-147},
doi = {https://doi.org/10.1145/1362550.1362579},
pdf = {papers/novicecogmodel.pdf},
teaser = {teasers/novicecogmodel.png},
abstract = {Motivation - To create a cognitive simulation model that predicts text entry performance and learning on cell phone keypads by novice users. Research approach - A programmable cognitive architecture, ACT-R, is used to execute the simulation model. Part of the simulation result is compared with the result of a previous user study. Findings/Design - The proposed model is an a priori model (not tuned to any real user data) that predicts the amount of time spent in finding a key on the keypad and pressing it repeatedly. The predicted amount of time in finding a key differs by 6% and the time between two repeated key-presses of the same key by 27% compared to the results of a previous user study. The model also captures the learning of keypad layout by novice users. Memorization of keypad layout is simulated using task repetition. Research limitations/Implications - This research has several limitations described towards the end of this paper. An important one among them is that the work does not model the impact of visual distracters in the field of view (frontal surface of the handset) on user performance. Originality/Value - This is the first cognitive simulation model of novice user's text entry performance and learning on cell phone keypads. Take away message - This work introduces an a priori congnitive model of text entry by novice users. This forms a basis for systematic exploration of keypad designs for cell phones in shorter time and lower cost.},
keywords = {text entry, learning},
}
@inproceedings{tumanov2007variabilityaware,
title = {Variability-Aware Latency Amelioration in Distributed Environments},
author = {Tumanov*, Alexey and Allison, Robert and Stuerzlinger, Wolfgang},
booktitle = {Virtual Reality Conference},
publisher = {IEEE},
series = {VR '07},
year = {2007},
month = {Mar},
pages = {123-130},
doi = {https://doi.org/10.1109/VR.2007.352472},
pdf = {papers/latencypredict.pdf},
teaser = {teasers/latencypredict.png},
abstract = {Application designers of collaborative distributed virtual environments must account for the influence of the network connection and its detrimental effects on user performance. Based upon analysis and classification of existing latency compensation techniques, this paper introduces a novel approach to latency amelioration in the form of a two-tier predictor-estimator framework. The technique is variability-aware due to its proactive sender-side prediction of a pose a variable time into the future. The prediction interval required is estimated based on current and past network delay characteristics. This latency estimate is subsequently used by a Kalman filter-based predictor to replace the measurement event with a predicted pose that matches the event's arrival time at the receiving workstation. The compensation technique was evaluated in a simulation through an offline playback of real head motion data and network delay traces collected under a variety of real network conditions. The experimental results indicate that the variability-aware approach significantly outperforms a state-of-the-art one, which assumes a constant system delay},
keywords = {latency, jitter, virtual reality},
}
@inproceedings{stuerzlinger2006uifacades,
title = {User Interface Façades: Towards Fully Adaptable User Interfaces},
author = {Stuerzlinger, Wolfgang and Chapuis, Olivier and Phillips*, Dustin and Roussel, Nicolas},
booktitle = {19th Symposium on User Interface Software and Technology},
publisher = {ACM},
series = {UIST '06},
year = {2006},
month = {Oct},
pages = {309-318},
doi = {https://doi.org/10.1145/1166253.1166301},
url = {https://ws.iat.sfu.ca/facades},
pdf = {papers/uifacades.pdf},
video = {videos/uifacades.mp4},
teaser = {teasers/uifacades.png},
abstract = {User interfaces are becoming more and more complex. Adaptable and adaptive interfaces have been proposed to address this issue and previous studies have shown that users prefer interfaces that they can adapt to self-adjusting ones. However, most existing systems provide users with little support for adapting their interfaces. Interface customization techniques are still very primitive and usually constricted to particular applications. In this paper, we present User Interface Façades, a system that provides users with simple ways to adapt, reconfigure, and re-combine existing graphical interfaces, through the use of direct manipulation techniques. The paper describes the user's view of the system, provides some technical details, and presents several examples to illustrate its potential.},
keywords = {facades, GUI, layout, copy, paste},
}
@inproceedings{oh2006sesame,
title = {{SESAME}: Towards Better {3D} Conceptual Design Systems},
author = {Oh*, Ji-Young and Stuerzlinger, Wolfgang and Danahy, John},
booktitle = {6th Conference on Designing Interactive Systems},
publisher = {ACM},
series = {DIS '06},
year = {2006},
month = {Jun},
pages = {80-89},
doi = {https://doi.org/10.1145/1142405.1142419},
pdf = {papers/sesameui.pdf},
video = {videos/sesame.m4v},
teaser = {teasers/sesameui.png},
abstract = {Conceptual design dominates the early stages of most creative design processes. During these stages, the designer makes important decisions about the parameters of a model that are aimed at satisfying a set of design criteria. To do this, the designer produces many sketches of various possible solutions. Meanwhile, computer-aided design (CAD) systems are becoming the dominant visual medium used in design practice. However, these tools evolved as documentation production tools and do not support conceptual thinking. This paper presents a list of guidelines for computer support for conceptual design activities on 3D scenes and presents SESAME (Sketch, Extrude, Sculpt, and Manipulate Easily), a system based on these guidelines. Finally, we present a user study comparing SESAME with a conventional CAD package to demonstrate the effectiveness of SESAME.},
keywords = {design, snapping, 3D positioning, 3D manipulation, 3D modeling},
}
@inproceedings{baradaran2006comparison,
title = {A Comparison of Real and Virtual {3D} Construction Tools with Novice Users},
author = {Baradaran+, Hooman and Stuerzlinger, Wolfgang},
booktitle = {International Conference on Computer Graphics & Virtual Reality},
series = {CGVR '06},
isbn = {978-1-93241585-8},
year = {2006},
month = {Jun},
pages = {10-14},
url = {https://dblp.org/db/conf/cgvr/cgvr2006},
pdf = {papers/hapticslego.pdf},
teaser = {teasers/hapticslego.png},
abstract = {In this paper, we present the results of a comparative evaluation of a "virtual Lego" system against real Lego bricks with novice users. The virtual Lego system was designed to emulate the behavior of real Lego bricks as close as possible, while still allowing for efficient operation. We implemented two different user interfaces for the virtual Lego system, namely controlling it with a 2D mouse, based on an efficient mapping from 2D to 3D, as well as with a 3D haptics device, which provides haptic feedback to the user. The results of our study show that real Lego is still significantly faster for first-time users (i.e. users with minimal training). A more surprising result is that the 2D mouse condition and the 3D haptics condition did not differ significantly - even though the 3D haptics condition provides much richer feedback. We discuss the results and speculate about the underlying reasons.},
keywords = {haptics, 3D positioning, 3D manipulation, design, lego},
}
@inproceedings{parilov2006multiview,
title = {Multi-view Visibility Orderings for Real-Time Point-Sampled Rendering},
author = {Parilov*, Sergey and Stuerzlinger, Wolfgang},
booktitle = {International Conference on Computer Graphics & Virtual Reality},
series = {CGVR '06},
isbn = {978-1-93241585-8},
year = {2006},
month = {Jun},
pages = {125-131},
url = {https://dblp.org/db/conf/cgvr/cgvr2006},
pdf = {papers/fastibr.pdf},
video = {videos/ibr_pointsampled.mp4},
teaser = {teasers/fastibr.png},
abstract = {Occlusion-compatible traversals and z-buffering are often regarded as the only choices for resolving visibility in the image- and point-based rendering community. These algorithms do either per-frame or per-pixel computations. This paper first discusses visibility orderings for point samples in general and then discusses orderings that are valid for multiple views. Then we present a novel, highly efficient, visibility algorithm for point-sampled models that has much smaller per-frame cost than previous approaches. We also discuss a high-performance, cache friendly implementation of this visibility method and present results. Finally, we speculate on possible hardware implementations.},
keywords = {rendering, real-time, visibility},
}
@inproceedings{boehl2006areashadow,
title = {Real-time Computation Of Area Shadows - A Geometrical Algorithm},
author = {Boehl*, Michael and Stuerzlinger, Wolfgang},
booktitle = {International Conference on Computer Graphics & Virtual Reality},
series = {CGVR '06},
isbn = {978-1-93241585-8},
year = {2006},
month = {Jun},
pages = {118-124},
url = {https://dblp.org/db/conf/cgvr/cgvr2006},
pdf = {papers/penumbras.pdf},
teaser = {teasers/penumbras.png},
abstract = {The computation of soft shadows created by area light sources is a well-known problem in computer graphics. Due to the complexity of the problem, soft shadows commonly are generated only for images that are rendered in an off-line process. In interactive virtual environments, where images have to be computed in real time, soft shadows are mostly replaced by hard shadows as this takes much less time to compute.
This paper presents an algorithm that uses a geometrical method to generate a triangulated approximation of the soft shadow cast by a polygonal object very quickly. The algorithm can simulate effects such as the varying width of penumbras depending on distance to the light and can be extended to support non-convex light sources as well. We mention the artifacts arising from triangulation and give discuss how to alleviate such problems.},
keywords = {rendering, real-time},
}
@inproceedings{oh2006groupselect,
title = {Group Selection Techniques for Efficient {3D} Modeling},
author = {Oh*, Ji-Young and Stuerzlinger, Wolfgang and Dadgari*, Darius},
booktitle = {Symposium on {3D} User Interfaces},
publisher = {IEEE},
series = {3DUI '06},
year = {2006},
month = {Mar},
pages = {95-102},
doi = {https://doi.org/10.1109/VR.2006.66},
pdf = {papers/sesamegrouping.pdf},
video = {videos/sesame_multiclick.m4v},
teaser = {teasers/sesamegrouping.png},
abstract = {Object selection and manipulation (e.g. moving, rotating) are the most basic tasks in 3D scene construction. While most research on selection and manipulation techniques targets single objects, we examine the concept of group selection in this paper. Group selection is often given lesser importance than single object selection, yet is vital in providing users with a way to modify larger scenes with objects which are repetitive, sequential, or otherwise inherently understood as 'belonging together' by a user. We observed users manipulating objects in 3D scenes, and while doing so, they clearly expected that objects would be grouped based on their gravitational relationship. That is, all objects that are supported by some selected object will follow the motion of the selected object when manipulated. In this paper, we present a system that efficiently supports the manipulation of groups of objects via a gravitational hierarchy. As this hierarchy is derived with a collision detector, the new grouping techniques do not require semantic or user specified information to work. The results of the evaluation show that using the gravitational hierarchy improves scene rearrangement significantly compared to conventional non-hierarchical methods. Finally, we discuss lessons learned from this study and make some suggestions on how the results can be incorporated into other systems.},
keywords = {group selection, 3D positioning, 3D modeling, 3D manipulation},
}
@inproceedings{pavlovych2005hdrproject,
title = {A High-Dynamic Range Projection System},
author = {Pavlovych*, Andriy and Stuerzlinger, Wolfgang},
booktitle = {Photonic Applications in Biosensing and Imaging},
publisher = {SPIE},
series = {Photonics North '05},
year = {2005},
month = {Sep},
volume = {SPIE 5969},
numpages = {8},
doi = {https://doi.org/10.1117/12.629117},
url = {https://ws.iat.sfu.ca/hdrproj.html},
pdf = {papers/hdrproject.pdf},
teaser = {teasers/hdrproject.png},
abstract = {The dynamic range in many real-world environments surpasses the capabilities of traditional display technologies by several orders of magnitude. Recently, a novel display capable of displaying images with a dynamic range much closer to real world situations has been demonstrated. This was achieved through a spatially modulated backlight behind an LCD panel. Combined with the modulating power of the LCD panel itself, this enabled the display of much higher contrast compared to an LCD panel with a spatially uniform backlight.
In this paper, we describe a further development of the technology, namely a high dynamic range projection system. This makes such display systems more widely applicable as any surface can be used for the display of high dynamic range images.
Our new system is designed as an external attachment to a regular DLP-based projector, which allows the use of unmodified projectors. It works by adapting the projected image via a set of lenses to form a small image. This small image is then modulated via an LCD panel and the result is projected via another lens system onto a larger screen, as in traditional projection scenarios. The double modulation, by the projector and the LCD panel together, creates a high dynamic range image and an ANSI contrast of over 700:1.
Finally, we discuss the advantages and disadvantages of our design relative to other high and low dynamic range display technologies and its potential applications.},
keywords = {high dynamic range, projector},
}
@inproceedings{oh2005comparing,
title = {Comparing {SESAME} and Sketching on Paper for Conceptual {3D} Design},
author = {Oh*, Ji-Young and Stuerzlinger, Wolfgang and Danahy, John},
booktitle = {Sketch-Based Interfaces and Modeling},
publisher = {Eurographics},
series = {SBM '05},
year = {2005},
month = {Aug},
pages = {81-88},
doi = {https://doi.org/10.2312/SBM/SBM05/081-087},
pdf = {papers/sesamecompare.pdf},
teaser = {teasers/sesamecompare.png},
abstract = {In the early stages of design, several concepts are usually generated to explore the possibilities. This paper investigates how well a computer-based system can support design thinking. SESAME is a novel 3D design system that aims to support creativity during the explorative phase of the design process. We report an evaluation comparing SESAME to paper sketching for early design exploration in an urban design scenario. Through the user evaluation, we illustrate how important it is to support essential properties of traditional sketching, such as rapid creation/modification, emergent shapes, and tolerance to ambiguity. Additionally, we show that a 3D system can indeed facilitate form exploration at the early stages of design thinking.},
keywords = {3D modeling, 3D manipulation, 3D sketching, drawing},
footnote = {SESAME was a co-evolution with SketchUp, https://www.sketchup.com},
}
@inproceedings{pavlovych2005analysis,
title = {An Analysis of Novice Text Entry Performance on Large Interactive Wall Surfaces},
author = {Pavlovych*, Andriy and Stuerzlinger, Wolfgang},
booktitle = {Human Computer International, CD},
publisher = {Lawrence Erlbaum},
series = {HCI International '05},
isbn = {978-080585807-5},
year = {2005},
month = {Jul},
numpages = {10},
url = {http://www.hci.international/index.php?module=conference&CF_op=view&CF_id=4},
pdf = {papers/whiteboardtext.pdf},
teaser = {teasers/whiteboardtext.png},
abstract = {This paper presents a comparative study of several soft keyboard layouts for text entry on interactive whiteboards. We compare the traditional QWERTY with several other layouts, including theoretically optimal ones, such as FITALY. In contrast to previous work, we concentrate on novice performance, as few people ever gain expert status on whiteboards.
The results show that for a population of regular keyboard users, QWERTY is the best alternative and even the slightest deviations from that arrangement degrade the performance significantly. Based on the experiments, we present an in-depth analysis of the behaviour of users for several layouts from a cognitive viewpoint.},
keywords = {text entry, large display interaction, novice},
}
@inproceedings{stachniak2005terrain,
title = {An Algorithm for Automated Fractal Terrain Deformation},
author = {Stachniak*, Szymon and Stuerzlinger, Wolfgang},
booktitle = {Computer Graphics and Artificial Intelligence},
series = {3IA '05},
commented-isbn = {978-291425607-0},
year = {2005},
month = {May},
pages = {64-76},
url = {http://www.msi.unilim.fr/3IA},
pdf = {papers/fractaldeform.pdf},
video = {videos/fractal_deform.mp4},
teaser = {teasers/fractaldeform.png},
abstract = {Fractal terrains provide an easy way to generate realistic landscapes. There are several methods to generate fractal terrains, but none of those algorithms allow the user much flexibility in controlling the shape or properties of the final outcome. A few methods to modify fractal terrains have been previously proposed, both algorithm-based as well as by hand editing, but none of these provide a general solution.
In this work, we present a new algorithm for fractal terrain deformation. We present a general solution that can be applied to a wide variety of deformations. Our approach employs stochastic local search to identify a sequence of local modifications, which deform the fractal terrain to conform to a set of specified constraints. The presented results show that the new method can incorporate multiple constraints simultaneously, while still preserving the natural look of the fractal terrain.},
keywords = {fractal, terrain, rendering, ray tracing},
}
@inproceedings{oh2005moving,
title = {Moving Objects with {2D} Input Devices in CAD Systems and Desktop Virtual Environments},
author = {Oh*, Ji-Young and Stuerzlinger, Wolfgang},
booktitle = {Graphics Interface},
series = {GI '05},
year = {2005},
month = {May},
pages = {195-202},
url = {https://graphicsinterface.org/proceedings/gi2005/gi2005-24},
pdf = {papers/move3d.pdf},
video = {videos/sesameMove3D2005.mp4},
teaser = {teasers/move3d.png},
abstract = {Part assembly and scene layout are basic tasks in 3D design in Desktop Virtual Environment (DVE) systems as well as Computer Aided Design (CAD) systems. 2D input devices such as a mouse or a stylus are still the most common input devices for such systems. With such devices, a notably difficult problem is to provide an efficient and predictable object motion in 3D based on their 2D motion. This paper presents a new technique to move objects in CAD/DVE using 2D input devices.
The technique presented in this paper utilizes the fact that people easily recognize the depth-order of shapes based on occlusions. In the presented technique, the object position follows the mouse cursor position, while the object slides on various surfaces in the scene. In contrast to existing techniques, the movement surface and the relative object position is determined using the whole area of overlap of the moving object with the static scene. The resulting object movement is visually smooth and predictable, while avoiding undesirable collisions. The proposed technique makes use of the framebuffer for efficiency and runs in real-time. Finally, the evaluation of the new technique with a user study shows that it compares very favorably to conventional techniques.},
keywords = {3D positioning, 3D modeling, 3D manipulation, sliding},
}
@inproceedings{vorozcovs2005hedgehog,
title = {The Hedgehog: A Novel Optical Tracking Method for Spatially Immersive Displays},
author = {Vorozcovs*, Andrew and Hogue*, Andrew and Stuerzlinger, Wolfgang},
booktitle = {Virtual Reality},
publisher = {IEEE},
series = {VR '05},
year = {2005},
month = {Mar},
pages = {83-89},
doi = {https://doi.org/10.1109/VR.2005.1492757},
pdf = {papers/hedgehog.pdf},
teaser = {teasers/hedgehog.png},
abstract = {Existing commercial technologies do not adequately meet the requirements for tracking in fully-enclosed VR displays. We present the Hedgehog, which overcomes several limitations imposed by existing sensors and tracking technology. The tracking system robustly and reliably estimates the 6DOF pose of the device with high accuracy and a reasonable update rate. The system is composed of several cameras viewing the display walls and an arrangement of laser diodes secured to the user. The light emitted from the lasers projects onto the display walls and the 2D centroids of the projections are tracked to estimate the 6DOF pose of the device. The system is able to handle ambiguous laser projection configurations, static and dynamic occlusions of the lasers, and incorporates an intelligent laser activation control mechanism that determines which lasers are most likely to improve the pose estimate. The Hedgehog is also capable of performing auto-calibration of the necessary camera parameters through the use of the SCAAT algorithm. A preliminary evaluation reveals that the system has an angular resolution of 0.01 degrees RMS and a position resolution of 0.2 mm RMS.},
keywords = {3D tracking},
}
@inproceedings{pavlovych2004laser,
title = {Laser Pointers as Interaction Devices for Collaborative Pervasive Computing},
author = {Pavlovych*, Andriy and Stuerzlinger, Wolfgang},
booktitle = {Advances in Pervasive Computing},
publisher = {OCG},
series = {Pervasive '04},
isbn = {978-385403176-5},
year = {2004},
month = {Apr},
pages = {315-320},
url = {http://www.pervasive2004.org},
pdf = {papers/lasers_improved.pdf},
teaser = {teasers/lasers_improved.png},
abstract = {We present a system that supports collaborative interactions for arbitrary environments. The system uses laser pointers as interaction devices and employs a video camera to detect where each laser pointer is pointing. Time-division multiplexing together with a wireless link affords discrimination between laser pointer dots belonging to different pointers. Safety issues with laser pointers are addressed with a new technique. We also discuss how new users can be dynamically added and removed from the system.},
keywords = {pointing, collaboration, laser},
}
@inproceedings{pavlovych2004model,
title = {Model for non-Expert Text Entry Speed on 12-Button Phone Keypads},
author = {Pavlovych*, Andriy and Stuerzlinger, Wolfgang},
booktitle = {{SIGCHI} Conference on Human Factors in Computing Systems},
publisher = {ACM},
series = {CHI '04},
year = {2004},
month = {Apr},
pages = {351-358},
doi = {https://doi.org/10.1145/985692.985737},
pdf = {papers/novicemodel.pdf},
teaser = {teasers/novicemodel.png},
abstract = {In this paper we present a new model for predicting text entry speed on a 12-button mobile phone keypad. The proposed model can predict the performance of novice users. Like other models for text entry, the proposed model includes a movement component based on Fitts' law and a linguistic component based on letter digraph probabilities. It also adds cognitive delay times before key presses and takes into account the fact that Fitts' law cannot model multiple presses of the same key accurately. Finally, we compare the prediction of our model to previously published experimental results, demonstrate that it fits observed results for novices very well, and list some observations about learning.},
keywords = {text entry, mode, novice},
}
@inproceedings{oh2003intelligent,
title = {Intelligent Manipulation Techniques for Conceptual {3D} Design},
author = {Oh*, Ji-Young and Stuerzlinger, Wolfgang},
booktitle = {Human-Computer Interaction},
publisher = {IFIP},
series = {INTERACT '03},
isbn = {978-158603363-7},
year = {2003},
month = {Sep},
pages = {319-326},
url = {https://www.interaction-design.org/literature/conference/proceedings-of-ifip-interact03-human-computer-interaction},
pdf = {papers/legomanip.pdf},
video = {videos/lego.m4v},
teaser = {teasers/legomanip.png},
abstract = {One of the main operations in conceptual 3D design is the rearrangement of single and composite objects. This paper presents a new conceptual 3D design system that affords easy manipulation of composite objects. We discuss several alternative manipulation techniques to separate complex parts off an existing model. Then, we present a new way to move such parts in a 3D scene, as well as an algorithm to place parts at arbitrary locations. Finally, we present and discuss the results of a user study of these manipulation techniques.},
keywords = {3D modeling, 3D positioning, 3D manipulation, lego},
}
@inproceedings{pavlovych2003lesstap,
title = {Less-Tap: A Fast and Easy-to-learn Text Input Technique for Phones},
author = {Pavlovych*, Andriy and Stuerzlinger, Wolfgang},
booktitle = {Graphics Interface},
series = {GI '03},
year = {2003},
month = {Jun},
pages = {97-104},
doi = {https://doi.org/10.20380/GI2003.12},
pdf = {papers/lesstap.pdf},
teaser = {teasers/lesstap.png},
abstract = {A new technique to enter text using a mobile phone keypad, Less-Tap, is described. The traditional touch-tone phone keypad is ambiguous for text input because each button encodes 3 or 4 letters. As in Multitap, our method requires the user to press buttons repeatedly to get a required letter. However, in Less-Tap, letters are rearranged within each button according to their frequency. This way, the most common letters require only one key press.
Unlike dictionary based methods, Less-Tap facilitates the entry of arbitrary words. Unlike LetterWise and T9, Less-Tap allows entering text without having to visually verify the result, after some initial training. For English, Less-Tap requires an average of 1.5266 keystrokes per character (vs. 2.0342 in Multitap).
We conducted a user study to compare Less-Tap against Multitap. Each participant had three 20-minute sessions with each technique. The mean entry speed was 9.5% higher with the new technique.},
keywords = {text entry, mobile device},
}
@inproceedings{oh2002laser,
title = {Laser Pointers as Collaborative Pointing Devices},
author = {Oh*, Ji-Young and Stuerzlinger, Wolfgang},
booktitle = {Graphics Interface},
series = {GI '02},
year = {2002},
month = {May},
pages = {141-149},
doi = {https://doi.org/10.20380/GI2002.17},
pdf = {papers/multi_laser.pdf},
video = {videos/laser_multi.mp4},
teaser = {teasers/multi_laser.png},
abstract = {Single Display Groupware (SDG) is a research area that focuses on providing collaborative computing environments. Traditionally, most hardware platforms for SDG support only one person interacting at any given time, which limits collaboration. In this paper, we present laser pointers as input devices that can provide concurrent input streams ideally required to the SDG environment.
First, we discuss several issues related to utilization of laser pointers and present the new concept of computer controlled laser pointers. Then we briefly present a performance evaluation of laser pointers as input devices and a baseline comparison with the mouse according to the ISO 9241-9 standard.
Finally, we describe a new system that uses multiple computer controlled laser pointers as interaction devices for one or more displays. Several alternatives for distinguishing between different laser pointers are presented, and an implementation of one of them is demonstrated with SDG applications.},
keywords = {laser, pointing, collaboration},
}
@inproceedings{stuerzlinger2002efficient,
title = {Efficient Manipulation of Object Groups in Virtual Environments},
author = {Stuerzlinger, Wolfgang and Smith*, Graham},
booktitle = {Virtual Reality},
publisher = {IEEE},
series = {VR '02},
year = {2002},
month = {Mar},
pages = {251-258},
doi = {https://doi.org/10.1109/VR.2002.996529},
pdf = {papers/mive_vr2002.pdf},
video = {videos/mive_duals.mp4},
teaser = {teasers/mive_vr2002.png},
abstract = {We describe simple techniques for object group manipulation, an important operation in user interaction with a virtual environment. All presented manipulation techniques exploit constraints to simplify user interaction. The techniques are based on how humans perceive groups and afford direct manipulation of such groups. Furthermore, we introduce two new intuitive ways to create a whole group of objects: drag-add and random drag-add. Finally, we present an evaluation of the presented techniques.},
keywords = {group selection, 3D positioning, 3D manipulation},
}
@inproceedings{robinson2002ivy,
title = {IVY: The Immersive Visual Environment at York},
author = {Robinson, Matt and Laurence, Jeff R. and Zacher, James and Hogue*, Andrew and Allison, Robert and Harris, Laurence and Jenkin, Michael and Stuerzlinger, Wolfgang},
booktitle = {International Immersive Projection Technology Symposium},
series = {IPT '02},
year = {2002},
month = {Mar},
numpages = {6},
url = {http://vr.iao.fhg.de/ipt-egve},
pdf = {papers/ivy_ipt2002.pdf},
teaser = {teasers/ivy_ipt2002.png},
abstract = {Given the limitations of head mounted display systems, there has been significant interest in the development of large-scale virtual environments such as video walls, immersive project displays, and similar devices. Although these devices do provide a wide-field visual display, very few of these devices are completely immersive as the user may view the visual world or they may be tethered to the real world via tracking systems. In this paper we present the motivation and design of IVY: The Immersive Visual environment currently under construction at Y ork University (IVY).},
keywords = {cave, immersive display system, 3D tracking},
}
@inproceedings{robinson2001growing,
title = {Growing IVY: Building the Immersive Visual Environment at York},
author = {Robinson, Matt and Laurence, Jeff R. and Zacher, James and Hogue*, Andrew and Allison, Robert and Harris, Laurence and Jenkin, Michael and Stuerzlinger, Wolfgang},
booktitle = {11th International Conference on Artificial Reality and Tele-existence},
series = {ICAT '01},
year = {2001},
month = {Dec},
pages = {85-89},
url = {http://icat.vrsj.org/ICAT2001},
pdf = {papers/ivy_icat2001.pdf},
teaser = {teasers/ivy_icat2001.png},
abstract = {When we move about within our environment, we are presented with a range of cues to our motion. Virtual reality systems attempt to simulate these various sensory cues. IVY – the Immersive Visual environment at York – is a virtual environment being constructed at York University to investigate aspects of human perception and to examine the relative importance of various visual and non-visual cues to the generation of an effective virtual environment. This paper describes the movation behind the design of IVY, and describes the design of the essential hardware and software components.},
keywords = {cave, immersive display system, 3D tracking},
}
@inproceedings{smith2001integration,
title = {Integration of Constraints into a VR Environment},
author = {Smith*, Graham and Stuerzlinger, Wolfgang},
booktitle = {Virtual Reality International Conference, Laval Virtual},
series = {VRIC '01},
isbn = {978-295157300-0},
year = {2001},
month = {Jun},
pages = {103-110},
pdf = {papers/mive_vric2001.pdf},
video = {videos/mive_creation.mp4},
teaser = {teasers/mive_vric2001.png},
abstract = {Interactive Virtual Reality applications are in general complex and non-intuitive. One fundamental problem is that manipulation of 3D objects is very difficult for non-experienced users. We describe a constraint based 3D scene construction system that exploits human intuitions to restrict object placement and interactions. In particular, we focus on the constraints themselves by describing how they are defined, and how they are used within a scene. Several different types of constraints are discussed, including virtual constraints, which decouple the constraint areas from the geometry of an object, and negative constraints, which restrict object placements within certain volumes of space. Furthermore, we discuss techniques that can be used to automatically generate constraints for most geometric objects, which makes incorporating new objects into the system much easier. Finally, we argue that the presented constraint techniques can be incorporated into existing Virtual Reality systems to make interactions easier.},
keywords = {3D manipulation, 3D positioning, constraints},
}
@inproceedings{smith2001scenedevices,
title = {{3D} Scene Manipulation with {2D} Devices and Constraints},
author = {Smith*, Graham and Salzman*, Tim and Stuerzlinger, Wolfgang},
booktitle = {Graphics Interface},
series = {GI '01},
year = {2001},
month = {Jun},
pages = {135-142},
doi = {https://doi.org/10.20380/GI2001.16},
pdf = {papers/mive_gi2001.pdf},
video = {videos/mive_resize.mp4},
teaser = {teasers/mive_gi2001.png},
abstract = {Content creation for computer graphics applications is a laborious process that requires skilled personnel. One fundamental problem is that manipulation of 3D objects with 2D user interfaces is very difficult for non-experienced users.
In this paper, we introduce a new system that uses constraints to restrict object motion in a 3D scene, making interaction much simpler and more intuitive. We compare three different 3D scene manipulation techniques based on a 2D user interface. We show that the presented techniques are significantly more efficient than commonly used solutions. To our knowledge, this is the first evaluation of 3D manipulation techniques with 2D devices and constraints.},
keywords = {3D manipulation, 3D positioning, constraints},
}
@inproceedings{smith2001sceneconstraints,
title = {{3D} Scene Manipulation with Constraints},
author = {Smith*, Graham and Salzman*, Tim and Stuerzlinger, Wolfgang},
booktitle = {Virtual and Augmented Architecture},
series = {VAA '01},
year = {2001},
month = {Jun},
pages = {35-46},
doi = {https://doi.org/10.1007/978-1-4471-0337-0_4},
pdf = {papers/mive_vaa2001.pdf},
teaser = {teasers/mive_vaa2001.png},
abstract = {Content creation for computer graphics applications is a laborious process that requires skilled personnel. One fundamental problem is that manipulation of 3D objects with 2D user interfaces is very difficult for non-experienced users.
In this paper, we introduce a new system that uses constraints to restrict object motion in a 3D scene, making interaction much simpler and more intuitive. We compare three different 3D scene manipulation techniques based on a 2D user interface. We show that the presented techniques are significantly more efficient than commonly used solutions. To our knowledge, this is the first evaluation of 3D manipulation techniques with 2D devices and constraints.},
keywords = {3D manipulation, 3D positioning, constraints},
}
@inproceedings{smith2001utility,
title = {On the Utility of Semantic Constraints},
author = {Smith*, Graham and Stuerzlinger, Wolfgang},
booktitle = {Virtual Environments},
publisher = {Eurorgraphics},
series = {EGVE '01},
year = {2001},
month = {May},
pages = {41-50},
doi = {https://doi.org/10.2312/EGVE/EGVE01/041-050},
pdf = {papers/mive_egve2001.pdf},
video = {videos/mive_pipes.mp4},
teaser = {teasers/mive_egve2001.png},
abstract = {Content creation for computer graphics applications is a laborious process that requires skilled personnel. One fundamental problem is that manipulation of 3D objects with 2D user interfaces is very difficult for non-experienced users. In this paper, we describe a system that uses semantic constraints to restrict object motion in a 3D scene, making interaction much simpler and more intuitive. We compare three different levels of semantic constraints in a 3D scene manipulation program with a 2D user interface. We show that the pr esented techniques are significantly more efficient than alternate techniques, which do not use semantics in their constraints. To our knowledge, this is the first evaluation of 3D manipulation techniques with 2D devices and constraints.},
keywords = {3D manipulation, 3D positioning, constraints},
}
@inproceedings{salzman2001unconstrained,
title = {Unconstrained vs. Constrained {3D} Scene Manipulation},
author = {Salzman*, Tim and Stachniak*, Szymon and Stuerzlinger, Wolfgang},
booktitle = {Engineering for Human-Computer Interaction},
publisher = {Springer},
series = {EHCI '01},
year = {2001},
month = {May},
volume = {LNCS 2254},
pages = {207-219},
doi = {https://doi.org/10.1007/3-540-45348-2_19},
pdf = {papers/mive_ehci2001.pdf},
video = {videos/mive_playing.mp4},
teaser = {teasers/mive_ehci2001.png},
abstract = {Content creation for computer graphics applications is a very time-consuming process that requires skilled personnel. Many people find the manipulation of 3D object with 2D input devices non-intuitive and difficult. We present a system, which restricts the motion of objects in a 3D scene with constraints. In this publication we discuss an experiment that compares two different 3D manipulation interfaces via 2D input devices. The results show clearly that the new constraint-based interface performs significantly better than previous work.},
keywords = {3D manipulation, 3D positioning, constraints},
}
@inproceedings{stuerzlinger1999imaging,
title = {Imaging all Visible Surfaces},
author = {Stuerzlinger, Wolfgang},
booktitle = {Graphics Interface},
series = {GI '99},
year = {1999},
month = {Jun},
pages = {115-122},
doi = {https://doi.org/10.20380/GI1999.16},
pdf = {papers/imgvissurf.pdf},
teaser = {teasers/imgvissurf.png},
abstract = {Today many systems exist to generate geometric models of existing scenes and objects. However, very few systems store accurate data about surface appearance such as colors and textures. One way to capture surface texture data is to record a series of images that, collectively, captures all visible surfaces of the object. Finding good viewpoints for this task is not easy.
This paper presents a new heuristic method to find a good set of viewpoints for a given geometric model. Taking images from the computed viewpoints will show every visible part of every surface at least once. The approach uses a hierarchical visibility algorithm to preprocess the scene. A good set of viewing regions is identified with simulated annealing and then good viewpoints are derived. Results and visualizations of the computed solutions are presented.},
keywords = {3D scanning, next-best view, visibility},
}
@inproceedings{goesele1999semantic,
title = {Semantic Constraints for Scene Manipulation},
author = {Goesele*, Michael and Stuerzlinger, Wolfgang},
booktitle = {SCCG: Spring Conference in Computer Graphics},
series = {SCCG '99},
commented-isbn = {978-802231357-5},
year = {1999},
month = {Apr},
pages = {140-146},
url = {http://sccg.sk/1999_min},
pdf = {papers/semconstr.pdf},
teaser = {teasers/semconstr.png},
abstract = {The creation of object models for computer graphics applications, such as interior design or the generation of animations is a labour-intensive process. Today's computer aided design (CAD) programs address the problem of creating geometric object models quite well. But almost all users find common tasks, such as quickly furnishing a room, hard to accomplish. One of the basic reasons is that manipulation of objects often does not yield the expected results.
This paper presents a new system that exploits knowledge about natural behavior of objects to provide simple and intuitive interaction techniques for object manipulation. Semantic constraints are introduced, which encapsulate such `common knowledge' about objects. Furthermore, we present a new way to automatically infer a scene hierarchy by dynamically grouping objects according to their constraint relationships.},
keywords = {3D manipulation, 3D positioning, constraints},
}
@inproceedings{aliaga1999mmr,
title = {MMR: An Interactive Massive Model Rendering System Using Geometric and Image-Based Acceleration},
author = {Aliaga*, Daniel and Cohen*, Jon and Wilson*, Andrew and Baker*, Eric and Zhang*, Hansong and Erikson*, Carl and Hoff*, Kenny and Hudson*, Tom and Stuerzlinger, Wolfgang and Bastos*, Rui and Whitton, Mary and Brooks, Fred and Manocha, Dinesh},
booktitle = {Symposium on Interactive {3D} Graphics},
publisher = {ACM},
series = {I3D '99},
year = {1999},
month = {Apr},
pages = {199-206},
doi = {https://doi.org/10.1145/300523.300554},
pdf = {papers/mmr.pdf},
teaser = {teasers/mmr.png},
abstract = {We present a system for rendering very complex 3D models at interactive rates. We select a subset of the model as preferred viewpoints and partition the space into virtual cells. Each cell contains near geometry, rendered using levels of detailand visibility culling, and far geometry, rendered as a textured depth mesh. Our system automatically balances the screen-space errors resulting from geometric simplification with those from textured-depth-mesh distortion. We describe our prefetching and data management schemes, both crucial for models significantly larger than available system memory. We have successfully used our system to accelerate walkthroughs of a 13 million triangle model of a large coal-fired power plant and of a 1.7 million triangle architectural model. We demonstrate the walkthrough of a 1.3 GB power plant model with a 140 MB cache footprint.},
keywords = {rendering, real-time},
}
@comment{c, c={leave the "_stuerzlinger" in the ID to enable umlaut-free search!}}
@inproceedings{raskar_stuerzlinger1998efficient,
title = {Efficient Image Generation for Multiprojector and Multisurface Displays},
author = {Raskar*, Ramesh and Cutts*, Matt and Welch, Greg and Stürzlinger, Wolfgang},
booktitle = {Rendering Techniques},
publisher = {Springer},
series = {EGSR '98},
year = {1998},
month = {Jun},
pages = {139-144},
doi = {https://doi.org/10.1007/978-3-7091-6453-2_13},
pdf = {papers/multisurf.pdf},
teaser = {teasers/multisurf.png},
abstract = {We describe an efficient approach to rendering a perspectively correct image on a potentially irregular display surface that may be illuminated with one or more distinct devices. The first pass of the technique generates an image of the desired graphics model using conventional rendering. The second pass projects that image as a texture onto a model of the display surface, then re-renders the textured display surface model from the viewpoint of each display device. The algorithm scales with the complexity of the display surface, and is constant with respect to the complexity of the graphics model.},
keywords = {rendering, real-time, projector},
}
@inproceedings{stuerzlinger1997interactive,
title = {Interactive Rendering of Globally Illuminated Glossy Scenes},
author = {Stürzlinger, Wolfgang and Bastos*, Rui},
booktitle = {Rendering Techniques},
publisher = {Springer},
series = {EGSR '97},
year = {1997},
month = {Jun},
pages = {93-102},
doi = {https://doi.org/10.1007/978-3-7091-6858-5_9},
pdf = {papers/fastglos.pdf},
teaser = {teasers/fastglos.png},
abstract = {Global illumination simulates all transfers of light in a scene. The results of the simulation are then used to generate photo-realistic images. Scenes with diffuse surfaces only can be displayed in real-time using the results of radiosity methods. Images of scenes with more general surfaces are created with methods based on ray tracing but do not achieve interactive frame rates.This paper presents a new algorithm for the display of globally illuminated scenes at interactive speeds. A photon tracing phase computes an approximation to the global illumination. The rendering phase splats the contribution of each photon hit onto the corresponding surface taking reflectance properties and viewing direction into account. Results demonstrate that this method allows to render images of globally illuminated scenes with glossy surfaces at interactive frame rates.},
keywords = {rendering, real-time, global illumination},
}
@inproceedings{stuerzlinger1996generic,
title = {A Generic Interface to Colors, Materials, and Textures},
author = {Stürzlinger, Wolfgang},
booktitle = {Compugraphics},
publisher = {GRASP},
series = {Compugraphics '96},
isbn = {978-972834201-2},
year = {1996},
month = {Dec},
pages = {192-200},
pdf = {papers/genmat.pdf},
teaser = {teasers/genmat.png},
abstract = {Material models predict the reflection of light by surfaces in a scene. Many models have been proposed, all with different scope of effects and different parameters. The same holds for color models and texture definitions. Most computer graphics systems implement only one model with a minimal interface. If a different model is to be integrated this interface needs to be restructured which results in many code changes in the whole system.
This work presents a new approach to a generic interface to colors and materials. By enumerating all possible operations on these graphics objects an interface for reusable and portable code is defined. A seamless integration of textured surfaces into a computer graphics system is made possible by generic texture trees which implement the generic material interface. This portable definition of textures is realized via a tree of texture nodes and texture generators.},
keywords = {rendering, ray tracing},
}
@inproceedings{stuerzlinger1996bounding,
title = {Bounding Volume Construction Using Point Clouds},
author = {Stürzlinger, Wolfgang},
booktitle = {Spring Conference on Computer Graphics},
series = {SCCG '96},
isbn = {978-802231032-1},
year = {1996},
month = {Jun},
pages = {239-246},
url = {http://sccg.sk/1996_min},
pdf = {papers/pcloud.pdf},
teaser = {teasers/pcloud.png},
abstract = {Bounding volumes are used to optimize many graphic algorithms. They permit to decide quickly if a more exact test is likely to succeed or not. The exact test is only applied if the bounding volume test succeeds, which saves time in most cases. Two of the most prominent applications are ray tracing and collision detection.
This paper presents a new method to calculate tight bounding volumes for primitives under arbitrary transformations and hierarchical scene descriptions. An optimized form of storing a convex hull is presented which allows efficient calculation of the bounding volume type used for later processing. Results are shown for the ray tracing of cyclic CSG-graphs used to render plants and other natural phenomena.},
keywords = {rendering, ray tracing, bounding volumes},
}
@comment{c, c={leave the "_stuerzlinger" in the ID to enable umlaut-free search!}}
@inproceedings{burger_stuerzlinger1995immersive,
title = {Immersive Simulation for Computer Vision},
author = {Burger, Wilhelm and Barth, Matthew J. and Stürzlinger, Wolfgang},
booktitle = {Visual Modules},
publisher = {Oldenbourg Press},
isbn = {978-348623476-3},
year = {1995},
month = {May},
pages = {160-168},
pdf = {papers/vision.pdf},
teaser = {teasers/vision.png},
abstract = {Synthetic imagery has often been considered unsuitable for demonstrating the performance of vision algorithms and systems. We argue that (despite many remaining difficulties) simulation and computer graphics are at a point today that make them extremely useful for evaluation and training, even for complex outdoor applications. This is particularly valuable for autonomous and robotics applications, where the lack of suitable training data and ground truth information is a severe bottleneck. Extensive testing in a synthetic environment should become an integral part of the systems development and evaluation process to reduce the possibility of failure in the real word. We describe ongoing efforts towards the development of an "Immersive Perception Simulator" and discuss some of the specific problems involved.},
keywords = {rendering, computer vision, ray tracing, real-time},
}
@comment{c, c={leave the "_stuerzlinger" in the ID to enable umlaut-free search!}}
@inproceedings{schaufler_stuerzlinger1995exact,
title = {Exact and Error Bounded Approximations of Local Illumination},
author = {Schaufler*, Gernot and Stürzlinger, Wolfgang},
booktitle = {Compugraphics},
publisher = {GRASP},
series = {Compugraphics '95},
isbn = {978-972834200-5},
year = {1995},
month = {Dec},
pages = {327-333},
commented-url = {http://www.gup.uni-linz.ac.at:8001/staff/schaufler/papers/local},
pdf = {papers/localillum.pdf},
teaser = {teasers/localillum.png},
abstract = {Recent approaches to realistic image synthesis split the rendering process into two passes. The first pass calculates an approximate global illumination solution, the second produces an image of high quality (from a user selected view point) using the solution obtained in the first pass by applying the local illumination model to each surface point visible through each pixel. This paper presents a new method how to compute the visible surfaces as seen from a surface point - the hemisphere projection. This method allows the exact evaluation of the local illumination model and facilitates the fast and accurate computation of form factors taking occlusion into account. Using the hemisphere projection an exact local pass solution can be obtained. In addition the hemisphere projection can be used to compute an approximation of a point's local illumination to within given error bounds in significantly less time.},
keywords = {rendering, global illumination},
}
@comment{c, c={unfortunate-dup, quasi-parallel, but independent submission by different authors}}
@inproceedings{stuerzlinger1995load,
title = {Load Balancing for a Parallel Radiosity Algorithm},
author = {Stürzlinger, Wolfgang and Schaufler*, Gernot and Volkert, Jens},
booktitle = {Symposium on Parallel Rendering},
publisher = {ACM & IEEE},
series = {PRS '95},
year = {1995},
month = {Oct},
pages = {39-45},
doi = {https://doi.org/10.1145/218327.218335},
pdf = {papers/loadbalancing.pdf},
teaser = {teasers/loadbalancing.png},
abstract = {The radiosity method models the interaction of light between diffuse surfaces, thereby accurately predicting global illumination effects. Due to the high computational effort to calculate the transfer of light between surfaces and the memory requirements for the scene description, a distributed, parallelized version of the algorithm is needed for scenes consisting of thousands of surfaces.
We present several load distribution schemes for such a parallel algorithm which includes progressive refinement and adaptive subdivision for fast solutions of high quality. The load is distributed before the calculations in a static way. During the computation the load is redistributed dynamically to make up for individual differences in processor loads. The dynamic load balancing scheme never generates more data packets than the original algorithm and avoids overloading processors through actions taken by the scheme.},
keywords = {rendering, parallel, global illumination},
}
@comment{c, c={unfortunate-dup, quasi-parallel, but independent submission by different authors}}
@inproceedings{stuerzlinger1995strategies,
title = {Load Balancing Strategies for a Radiosity Algorithm},
author = {Stürzlinger, Wolfgang and Schaufler*, Gernot and Volkert, Jens},
booktitle = {High Performance Computing Symposium},
series = {HPCS '95},
isbn = {978-292131612-5},
year = {1995},
month = {Jul},
pages = {217-228},
url = {http://hpcs.ca},
pdf = {papers/loadbalancing1.pdf},
teaser = {teasers/loadbalancing1.png},
abstract = {The radiosity method models the interaction of light between diffuse surfaces, thereby accurately predicting global illumination effects. Due to the high computational effort to calculate the transfer of light between surfaces and the memory requirements for the scene description, a distributed, parallelized version of the algorithm is needed for scenes consisting of thousands of surfaces.
We present several load distribution schemes for such a parallel algorithm which includes progressive refinement and adaptive subdivision for fast solutions of high quality. The load is distributed before the calculations in a static way. During the computation the load is redistributed dynamically to make up for individual differences in processor loads. The dynamic load balancing scheme never generates more data packets than the original algorithm and avoids overloading processors through actions taken by the scheme.},
keywords = {rendering, parallel, global illumination},
}
@inproceedings{stuerzlinger1995exact,
title = {Exact Projections onto the Hemisphere},
author = {Stürzlinger, Wolfgang},
booktitle = {Spring Conference on Computer Graphics},
series = {SCCG '95},
isbn = {978-802330344-5},
year = {1995},
month = {May},
pages = {31-38},
pdf = {papers/hemisphere.pdf},
teaser = {teasers/hemisphere.png},
abstract = {Recent approaches to realistic image synthesis have split the rendering process into two passes. The first pass calculates an approximate global illumination solution, the second generates an image of high quality from a given view point using the illumination solution obtained in the first pass.
This paper discusses a new method for projecting polygons onto the hemisphere which is the central operation performed for each pixel during the local pass. The method calculates an exact hemispherical projection of all polygons considering occlusion. The chosen representation of the projected polygons facilitates the fast and accurate computation of formfactors with regard to the projection center.
The new hemispherical projection method is used to obtain an exact local pass solution.},
keywords = {rendering, global illumination},
footnote = {Newer work such as "Visibility Silhouettes for Semi-Analytic Spherical Integration", http://dx.doi.org/10.1111/cgf.12257 and "Vectorization for Fast, Analytic, and Differentiable Visibility", https://doi.org/10.1145/3452097 uses the same idea of decomposing projections into convex polygons.},
}
@comment{c, c={leave the "_stuerzlinger" in the ID to enable umlaut-free search!}}
@inproceedings{schaufler_stuerzlinger1995generating,
title = {Generating Multiple Levels of Detail for Polygonal Geometry Models},
author = {Schaufler*, Gernot and Stürzlinger, Wolfgang},
booktitle = {Virtual Environments},
publisher = {Springer},
series = {EGVE '95},
year = {1995},
month = {Jan},
pages = {33-41},
doi = {https://doi.org/10.1007/978-3-7091-9433-1_4},
commented-url = {http://www.gup.uni-linz.ac.at:8001/staff/schaufler/papers/lods},
pdf = {papers/lod.pdf},
teaser = {teasers/lod.png},
abstract = {This paper presents a new method for solving the following problem: Given a polygonal model of some geometric object generate several more and more approximative representations of this object containing less and less polygons. The idea behind the method is that small detail in the model is represented by many spatially close points. A hierarchical clustering algorithm is used to generate a hierarchy of clusters from the vertices of the object's polygons. The coarser the approximation the more points are found to lie within one cluster of points. Each cluster is replaced by one representative point and polygons are reconstructed from these points. A static detail elision algorithm was implemented to prove the practicability of the method. This paper shows examples of approximations generated from different geometry models, pictures of scenes rendered by a detail elision algorithm and timings of the method at work.},
keywords = {rendering, real-time},
}
@inproceedings{stuerzlinger1994parallel2,
title = {Parallel Visibility Calculations for Parallel Radiosity},
author = {Stürzlinger, Wolfgang and Wild*, Christoph},
booktitle = {Parallel Processing: CONPAR — VAPP VI},
publisher = {Springer},
series = {CONPAR '94},
year = {1994},
month = {Sep},
volume = {LNCS 854},
pages = {405-413},
doi = {https://doi.org/10.1007/3-540-58430-7_36},
pdf = {papers/parvis.pdf},
teaser = {teasers/parvis.png},
abstract = {The radiosity method models the interaction of light between diffuse reflecting surfaces, thereby accurately predicting global illumination effects. Due to the high computational effort to calculate the transfer of light between surfaces and the memory requirements for the scene description, a distributed, parallelized verison of the algorithm is needed for scenes consisting of thousands of surfaces. We present a distributed, parallel progressive radiosity algorithm. Then we parallelize the visibility calculations and analyze the results.},
keywords = {rendering, parallel, visibility, global illumination},
}
@inproceedings{stuerzlinger1994adaptive,
title = {Adaptive Mesh Refinement with Discontinuities for the Radiosity Method},
author = {Stürzlinger, Wolfgang},
booktitle = {Photorealistic Rendering Techniques},
publisher = {Springer},
series = {EGSR '94},
year = {1995},
commented-year = {1994},
month = {Aug},
commented-month = {Jun},
pages = {244-253},
doi = {https://doi.org/10.1007/978-3-642-87825-1_18},
pdf = {papers/disco.pdf},
teaser = {teasers/disco.png},
abstract = {The radiosity method simulates the interaction of light between diffuse reflecting surfaces, thereby accurately predicting global illumination effects. One of the main problems of the original algorithm is the inability to represent correctly the shadows cast onto surfaces. Adaptive subdivision techniques were tried but the results are not good enough for general purposes. The conceptually different discontinuity meshing algorithm produces exact pictures of shadow boundaries but is computationally expensive. The newly presented adaptive discontinuity meshing method combines the speed of adaptive subdivision with the quality of the discontinuity meshing method.},
keywords = {rendering, global illumination},
}
@inproceedings{stuerzlinger1994optimization,
title = {Two Optimization Methods for Ray Tracing},
author = {Stürzlinger, Wolfgang and Tobler*, Robert},
booktitle = {Spring School on Computer Graphics},
series = {SCCG '94},
isbn = {978-802230801-4},
year = {1994},
month = {Jun},
pages = {104-107},
pdf = {papers/rtopt.pdf},
teaser = {teasers/rtopt.png},
abstract = {Raytracing is a method to produce photo-realistic pictures. For each pixel of an image one ray is shot to find the object, which determines the color of the pixel. Rays are also used to simulate shadows and reflections. Previously bounding volume hierarchies have been used to speed raytracing. A new method to speed the traversal of a bounding volume hierarchy is presented. Optimisation methods to find the intersection point between the ray and the scene have been introduced previously. A new algorithm based on cylinders is presented also.},
keywords = {rendering, ray tracing},
}
@inproceedings{stuerzlinger1992radiosity,
title = {Radiosity with Voronoi Diagrams},
author = {Stürzlinger, Wolfgang},
booktitle = {Third Eurographics Workshop on Rendering},
publisher = {Consolidation Express},
series = {EGSR '92},
isbn = {978-189785100-5},
year = {1992},
month = {May},
pages = {169-177},
pdf = {papers/radvor.pdf},
teaser = {teasers/radvor.png},
abstract = {Current radiosity methods rely on the calculation of geometric factors, known as form-factors which describe energy exchange between the surfaces of an environment. The most widely used method for storing the illumination across a surface is a mesh of quadrilaterals and/or triangles. For more exact computations these meshes need to be subdivided adaptively. The subdivision methods create artifacts which have visible results. A new technique for storing the surface is presented, based on Voronoi diagrams, which are well suited for the task, and can be subdivided without introducing artifacts.},
keywords = {rendering, global illumination},
}
@comment{************************other_publications************************}
@misc{bashar2026vacgazecontroller,
title = {Effects of Visual Depth on Vergence–Accommodation Conflict in Gaze- and Controller-Based Selection in Virtual Reality},
author = {Bashar*, Mohammad Raihanul and Amini*, Mohammadreza and Mutasim, Aunnoy K. and Barrera Machuca, Mayra D. and Stuerzlinger, Wolfgang and Batmaz, Anil Ufuk},
booktitle = {Extended Abstracts of the CHI Conference on Human Factors in Computing Systems},
publisher = {ACM},
series = {CHI EA '26},
howpublished = {Extended Abstract},
year = {2026},
month = {Apr},
articleno = {250},
numpages = {6},
doi = {https://doi.org/10.1145/3772363.3798344},
pdf = {papers/vacgazecontroller.pdf},
abstract = {The vergence–accommodation conflict (VAC) in stereoscopic head-mounted displays is known to affect depth perception and interaction performance. Prior studies have examined its impact on a controller, but it remains unclear how the VAC affects gaze pointing in Virtual Reality. Here, we investigate gaze- and controller-based 3D target selection under varying depth conditions. Results show that gaze is more sensitive to depth variation, exhibiting longer movement times, higher variability along the task axis, and lower throughput compared to controller-based interaction. "Variation in Diopter" Fitts' law modeling further indicates greater depth-dependent variability for gaze input. Despite these differences, perceived usability and workload were comparable. These findings suggest that the VAC affects pointing modalities differently, which should be considered when designing gaze-enabled 3D interfaces.},
keywords = {eye gaze, 3D pointing},
}
@misc{motoe2026steeringpreview,
title = {Deriving Steering Time Models for Paths with Corners of Varying Curvature Based on Preview-Based Velocity Control},
author = {Motoe*, Koyo and Kasahara*, Nobuhito and Yamanaka, Shota and Stuerzlinger, Wolfgang and Miyashita, Homei},
booktitle = {Extended Abstracts of the CHI Conference on Human Factors in Computing Systems},
publisher = {ACM},
series = {CHI EA '26},
howpublished = {Extended Abstract},
year = {2026},
month = {Apr},
articleno = {204},
numpages = {6},
doi = {https://doi.org/10.1145/3772363.3798500},
pdf = {papers/steeringpreview.pdf},
abstract = {Steering operations, such as menu navigation and drawing, constitute a fundamental GUI interaction. The conventional Steering Law estimates movement times by accumulating the local width of the path, but it suffers from limited predictive accuracy for paths with varying curvature. In contrast, humans tend to adjust their speed by anticipating the path ahead (e.g., when driving). This study proposes a new Preview-based Model, which integrates geometric properties with visual constraints further along the path. Our experimental results show that our model achieved a higher adjusted R^2 (0.983) on curve-included paths than existing models. Furthermore, a simplified formulation without parameter tuning also exhibited comparable accuracy (adjusted R^2 = 0.972), confirming its effectiveness as a practical difficulty metric.},
keywords = {steering, lasso},
}
@misc{hu2025exploringgazesteering,
title = {Exploring and Modeling Gaze-Based Steering Behavior in Virtual Reality},
author = {Hu*, Xuning and Zhang*, Yichuan and Wei*, Yushi and Li, Yue and Stuerzlinger, Wolfgang and Liang, Hai-Ning},
booktitle = {Extended Abstracts of the CHI Conference on Human Factors in Computing Systems},
publisher = {ACM},
series = {CHI EA '25},
howpublished = {Extended Abstract},
year = {2025},
month = {Apr},
articleno = {260},
pages = {1-8},
doi = {https://doi.org/10.1145/3706599.3720273},
pdf = {papers/exploringgazesteering.pdf},
abstract = {Gaze-based interaction is a common input method in virtual reality (VR). Eye movements, such as fixations and saccades, result in different behaviors compared to other input methods. Previous studies on selection tasks showed that, unlike the mouse, the human gaze is insensitive to target distance and does not fully utilize target width due to the characteristics of saccades and micro-saccades of the eyes. However, its application in steering tasks remains unexplored. Since steering tasks are widely used in VR for menu adjustments and object manipulation, this study examines whether the findings from selection tasks apply to steering tasks. We also model and compare the Steering Law based on eye movement characteristics. To do this, we use data on movement time, average speed, and re-entry count. Our analysis investigates the impact of path width and length on performance. This work proposes three candidate models that incorporate gaze characteristics, which achieve a superior fit (R² > 0.964) compared to the original Steering Law, improving the accuracy of time prediction, AIC, and BIC by 7%, 26%, and 10%, respectively. These models offer valuable insights for game and interface designers who implement gaze-based controls in VR environments.},
keywords = {eye gaze, steering},
}
@misc{bashar2025depth3dsketch,
title = {Depth3DSketch: Freehand Sketching Out of Arm's Reach in Virtual Reality},
author = {Bashar*, Mohammad Raihanul and Amini*, Mohammadreza and Stuerzlinger, Wolfgang and Sarac, Mine and Pfeuffer, Ken and Barrera Machuca, Mayra D. and Batmaz, Anil Ufuk},
booktitle = {Extended Abstracts of the CHI Conference on Human Factors in Computing Systems},
publisher = {ACM},
series = {CHI EA '25},
howpublished = {Extended Abstract},
year = {2025},
month = {Apr},
articleno = {175},
pages = {1-8},
doi = {https://doi.org/10.1145/3706599.3719717},
pdf = {papers/depth3dsketch.pdf},
abstract = {Due to the increasing availability and popularity of virtual reality (VR) systems, 3D sketching applications have also boomed. Most of these applications focus on peripersonal sketching, e.g., within arm's reach. Yet, sketching in larger scenes requires users to walk around the virtual environment while sketching or to change the sketch scale repeatedly. This paper presents Depth3DSketch, a 3D sketching technique that allows users to sketch objects up to 2.5 m away with a freehand sketching technique. Users can select the sketching depth with three interaction methods: using the joystick on a single controller, the intersection from two controllers, or the intersection from the controller ray and the user's gaze. We compared these interaction methods in a user study. Results show that users preferred the joystick to select visual depth, but there was no difference in user accuracy or sketching time between the three methods.},
keywords = {eye gaze, 3D modeling, depth selection},
}
@misc{lu2025designinguiwithaiworkshop,
title = {Designing and Developing User Interfaces with AI: Advancing Tools, Workflows, and Practices},
author = {Lu*, Yuwen and Jiang*, Yue and Knearem, Tiffany and Kliman-Silver, Clara and Lutteroth, Christof and Nichols, Jeffery and Stuerzlinger, Wolfgang},
booktitle = {Extended Abstracts of the CHI Conference on Human Factors in Computing Systems},
publisher = {ACM},
series = {CHI EA '25},
howpublished = {Extended Abstract},
year = {2025},
month = {Apr},
articleno = {774},
pages = {1-7},
doi = {https://doi.org/10.1145/3706599.3706736},
pdf = {papers/designinguiwithaiworkshop25.pdf},
abstract = {Designing and developing user-friendly interfaces has long been a cornerstone of HCI research. However, we are now at a turning point for how user interfaces can be designed and evaluated with new AI-based models and tools. The latest AI models have shown capabilities to model user behaviors, automate end-user tasks, and even generate user interfaces. We are at a pivotal moment to reflect on current UI design and development practices and discuss the opportunities, challenges, and risks brought by AI. Both incremental improvements and transformative opportunities exist for designers, developers, and the hand-off process in between. In this proposed workshop, we encourage participants to envision AI-enabled UI prototyping tools, workflows, and practices. By bringing together academic researchers and industry practitioners, we aim to identify opportunities to enhance prototyping tools and reshape UI creation workflows for the future as well as discuss potential negative consequences of these tools.},
keywords = {GUI, layout, constraints},
}
@misc{lee2025personalizednav,
title = {Towards Personalized Navigation in XR: A User-Centered Approach to Accessibility},
author = {Lee, Jong-In and Stuerzlinger, Wolfgang},
booktitle = {Workshop on Locomotion and Wayfinding in XR, VR Adjunct Proceedings},
publisher = {IEEE},
series = {LocXR '25},
year = {2025},
month = {Mar},
pages = {241-245},
doi = {https://doi.org/10.1109/VRW66409.2025.00059},
pdf = {papers/personalizednav.pdf},
abstract = {Navigation interfaces in Extended Reality (XR) have traditionally targeted universal solutions that perform well for all users. However, research has shown that users exhibit distinct preferences and performance patterns when using different navigation techniques. This position paper argues for the necessity of and strategies for designing personalized navigation interfaces that accommodate individual differences in spatial abilities, navigation strategies, and accessibility needs. Drawing from empirical findings across multiple user studies investigating locomotion and wayfinding techniques and research in spatial cognition and navigation, we demonstrate how different user groups respond uniquely to navigation interface components. Based on these insights, we propose a framework for developing adaptive navigation interfaces that cater to individual user characteristics while maintaining usability. Furthermore, we discuss opportunities for standardization in user assessment, interface adaptation, and accessibility support. This approach could lead to more inclusive and effective navigation solutions for XR environments.},
keywords = {3D navigation, accessibility, virtual reality, augmented reality},
}
@misc{zhao2024barehandposter,
title = {A Novel Bare-Handed and Widget-based Manipulation Technique for Distant Objects in Virtual Reality},
author = {Zhao*, Di Bill and Stuerzlinger, Wolfgang},
booktitle = {ISMAR Adjunct Proceedings},
series = {ISMAR '24},
howpublished = {Poster},
year = {2024},
month = {Oct},
pages = {525-528},
doi = {https://doi.org/10.1109/ISMAR-Adjunct64951.2024.00152},
commented-pdf = {papers/barehandposter.pdf},
commented-teaser = {teasers/barehandposter.png},
abstract = {Recent advancements in bare-hand tracking technology in VR headsets enable intuitive hand interaction for proximate 3D object manipulation. This paper explores two-handed bare-hand interaction for distant 3D objects, by using the non-dominant hand as an interaction surface to enable adept manipulation of a distant 3D object's position and rotation. A user study demonstrated markedly higher precision in complex manipulation tasks compared to traditional methods while maintaining comparable efficiency and accuracy for simpler tasks. Our method also received a good usability rating, illustrating its user-centric and intuitive nature. We discuss insights on error prevention, constraint integration, and consistent interaction for future VR interaction methods.},
keywords = {3D interaction, 3D manipulation, hand tracking},
}
@misc{jiang2024computationaluiworkshop24,
title = {Computational Methodologies for Understanding, Automating, and Evaluating User Interfaces},
author = {Jiang*, Yue and Lu*, Yuwen and Knearem, Tiffany and Kliman-Silver, Clara and Lutteroth, Christof and Li, Toby Jia-Jun and Nichols, Jeffery and Stuerzlinger, Wolfgang},
booktitle = {Extended Abstracts of the CHI Conference on Human Factors in Computing Systems},
publisher = {ACM},
series = {CHI EA '24},
howpublished = {Extended Abstract},
year = {2024},
month = {May},
articleno = {462},
pages = {1-7},
doi = {https://doi.org/10.1145/3613905.3636316},
pdf = {papers/computationaluiworkshop24.pdf},
abstract = {Building on the success of the first two workshops on user interfaces (UIs) at CHI 2022 and CHI 2023, this workshop aims to advance the research field by further exploring current research trends, such as applying large language models and visual language models.
Previous work has explored computational approaches to understand and adapt UIs using constraint-based optimization models and machine learning-based data-driven approaches. In addition to further delving into these established UI research areas, we aim to trigger the exploration into the application of the latest advancements in general-purpose large language and vision-language models within the UI domain.
We will encourage participants to explore novel methods for understanding, automating, and evaluating UIs.
The proposed workshop seeks to bring together academic researchers and industry practitioners interested in computational approaches for UIs to discuss the needs and opportunities for future user interface algorithms, models, and applications.},
keywords = {GUI, layout, constraints},
}
@misc{kasahara2023crossingthroughput,
title = {Throughput and Effective Parameters in Crossing},
author = {Kasahara*, Nobuhito and Oba*, Yosuke and Yamanaka, Shota and Stuerzlinger, Wolfgang and Miyashita, Homei},
booktitle = {Extended Abstracts of the CHI Conference on Human Factors in Computing Systems},
publisher = {ACM},
series = {CHI EA '23},
howpublished = {Extended Abstract},
year = {2023},
month = {Apr},
articleno = {282},
numpages = {9},
doi = {https://doi.org/10.1145/3544549.3585817},
pdf = {papers/crossingthroughput.pdf},
abstract = {In pointing, throughput TP is used as a performance metric for the input device and operator. Based on the calculation of effective parameters (width We and amplitude Ae), TP should be independent of the speed-accuracy tradeoff. To examine the validity of TP and effective parameters for crossing actions, we conducted two experiments using two established crossing tasks. Our results demonstrate that applying effective parameters to Fitts’ law model improves the fit to the data for mixed biases in both tasks. Besides, we observed that effective parameters smoothed TPs across biases. However, unlike pointing, TP was observed to be unstable across IDs in one task, while was stable across IDs in the other task. Analyzing speed profiles showed that this was likely due to the fact that one of the tasks could be completed with a ballistic movement at low IDs, whereas this was impossible for the other task.},
keywords = {throughput, crossing},
}
@misc{mutasim2023repeatedtyping,
title = {Does Repeatedly Typing the Same Phrase Provide a Good Estimate of Expert Text Entry Performance?},
author = {Mutasim*, Aunnoy K and Hudhud Mughrabi+, Moaaz and Batmaz, Anil Ufuk and Stuerzlinger, Wolfgang},
booktitle = {Extended Abstracts of the CHI Conference on Human Factors in Computing Systems},
publisher = {ACM},
series = {CHI EA '23},
howpublished = {Extended Abstract},
year = {2023},
month = {Apr},
articleno = {90},
numpages = {8},
doi = {https://doi.org/10.1145/3544549.3585647},
pdf = {papers/repeatedtyping.pdf},
abstract = {To identify if novel/unfamiliar keyboard layouts like OPTI can outperform QWERTY, lengthy training through longitudinal studies is typically required. To reduce this logistical bottleneck, a popular approach in the literature requires participants to type the same phrase repeatedly. However, it is still unknown whether this approach provides a good estimate of expert performance. To validate this method, we set up a study where participants were tasked with typing the same phrase 96 times for both OPTI and QWERTY. Results showed that this approach has the potential to estimate expert performance for novel/unfamiliar keyboards faster than the traditional approach with different phrases. Yet, we also found that accurate estimates still require training over several days and, therefore, do not eliminate the need for a longitudinal study. Our findings thus show the need for research on faster, easier, and more reliable empirical approaches to evaluate text entry systems.},
keywords = {text entry, touch typing},
}
@misc{hayatpur2023personalspaces,
title = {Designing Collaborative Parsons Problems with Personal-Spaces},
author = {Hayatpur*, Devamardeep and Helfenbaum*, Tehilla and Xia, Haijun and Stuerzlinger, Wolfgang and Gries, Paul},
booktitle = {Extended Abstracts of the CHI Conference on Human Factors in Computing Systems},
publisher = {ACM},
series = {CHI EA '23},
howpublished = {Extended Abstract},
year = {2023},
month = {Apr},
articleno = {263},
numpages = {7},
doi = {https://doi.org/10.1145/3544549.3585630},
pdf = {papers/personalspaces.pdf},
video = {videos/personalspaces.mp4},
teaser = {teasers/personalspaces.png},
abstract = {Pair programming has proven to be a successful pedagogical technique. However, its effectiveness depends on the frequency and quality of communication of the driver. In this work, we explore an alternative collaboration paradigm that tackles the imbalance in pair programming through Parsons problems: students are given fragments of code out of order and tasked with re-organizing them into the correct order. We then create an interdependence between students by assigning each learner to a different sub-problem in their space, termed Personal-spaces. Students must engage in dialog to negotiate, exchange, and use fragments from the same pool. In an exploratory study with nine pairs of undergraduate students, we find evidence pointing to affordances of different coordination conditions: Personal-spaces promoted ownership and engagement, while Turn taking (akin to pair programming) helped maintain a consistent train of thought. We provide guidelines for design of appropriate problem sets and collaboration tools to structure conversations.},
keywords = {pair programming, parsons problems, programming education},
}
@misc{jiang2023futureuiworkshop,
title = {The Future of Computational Approaches for Understanding and Adapting User Interfaces},
author = {Jiang*, Yue and Lu*, Yuwen and Lutteroth, Christof and Li, Toby Jia-Jun and Nichols, Jeffery and Stuerzlinger, Wolfgang},
booktitle = {Extended Abstracts of the CHI Conference on Human Factors in Computing Systems},
publisher = {ACM},
series = {CHI EA '23},
howpublished = {Extended Abstract},
year = {2023},
month = {Apr},
articleno = {367},
numpages = {5},
doi = {https://doi.org/10.1145/3544549.3573805},
pdf = {papers/futureuiworkshop.pdf},
abstract = {Building on the success of the first workshop on understanding, generating, and adapting user interfaces at CHI2022, this workshop will advance this research area further by looking at existing results and exploring new research directions. Computational approaches for user interfaces have been used in adapting interfaces for different devices, modalities, and user preferences. Recent work has made significant progress in understanding and adapting user interfaces with traditional constraint/rule-based optimization and machine learning-based data-driven approaches; however, these two approaches remain separate. Combining the two approaches has great potential to advance the area but remains under-explored and challenging. Other contributions, such as datasets for potential applications, novel representations of user interfaces, the analysis of human traces, and models with multi-modalities, will also open up future research options. The proposed workshop seeks to bring together researchers interested in computational approaches for user interfaces to discuss the needs and opportunities for future user interface algorithms, models, and applications.},
keywords = {GUI, layout, constraints},
}
@misc{hudhud23effectiveehct,
title = {On the Effectiveness of Virtual Eye-Hand Coordination Training with Head Mounted Displays},
author = {Hudhud Mughrabi+, Moaaz and Kaya+, Furkan and Batmaz, Anil Ufuk and Aliza*, Aliza and Stuerzlinger, Wolfgang and Borazan+, Baris and Tonyali+, Emir and Sarac, Mine},
booktitle = {Workshop on 3D Content Creation for Simulated Training in eXtended Reality, VR Adjunct Proceedings},
publisher = {IEEE},
series = {TrainingXR '23},
year = {2023},
month = {Mar},
numpages = {8},
doi = {https://doi.org/10.1109/VRW58643.2023.00014},
pdf = {papers/effectiveehct.pdf},
abstract = {Eye-hand coordination training systems are used to train participants' motor skills and visual perception. Such systems have already been tested in Virtual Reality, and the results revealed that Head Mounted Displays have the potential to improve the motor training. However, this was only investigated in an hour-long study. In the longitudinal study reported here, we analyzed the motor performance of three participants in ten sessions with three different assessment criteria, where participants were instructed to focus on speed, error rate, or complete the training freely (with no instructions). We also assessed the effective throughput performance of the participants. Our results indicate that participants focusing on speed might need less number of learning sessions. We hope that our results will help practitioners and developers design efficient Virtual Reality training systems.},
keywords = {3D pointing, gaze tracking, eye-hand coordination},
}
@misc{taylor2022litports,
title = {LitPorts: On-demand Illuminated Ports to Facilitate Inter-device Connections in Low-light Conditions},
author = {Taylor*, Tiffany E. and Stuerzlinger, Wolfgang},
booktitle = {Australian Conference on Human-Computer Interaction},
series = {OzCHI '22},
howpublished = {Late-Breaking Work},
year = {2022},
month = {Nov},
pages = {51-57},
doi = {https://doi.org/10.1145/3572921.3572932},
commented-url = {http://www.ozchi.org/2022/poster_lbw1027.html},
pdf = {papers/litports.pdf},
video = {videos/litports.mp4},
teaser = {teasers/litports.png},
abstract = {Plugging a cable or peripheral into a device is an integral aspect of daily use of computing devices for most users. Yet, in low-light or constrained-visibility conditions the simple act of finding the receptacle to connect the cable to can be challenging and lead to user frustration. To alleviate this frustration we present LitPorts, a technology that illuminates receptacles in low-light conditions when a compatible plug is in proximity, making plugging a cable in substantially easier leading to a better all-around user experience. We also present user feedback from our prototype testing demonstrating the broad appeal and applicability of LitPorts.},
keywords = {device connectivity, ports, receptacles, illumination},
}
@misc{rajabiseraji2022xvcollab,
title = {XVCollab: An Immersive Analytics Tool for Asymmetric Collaboration across the Virtuality Spectrum},
author = {Rajabi Seraji*, Mohammad and Stuerzlinger, Wolfgang},
booktitle = {Workshop on Visual Analytics in Immersive Environments, ISMAR Adjunct Proceedings},
series = {VAinIE '22},
year = {2022},
month = {Oct},
pages = {146-154},
doi = {https://doi.org/10.1109/ISMAR-Adjunct57072.2022.00035},
pdf = {papers/xvcollab.pdf},
teaser = {teasers/xvcollab.png},
abstract = {Research has shown that when a group of people collaborate in decision-making scenarios, they can be more effective than when they work alone. Studies also show that in a data analytics context, using immersive technologies could make users perform better in data understanding, pattern recognition, and finding connections. In this work, we are leveraging previous knowledge in Collaborative Immersive Analytics (CIA) and Cross-virtuality Analytics (XVA) to develop an asymmetric system that enables two groups from different places on the Virtuality-Reality spectrum to simultaneously work on analyzing data. We divide users into two groups: the non-immersive desktop group and the immersive AR group. These two groups can both author and modify visualizations in their virtuality and share it with the other group when they see fit. For this, we designed a non-interruptive interface for both groups to transform a visualization from non-immersive 2D to immersive AR and vice-versa. We also provide multiple awareness cues in the system that keep either group aware of the other and their actions. We designed these features to boost user performance and ease of use in a collaborative setting and incentivize them to rely on the other group for visualization tasks that are difficult to perform on their end of the virtuality spectrum. Our limited pilot study shows that users find the system engaging, easy to use, and helpful in their data-understanding journey within the collaborative context. Going forward, we plan to conduct more rigorous studies to verify our claims and explore other research questions on this topic.},
keywords = {immersive analytics, cross-reality, augmented reality, collaboration},
}
@misc{rajabiseraji2022hybridaxes,
title = {HybridAxes: An Immersive Analytics Tool With Interoperability Between 2D and Immersive Reality Modes},
author = {Rajabi Seraji*, Mohammad and Stuerzlinger, Wolfgang},
booktitle = {Workshop on Prototyping Cross-Reality Systems, ISMAR Adjunct Proceedings},
series = {PCRS '22},
year = {2022},
month = {Oct},
pages = {155-160},
doi = {https://doi.org/10.1109/ISMAR-Adjunct57072.2022.00036},
pdf = {papers/hybridaxes.pdf},
teaser = {teasers/hybridaxes.png},
abstract = {Throughout the visual analytics process, users create visualizations with different dimensionalities. Research shows that in this process users benefit from being able to simultaneously see 2D and 3D modes of their data visualizations. Towards supporting this potential need, we introduce HybridAxes, an immersive visual analytics tool that allows the users to conduct their analysis at either end of the reality spectrum - either in 2D on desktop monitors or 3D in an immersive AR/VR environment - while enabling them to seamlessly switch between the two modes. We believe that by using our system, users will find it easier and faster to understand and analyze multi-dimensional data. An initial pilot test indicates positive trends in terms of users' performance time and usability metrics compared to the standalone desktop or XR counterparts. Our preliminary results also suggest that users experience a lower cognitive load while task-switching between these reality modes. This reduction in mental effort causes them to perceive the system to be unobtrusive and pleasant to work with. Going forward, we plan to conduct more rigorous studies to verify our claims and to explore other research questions on this topic.},
keywords = {immersive analytics, cross-reality, augmented reality},
}
@misc{bao2022errorsspeechtranscription,
title = {The Effects of Errors in Speech Transcription: A User Study},
author = {Bao*, Tianyi Vera and Ahmed+, Afshan and Stuerzlinger, Wolfgang},
booktitle = {TEXT2030: Shaping Text Entry Research in 2030, Workshop at MobileHCI '22},
commented-publisher = {ACM},
series = {TEXT '22},
year = {2022},
month = {Oct},
numpages = {6},
pdf = {papers/respeak.pdf},
url = {http://text2030.textentry.org.uk/papers/6.pdf},
abstract = {This paper investigates how errors that occur during speech recognition affect users’ text entry performance. To study this, we implemented a speech recognition system that injects believable errors in a controlled manner. In our user study, participants were asked to transcribe a set of phrases using our speech recognition system, either with or without the insertion of errors. The results show that inducing 33% errors in a speech-based transcription task does not seem to affect users’ performance and experience in a significant manner. Yet, according to participants’ interview responses, our result might have been caused by the phrase set we used in the study. Our work thus motivates future research to develop a phrase set more suitable for speech-based transcription tasks.},
keywords = {text entry, speech recognition, errors},
}
@misc{kneifel2022autocorrectpersonality,
title = {Effects of Personality Type on Trust in Autocorrect and Preferences},
author = {Kneifel*, Johanna and Spaeth, Dominic and Stuerzlinger, Wolfgang},
booktitle = {TEXT2030: Shaping Text Entry Research in 2030, Workshop at MobileHCI '22},
commented-publisher = {ACM},
series = {TEXT '22},
year = {2022},
month = {Oct},
numpages = {6},
pdf = {papers/autocorrectpersonality.pdf},
url = {http://text2030.textentry.org.uk/papers/3.pdf},
abstract = {User acceptance of a given feature depends upon its perceived trustworthiness. Despite imperfections, trust seems to be evenly split for autocorrect. In this study, we use the Big Five personality test and text entry tasks to investigate the effect of users’ personality type on their trust in autocorrect when encountering autocorrect errors. Results indicate that individuals ranking higher in neuroticism distrust autocorrect more. Our qualitative observations showed frustrated behaviors for autocorrect errors during the text entry tasks. Half of our participants reporting distrust in autocorrect still had the feature on. The results lend insights into connections between personality type and preferred text-based communication methods, which needs to be investigated further in future work.},
keywords = {text entry, autocorrect, trust, personality, errors},
}
@misc{kneifel2022speechvstyping,
title = {Speech Recognition Versus Typing: A Mixed-Methods Evaluation},
author = {Kneifel*, Johanna and Alharbi, Ohoud and Stuerzlinger, Wolfgang},
booktitle = {TEXT2030: Shaping Text Entry Research in 2030, Workshop at MobileHCI '22},
commented-publisher = {ACM},
series = {TEXT '22},
year = {2022},
month = {Oct},
numpages = {7},
pdf = {papers/speechvstyping.pdf},
url = {http://text2030.textentry.org.uk/papers/4.pdf},
abstract = {Mobile text entry has become a main mode of communication. To make text entry as efficient as possible, helpful features, such as autocorrect and speech recognition have been developed. In our study, we confirmed previous work in that speech recognition was faster, while the error rate for typing was lower. To analyze this in more depth, we performed semi-structured interviews about participants’ text-entry preferences, specific pain points that occur, and potential suggestions for improving the editing experience.},
keywords = {text entry, speech recognition, errors},
}
@misc{lee2022multiscalenavposter,
title = {A Comparison of Zoom-In Transition Methods for Multiscale VR},
author = {Lee*, Jong-In and Asente, Paul and Stuerzlinger, Wolfgang},
booktitle = {SIGGRAPH 2022 Posters},
publisher = {ACM},
series = {SIGGRAPH '22},
howpublished = {Poster},
year = {2022},
month = {Aug},
articleno = {22},
numpages = {2},
doi = {https://doi.org/10.1145/3532719.3543237},
pdf = {papers/zoomintransition.pdf},
abstract = {When navigating within an unfamiliar virtual environment in virtual reality, transitions between pre-defined viewpoints are known to facilitate spatial awareness of a user. In the past, different viewpoint transition techniques had been investigated in VR 3D UI research, but mainly for single-scale environments. We present a comparative study of zoom-in transition techniques, where the viewpoint of a user is being smoothly transitioned from a large level of scale (LoS) to a smaller LoS in a multiscale virtual environment (MVE) with a nested structure. We identify that orbiting first before zooming in is preferred over other alternatives when transitioning to a viewpoint at a small LoS.},
keywords = {3D navigation, multiscale virtual environment, viewpoint transition},
}
@misc{kaya2022depthrole,
title = {The Role of the Depth Dimension in 3D Visualizations for Dense Data Understanding},
author = {Kaya+, Furkan and Batmaz, Anil Ufuk and Mutasim*, Aunnoy K and Stuerzlinger, Wolfgang},
booktitle = {European Conference on Visual Perception},
commented-publisher = {Sage},
series = {ECVP '22},
howpublished = {Abstract},
year = {2022},
month = {Aug},
pages = {183-184},
doi = {https://doi.org/10.1177/03010066221141167},
abstract = {Visual attributes, such as size, shape, or colour, play a crucial role in the interpretation of data visualizations and can be used to represent the data at different scales. On 2D displays, human viewers then perceive the differences between scales based on such visual attributes. While it can be challenging for human to interpret data in dense visualizations in 2D, the additional depth dimension offered by 3D could make some aspects of data more visible.
To analyze the potential impact of depth perception on dense data visualization, we developed a novel visualization method and visualized dense COVID-19 time-series data of four European countries (France, Germany, United Kingdom, and Turkey). In our novel visualization, we aimed to increase the visibility of individual data points to ease visual perception and visualized daily total cases in the depth dimension.
We conducted a user study with 20 participants where we compared a conventional 2D visualization with the proposed novel 3D visualization method for COVID-19 data.
The results show that the novel 3D visualization method facilitated understanding of the complexity of COVID-19 case data and decreased misinterpretations by 40%. Overall, 13 out of 20 participants preferred to see the COVID-19 data with the proposed method. Participants’ comments on the novel visualization method revealed that the increased visibility of individual data points decreases the cognitive load of the participants, which might explain the outcome.
The results of our work identify that the depth dimension offered by 3D visualizations can assist users in understanding dense data.},
keywords = {3D visualization, perception},
}
@misc{dunlop2022textworkshop,
title = {TEXT2030 - Shaping Text Entry Research in 2030},
author = {Dunlop, Mark and Stuerzlinger, Wolfgang and Arif, Ahmed Sabbir and Alharbi, Ohoud and Komninos, Andreas},
booktitle = {International Conference on Human-Computer Interaction with Mobile Devices and Services},
publisher = {ACM},
series = {MobileHCI '22},
howpublished = {Workshop Abstract},
year = {2022},
month = {Sep},
articleno = {3},
numpages = {4},
doi = {https://doi.org/10.1145/3528575.3551429},
pdf = {papers/text2030ws.pdf},
url = {http://text2030.textentry.org.uk},
abstract = {We propose a workshop on the theme of ubiquitous text entry research. Our aim is to address the methodological challenges arising from several decades of experience in this research community. We hope to solicit views, experiences and ideas from researchers across a range of backgrounds, with a view to formulate concrete action plans to move community practices into a strengthened position by 2030.},
keywords = {text entry, methodological challenges},
}
@misc{jiang2022computationaluiworkshop,
title = {Computational Approaches for Understanding, Generating, and Adapting User Interfaces},
author = {Jiang*, Yue and Lu*, Yuwen and Nichols, Jeffery and Stuerzlinger, Wolfgang and Yu, Chun and Lutteroth, Christof and Li, Yang and Kumar, Ranjitha and Li, Toby Jia-Jun},
booktitle = {Extended Abstracts of the CHI Conference on Human Factors in Computing Systems},
publisher = {ACM},
series = {CHI EA '22},
howpublished = {Extended Abstract},
year = {2022},
month = {May},
articleno = {74},
numpages = {6},
doi = {https://doi.org/10.1145/3491101.3504030},
pdf = {papers/computationaluiworkshop.pdf},
abstract = {Computational approaches for user interfaces have been used in adapting interfaces for different modalities, usage scenarios and device form factors, understanding screen semantics for accessibility, task-automation, information extraction, and in assisting interface design. Recent advances in machine learning (ML) have drawn considerable attention across HCI and related fields such as computer vision and natural language processing, leading to new ML-based user interface approaches. Similarly, significant progress has been made with more traditional optimization- and planning-based approaches to accommodate the need for adapting UIs for screens with different sizes, orientations and aspect ratios, and in emerging domains such as VR/AR and 3D interfaces. The proposed workshop seeks to bring together researchers interested in all kinds of computational approaches for user interfaces across different sectors as a community, including those who develop algorithms and models and those who build applications, to discuss common issues including the need for resources, opportunities for new applications, design implications for human-AI interaction in this domain, and practical challenges such as user privacy.},
keywords = {GUI, layout, constraints},
}
@misc{batmaz2021year1covid,
title = {Researchers’ and Participants’ Experiences on Distributed User Studies Conducted in the First Year of COVID-19 Pandemic},
author = {Batmaz, Anil Ufuk and Mifsud*, Domenick and Steed, Anthony and Stuerzlinger, Wolfgang and Ortega, Francisco},
booktitle = {First XR Remote Research Workshop at CHI '21},
year = {2021},
month = {May},
numpages = {3},
pdf = {papers/covidyear1ws.pdf},
url = {http://www.mat.qmul.ac.uk/xr-chi-2021},
abstract = {COVID-19 has raised significant challenges to the conduct of Virtual Reality (VR) and Augmented Reality (AR) studies. Previously, most VR and AR academic research happened in research labs at universities, where the experiments were conducted in controlled environments with specific installations and instrumentation. With the ongoing pandemic, many VR/AR researchers switched by necessity to distributed studies, where the participants participate in the studies from their own living or working spaces. This change created novel challenges for participants and experimenters. In this paper, we report some experiences with VR/AR studies conducted in the first year of COVID-19 and present recommendations for future, distributed VR/AR studies.},
keywords = {3D user interfaces, COVID-19, extended reality, virtual reality, augmented reality},
}
@misc{malekmakan2020analyzing,
title = {Analyzing the Trade-off between Selection and Navigation in VR},
author = {Malekmakan*, Morteza and Stuerzlinger, Wolfgang and Riecke, Bernhard},
booktitle = {26th Symposium on Virtual Reality Software and Technology},
publisher = {ACM},
series = {VRST '20},
howpublished = {Poster},
year = {2020},
month = {Nov},
articleno = {42},
numpages = {3},
doi = {https://doi.org/10.1145/3385956.3422123},
pdf = {papers/navseltradeoffposter.pdf},
video = {https://www.youtube.com/watch?v=8w53gKhPjWs},
abstract = {Navigation and selection are critical in very large virtual environments, such as a model of a whole city. In practice, many VR applications require both of these modalities to work together. We compare different combinations of two navigation and two selection methods in VR on selection tasks involving distant targets in a user study. The aim of our work is to discover the trade-off between navigation and selection techniques and to identify which combination leads to better interaction performance in large virtual environments. The results showed that users could complete the task faster with the fly/drive method and traveled less, compared to the teleportation method. Additionally, raycasting exhibited a better performance in terms of time and (less) distance traveled, however, it significantly increased the error rate for the selection of targets.},
keywords = {3D pointing, 3D navigation},
}
@misc{wagner2020designing,
title = {Designing Efficient Immersive Analytics Environments for Spatio-Temporal Data},
author = {Wagner Filho*, Jorge and Stuerzlinger, Wolfgang and Nedel, Luciana},
booktitle = {SIBGRAPI Workshop on Visual Analytics, Information Visualization and Scientific Visualization},
series = {WVIS '20},
howpublished = {Abstract},
year = {2020},
month = {Oct},
numpages = {1},
abstract = {The ever-growing amount of human movement data challenges us to develop new visualization techniques and to revisit existing ones with different perspectives. Traditional 2D movement visualizations focus either on the spatial or temporal aspects of the data, potentially hindering the observation of relevant features. Emerging Immersive Analytics approaches offer the opportunity to revisit a three-dimensional visualization that allows the integrated analysis of both. With the aid of stereoscopic virtual reality and 3D user interfaces, an immersive Space-Time Cube might overcome challenges that limited its adoption in the past. In this talk, we will present an overview of our ongoing research on this immersive representation, preliminary insights obtained with different navigation and interaction approaches, and our next planned steps.},
keywords = {visual analytics, immersive analytics, space-time cube, 3D visualization},
}
@misc{wagner2020visualizing,
title = {Visualizing Movement Trajectories in an Immersive Space Time-Cube},
author = {Wagner Filho*, Jorge and Stuerzlinger, Wolfgang and Nedel, Luciana},
booktitle = {VIS 2020 Workshop on Information Visualization of Geospatial Networks, Flows and Movement},
publisher = {IEEE},
series = {MoVis '20},
howpublished = {Extended Abstract},
year = {2020},
month = {Oct},
numpages = {3},
abstract = {The ever-growing amount of human movement data challenges us to develop new visualization techniques and to revisit existing ones with different perspectives. Traditional 2D movement visualizations focus either on the spatial or temporal aspects of the data, potentially hindering the observation of relevant features. Emerging Immersive Analytics approaches offer the opportunity to revisit a three-dimensional visualization that allows the integrated analysis of both. With the aid of stereoscopic virtual reality and 3D user interfaces, an immersive Space-Time Cube might overcome challenges that limited its adoption in the past. In this paper, we provide an overview of the results obtained in our ongoing research on this immersive representation. We also discuss insights obtained with different navigation and interaction approaches, and our next planned steps.},
keywords = {visual analytics, immersive analytics, space-time cube, 3D visualization},
}
@comment{c, c={currently commented out. If the corresponding journal article goes converts to misc, I might put this back in}}
@comment{steed2020covidblog,
author = {Steed, Anthony and Ortega, Francisco and Williams, Adam and Kruijff, Ernst and Stuerzlinger, Wolfgang and Batmaz, Anil Ufuk and Won, Andrea and Suma Rosenberg, Evan and Simeone, Adalberto and Hayes, Aleshia},
title = {Evaluating Immersive Experiences During COVID-19 and Beyond},
booktitle = {Interactions Blog},
month = {May},
year = {2020},
url = {http://interactions.acm.org/blog/view/enlightenment-by-lesson-},
howpublished = {Blog entry},
keywords = {3D user interfaces},
}
@misc{batmaz2020effect,
title = {Effect of Fixed and Infinite Ray Length on Distal {3D} Pointing in Virtual Reality},
author = {Batmaz, Anil Ufuk and Stuerzlinger, Wolfgang},
booktitle = {Extended Abstracts of the CHI Conference on Human Factors in Computing Systems},
publisher = {ACM},
series = {CHI EA '20},
howpublished = {Extended Abstract},
year = {2020},
month = {Apr},
numpages = {10},
doi = {https://doi.org/10.1145/3334480.3382796},
pdf = {papers/raylength.pdf},
abstract = {Ray casting is frequently used to point and select distant targets in Virtual Reality (VR) systems. In this work, we evaluate user performance in 3D pointing with two different ray casting versions: infinite ray casting, where the cursor is positioned on the surface of the first object along the ray that said ray points at, and finite ray-casting, where the cursor is attached to the ray at a fixed distance from the controller. Twelve subjects performed a Fitts' law experiment where the targets were placed 1, 2, or 3 meters away from the user. According to the results, subjects were faster and made fewer errors with the infinite ray length. Interestingly, their (effective) pointing throughput was higher when the ray length was constrained. We illustrate the advantages of both methods in immersive VR applications and provide information for practitioners and developers to choose the most appropriate ray-casting-based selection method for VR.},
keywords = {3D pointing, mid-air},
}
@misc{mutazim2020gaze,
title = {Gaze Tracking for Eye-Hand Coordination Training Systems in Virtual Reality},
author = {Mutasim*, Aunnoy K. and Stuerzlinger, Wolfgang and Batmaz, Anil Ufuk},
booktitle = {Extended Abstracts of the CHI Conference on Human Factors in Computing Systems},
publisher = {ACM},
series = {CHI EA '20},
howpublished = {Extended Abstract},
year = {2020},
month = {Apr},
numpages = {9},
doi = {https://doi.org/10.1145/3334480.3382924},
pdf = {papers/gazesportstrain.pdf},
abstract = {Eye-hand coordination training systems are used to improve user performance during fast movements in sports training. In this work, we explored gaze tracking in a Virtual Reality (VR) sports training system with a VR headset. Twelve subjects performed a pointing study with or without passive haptic feedback. Results showed that subjects spent an average of 0.55 s to visually find and another 0.25 s before their finger selected a target. We also identified that, passive haptic feedback did not increase the performance of the user. Moreover, gaze tracker accuracy significantly deteriorated when subjects looked below their eye level. Our results also point out that practitioners/trainers should focus on reducing the time spent on searching for the next target to improve their performance through VR eye-hand coordination training systems. We believe that current VR eye-hand coordination training systems are ready to be evaluated with athletes.},
keywords = {3D pointing, gaze tracking, eye-hand coordination},
}
@misc{murad2019,
title = {Effects of WER on ASR Correction Interfaces for Mobile Text Entry},
author = {Murad*, Christine and Munteanu, Cosmin and Stuerzlinger, Wolfgang},
booktitle = {International Conference on Human-Computer Interaction with Mobile Devices and Services},
publisher = {ACM},
series = {MobileHCI '19},
howpublished = {Poster},
year = {2019},
month = {Oct},
articleno = {56},
numpages = {6},
doi = {https://doi.org/10.1145/3338286.3344404},
pdf = {papers/speecheffect.pdf},
abstract = {Speech is increasingly being used as a method for text entry, especially on commercial mobile devices such as smartphones. While automatic speech recognition has seen great advances, factors like acoustic noise, differences in language or accents can affect the accuracy of speech dictation for mobile text entry. There has been some research on interfaces that enable users to intervene in the process, by correcting speech recognition errors. However, there is currently little research that investigates the effect of Automatic Speech Recognition (ASR) metrics, such as word error rate, on human performance and usability of speech recognition correction interfaces for mobile devices. This research explores how word error rates affect the usability and usefulness of touch-based speech recognition correction interfaces in the context of mobile device text entry.},
keywords = {speech recognition, text entry, errors},
}
@misc{batmaz2019effect,
title = {The Effect of Rotational Jitter on {3D} Pointing Tasks},
author = {Batmaz, Anil Ufuk and Stuerzlinger, Wolfgang},
booktitle = {Extended Abstracts of the CHI Conference on Human Factors in Computing Systems},
publisher = {ACM},
series = {CHI EA '19},
howpublished = {Extended Abstract},
year = {2019},
month = {May},
articleno = {LBW2112},
numpages = {6},
doi = {https://doi.org/10.1145/3290607.3312752},
pdf = {papers/rotjitterpointing.pdf},
abstract = {Even when in a static position, data acquired from 6 Degrees of Freedom (DoF) trackers is affected by noise, which is typically called jitter. In this study, we analyzed the effects of 3D rotational jitter on Virtual Reality (VR) controllers in a 3D Fitts' law experiment, which explored how such jitter affects user performance. Eight subjects performed a Fitts' law experiment with or without additional jitter on the cursor. Results show that while error rate significantly increased above ±0.5° jitter and subjects' effective throughput started to decrease significantly above ±1° jitter, there was no significant effect on users' movement time. Further, the Fitts's law movement time model was affected when ±2° jitter was applied to the tracker. According to these results, ±0.5° jitter on the controller does not significantly affect user performance for the tasks explored here. The results of our study can guide the design of 3D controller and tracking systems for 3D user interfaces.},
keywords = {3D pointing, jitter},
}
@misc{mutasim2019detection,
title = {Detection of Error Potentials using the Muse Headband},
author = {Mutasim*, Aunnoy K. and Stuerzlinger, Wolfgang},
booktitle = {EMBS Conference On Neural Engineering},
publisher = {IEEE},
series = {NER '19},
howpublished = {Poster},
year = {2019},
month = {Mar},
articleno = {FrPO.120},
numpages = {1},
abstract = {The detection of Error Potentials (ErrPs) has found promising applications in both neurophysiological and brain-computer interface (BCI) domains. However, the EEG acquisition devices used in such studies are mostly medical-grade and therefore expensive. Here, we propose to detect ErrPs using the cost-effective Muse headband.},
keywords = {EEG, errors},
}
@misc{nguyenvo2018actual,
title = {Do We Need Actual Walking in VR? Leaning with Actual Rotation Might Suffice for Efficient Locomotion},
author = {Nguyen-Vo*, Thinh and Pham*, Duc-Minh and Riecke, Bernhard E. and Stuerzlinger, Wolfgang and Kruijff, Ernst},
booktitle = {Spatial Cognition},
series = {SC '18},
howpublished = {Poster},
year = {2018},
month = {Sep},
abstract = {Walking has always been the most common locomotion mode for humans in the real world. For this reason, walking has also been considered as the ideal condition in a large body of VR research involving navigation. Physical walking provides body-based sensory information about both the translational and rotational components of locomotion. Though the rotational body-based information has been shown to be important for several spatial tasks, the benefit of the translational component is still unclear with mixed results from previous studies. In this study, we aim to investigate how much translational body-based sensory information is required for people to efficiently navigate the virtual world, given full rotational information. Depending on the locomotion interface used, more or less translational body-based information might be provided at different levels of accuracy. The current mixed method study investigated how different levels of translational body-based information might influence the performance of participants in a navigational search task in a HMD-based virtual environment. Participants were asked to find eight balls hidden in 16 target boxes randomly positioned in a two-meter radius circular area. To check whether there is a ball inside a target box, participants must stand right in front of the box within 0.80 meter and look at it. If there is a ball, they can collect it by touching the ball with a wand controller. The environment has been designed not to provide any additional orientation cue other than the optic flow from the fireflies. Participants could not see targets farther than two meter from them. In other words, they were not able to see all targets at a time, hence, they had to build up their spatial awareness gradually along with their locomotion. In this within-subject experiment, there were four levels of translational body-based information: none (participants used the trackpad of an HTC Vive wand controller to visually translate), upper-body leaning (participants sitting on a Swopper chair, used their upper-body leaning to control their visual translation), whole-body leaning (participants standing on a platform called NaviBoard, used their whole body leaning or stepping to navigate the virtual environment), and actual walking (participants physically walk with a wireless HMD on). Every participant performed a navigational search task once in every condition in a counter-balance order. All 24 participants finished all four trials (even with more or less fatigue). Results showed that locomotion mode had significant effects on various measures including task performance, task load, and simulator sickness. While participants performed significantly worse when they used joystick-based interface with no body-based information, compared to the other conditions, there was no significant difference between leaning-based interfaces and actual walking. More data in other measures are still in need for a more concrete conclusion. However, current results also suggested that body-based information from a leaning-based interface might suffice for a cost-effective alternative to actual walking in spatial cognition research and applications in VR.},
keywords = {3D navigation},
}
@misc{zaman2018gemniplus,
title = {{GEM-NI}+: Leveraging Difference Visualization and Multiple Displays for Supporting Multiple Complex Generative Design Alternatives},
author = {Zaman, Loutfouz and Neugebauer+, Christian and Stuerzlinger, Wolfgang and Woodbury, Robert},
booktitle = {Extended Abstracts of the CHI Conference on Human Factors in Computing Systems},
publisher = {ACM},
series = {CHI EA '18},
howpublished = {Extended Abstract},
year = {2018},
month = {Apr},
articleno = {LBW106},
numpages = {6},
doi = {https://doi.org/10.1145/3170427.3188593},
pdf = {papers/gem-ni+.pdf},
abstract = {In the conceptual design phase, designers routinely generate dozens of alternatives based on a single idea. This is especially relevant in generative design where an algorithm can generate a large number of viable design options. While solutions for creating and managing a small number of simple alternatives have been proposed, practical applications of these solutions are liMassachusetts Institute of Technologyed. As a result, we present GEM-NI+, an extension to the original GEM-NI system for creating and managing alternatives in generative design. GEM-NI+ is designed to enable editing, managing and comparing up to 24 alternatives simultaneously using a multi-monitor setup. GEM-NI+ also features a new "jamming spaces" technique for assigning individual monitors into different visualization states, which makes organization of a large workspace easier. Finally, GEM-NI+ enables comparison of complex alternatives using recursive group node difference visualization.},
keywords = {alternatives, design},
}
@misc{machuca2018stereo,
title = {Do Stereo Display Deficiencies Affect {3D} Pointing?},
author = {Barrera Machuca*, Mayra D. and Stuerzlinger, Wolfgang},
booktitle = {Extended Abstracts of the CHI Conference on Human Factors in Computing Systems},
publisher = {ACM},
series = {CHI EA '18},
howpublished = {Extended Abstract},
year = {2018},
month = {Apr},
articleno = {LBW126},
numpages = {6},
doi = {https://doi.org/10.1145/3170427.3188540},
abstract = {Previous work has documented that limitations of current stereo display systems affect depth perception. We performed an experiment to understand if such stereo display deficiencies affect 3D pointing for targets in front of a screen and close to the user, i.e., in peri-personal space. Our experiment compares isolated movements with and without a change in visual depth for virtual targets. Results indicate that selecting targets along the depth axis is slower and has less throughput than laterally positioned targets.},
keywords = {3D pointing, mid-air, stereo},
}
@misc{hashemian2018investigating,
title = {Investigating a Sparse Peripheral Display in a Head-Mounted Display for VR Locomotion},
author = {Hashemian*, Abraham and Kitson*, Alexandra and Nguyen-Vo*, Thinh and Benko, Hrvoje and Stuerzlinger, Wolfgang and Riecke, Bernhard E.},
booktitle = {Conference on Virtual Reality and {3D} User Interfaces},
publisher = {IEEE},
series = {VR '18},
howpublished = {Poster},
year = {2018},
month = {Mar},
pages = {571-572},
doi = {https://doi.org/10.1109/VR.2018.8446345},
abstract = {Head-Mounted Displays (HMDs) provide immersive experiences for virtual reality. However, their field of view (FOV) is still relatively small compared to the human eye, which adding sparse peripheral displays (SPDs) could address. We designed a new SPD, SparseLightVR2, which increases the HMD's FOV to 180° horizontally. We evaluated SparseLightVR2 with a study (N=29) by comparing three conditions: 1) no SPD, where the peripheral display (PD) was inactive; 2) extended SPD, where the PD provided visual cues consistent with and extending the HMD's main screen; and 3) counter-vection SPD, where the PD's visuals were flipped horizontally during VR travel to provide optic flow in the opposite direction of the travel. The participants experienced passive motion on a linear path and reported introspective measures such as sensation of self-motion. Results showed, compared to no SPD, both extended and counter-vection SPDs provided a more natural experience of motion, while extended SPD also enhanced vection intensity and believability of movement. Yet, visually induced motion sickness (VIMS) was not affected by display condition. To investigate the reason behind these non-significant results, we conducted a follow-up study and had users increase peripheral counter-vection visuals on the central HMD screen until they nulled out vection. Our results suggest extending HMDs through SPDs enhanced vection, naturalness, and believability of movement without enhancing VIMS, but reversed SPD motion cues might not be strong enough to reduce vection and VIMS.},
keywords = {3D navigation},
}
@misc{sun2018selecting,
title = {Selecting Invisible Objects},
author = {Sun*, Junwei and Stuerzlinger, Wolfgang},
booktitle = {Conference on Virtual Reality and {3D} User Interfaces},
publisher = {IEEE},
series = {VR '18},
howpublished = {Poster},
year = {2018},
month = {Mar},
pages = {697-698},
doi = {https://doi.org/10.1109/VR.2018.8446199},
abstract = {We augment 3D user interfaces with a new technique that enables users to select objects that are invisible from the current viewpoint. We present a layer-based method for selecting invisible objects, which works for arbitrary objects and scenes. The user study shows that with our new techniques users can easily select hidden objects.},
keywords = {3D positioning, transparency},
}
@misc{machuca2017multiplanes,
title = {Multiplanes: Assisted Freehand VR Drawing},
author = {Barrera Machuca*, Mayra D. and Asente, Paul and Lu*, Jingwan and Kim, Byungmoon and Stuerzlinger, Wolfgang},
booktitle = {Adjunct Publication of the 30th Annual ACM Symposium on User Interface Software and Technology},
publisher = {ACM},
series = {UIST '17},
howpublished = {Demonstration},
year = {2017},
month = {Oct},
pages = {1-3},
doi = {https://doi.org/10.1145/3131785.3131794},
abstract = {Multiplanes is a virtual reality (VR) drawing system that provides users with the flexibility of freehand drawing and the ability to draw perfect shapes. Through the combination of both beautified and 2D drawing, Multiplanes addresses challenges in creating 3D VR drawings. To achieve this, the system beautifies user's strokes based on the most probable, intended shapes while the user is drawing them. It also automatically generates snapping planes and beautification trigger points based on previous and current strokes and the current controller pose. Based on geometrical relationships to previous strokes, beautification trigger points act as guides inside the virtual environment. Users can hit these points to (explicitly) trigger a stroke beautification. In contrast to other systems, when using Multiplanes, users do not need to manually set or do any kind of special gesture to activate, such guides allowing the user to focus on the creative process.},
keywords = {3D sketching, 3D drawing, 3D modeling, 3D user interfaces},
}
@misc{machuca2018fluidvr,
title = {Fluid VR: Extended Object Associations for Automatic Mode Switching in Virtual Reality},
author = {Barrera Machuca*, Mayra D. and Sun*, Junwei and Pham*, Duc-Minh and Stuerzlinger, Wolfgang},
booktitle = {Conference on Virtual Reality and {3D} User Interfaces},
publisher = {IEEE},
series = {3DUI '18},
howpublished = {3DUI contest entry},
year = {2018},
month = {Mar},
pages = {846-847},
doi = {https://doi.org/10.1109/VR.2018.8446437},
abstract = {Constrained interaction and navigation methods for virtual reality reduce the complexity of the interaction. Yet, with previously presented solutions, users need to learn new interaction tools or remember different actions for changing between different interaction methods. In this paper, we propose Fluid VR, a new 3D user interface for interactive virtual environments that lets users seamlessly transition between navigation and selection. Based on the selected object's properties, Fluid VR applies specific constraints to the interaction or navigation associated with the object. This way users have a better control of their actions, without having to change tools or activate different modes of interaction.},
keywords = {3D manipulation},
}
@misc{nguyenvo2017investigating,
title = {Investigating the Effect of Simulated Reference Frames on Spatial Orientation in Virtual Reality},
author = {Nguyen-Vo*, Thinh and Riecke, Bernhard E. and Stuerzlinger, Wolfgang},
booktitle = {Second Workshop on Models and Representations in Spatial Cognition},
series = {SC '17},
howpublished = {Poster},
year = {2017},
month = {Apr},
url = {https://osf.io/bs5ug},
abstract = {Despite recent advances in virtual reality, locomotion in a virtual environment is still restricted because of spatial disorientation. Previous research has shown the benefits of reference frames in maintaining spatial orientation. Here, we propose using a visually simulated reference frame in virtual reality to provide users with a better sense of direction in landmark-free virtual environments. Visually overlaid rectangular frames simulate different variations of frames of reference. We investigated how two different types of visually simulated reference frames might benefit in a navigational search task through a mixed-method study. Results showed that the presence of a reference frame significantly affects participants' performance in a navigational search task. Though the egocentric frame of reference (simulated CAVE) that translates with the observer did not significantly help, an allocentric frame of reference (a simulated stationary room) significantly improved user performance both in navigational search time and overall travel distance. Our study suggests that adding a variation of the reference frame to virtual reality applications might be a cost-effective solution to enable more effective locomotion in virtual reality.},
keywords = {cave, 3D navigation},
}
@misc{nguyenvo2017moving,
title = {Moving in a Box: Improving Spatial Orientation in Virtual Reality using Simulated Reference Frames},
author = {Nguyen-Vo*, Thinh and Riecke, Bernhard E. and Stuerzlinger, Wolfgang},
booktitle = {Symposium on {3D} User Interfaces},
publisher = {IEEE},
series = {3DUI '17},
howpublished = {Poster},
year = {2017},
month = {Mar},
pages = {846-847},
doi = {https://doi.org/10.1109/3DUI.2017.7893344},
abstract = {Despite recent advances in virtual reality, locomotion in a virtual environment is still restricted because of spatial disorientation. Previous research has shown the benefits of reference frames in maintaining spatial orientation. Here, we propose using a visually simulated reference frame in virtual reality to provide users with a better sense of direction in landmark-free virtual environments. Visually overlaid rectangular frames simulate different variations of frames of reference. We investigated how two different types of visually simulated reference frames might benefit in a navigational search task through a mixed-method study. Results showed that the presence of a reference frame significantly affects participants' performance in a navigational search task. Though the egocentric frame of reference (simulated CAVE) that translates with the observer did not significantly help, an allocentric frame of reference (a simulated stationary room) significantly improved user performance both in navigational search time and overall travel distance. Our study suggests that adding a variation of the reference frame to virtual reality applications might be a cost-effective solution to enable more effective locomotion in virtual reality.},
keywords = {cave, 3D navigation},
}
@misc{teather2016tutorial,
title = {SIVARG: Spatial Interaction in Virtual/Augmented Reality and Games},
author = {Teather, Robert and Stuerzlinger, Wolfgang},
booktitle = {International Conference on Interactive Surfaces and Spaces},
publisher = {ACM},
series = {ISS '16},
howpublished = {Tutorial},
year = {2016},
month = {Nov},
pages = {525–528},
doi = {https://doi.org/10.1145/2992154.2996364},
abstract = {We propose a workshop soliciting submissions on the topics of spatial and 3D interaction in highly fidelity graphical interactive systems, especially video games and virtual reality systems. Topics will cover all aspects of interaction in these systems, including input-related issues such as efficient control mappings, spatial input device features (e.g., low latency, input noise, etc.), as well as output-related issues such as display hardware features (e.g., stereoscopic rendering, head-tracking), and information visualization (e.g., game HUDs for status information). We propose to include both position papers, as well as papers including at least preliminary studies on issues in these areas.},
keywords = {3D user interface},
}
@misc{sun2016shiftsliding,
title = {{Shift-Sliding} and {Depth-Pop} for {3D} Positioning},
author = {Sun*, Junwei and Stuerzlinger, Wolfgang and Shuralyov*, Dmitri},
booktitle = {Symposium on Spatial User Interaction},
publisher = {ACM},
series = {SUI '16},
howpublished = {Demonstration},
year = {2016},
month = {Oct},
pages = {165-165},
doi = {https://doi.org/10.1145/2983310.2991067},
abstract = {We introduce two new 3D positioning methods. The techniques enable rapid, yet easy-to-use positioning of objects in 3D scenes. With SHIFT-Sliding, the user can override the default assumption of contact and non-collision for sliding, and lift objects into the air or make them collide with other objects. DEPTH-POP maps mouse wheel actions to all object positions along the mouse ray, where the object meets the default assumptions for sliding. We will demonstrate the two methods in a desktop environment with the mouse and keyboard as interaction devices. Both methods use frame buffer techniques for efficiency.},
keywords = {3D manipulation, 3D positioning},
}
@misc{machuca2016history,
title = {{3D} Camera Pose History Visualization},
author = {Barrera Machuca*, Mayra D. and Stuerzlinger, Wolfgang},
booktitle = {Symposium on Spatial User Interaction},
publisher = {ACM},
series = {SUI '16},
howpublished = {Poster},
year = {2016},
month = {Oct},
pages = {183-183},
doi = {https://doi.org/10.1145/2983310.2989185},
abstract = {We present a 3D camera pose history visualization that can assist users of CAD software's, virtual worlds and scientific visualizations to revisit their navigation history. The contribution of this system is to enable users to move more efficiently through the virtual environment so they can focus on their main activity.},
keywords = {3D navigation},
}
@misc{sun2016floatsliding,
title = {{FLOAT}-Sliding for {3D} Positioning},
author = {Sun*, Junwei and Stuerzlinger, Wolfgang},
booktitle = {Graphics Interface},
series = {GI '16},
howpublished = {Poster},
year = {2016},
month = {Jun},
numpages = {2},
abstract = {We describe a new technique for 3D positioning, based on the typical sliding technique. We assume that by default object stay in contact with the scene's front surfaces and do not interpenetrate other objects. To ensure precision, we permit manipulation only for at least partially visible objects. With our new FLOAT-Sliding method the user can override the default contact assumption and lift objects into the air or make them collide with other objects. For efficiency, FLOAT-Sliding uses frame buffer techniques.},
keywords = {3D manipulation, 3D positioning},
}
@misc{seim2016passive,
title = {Can Passive Haptic Learning Help Users Become More Skilled Keyboard Typists?},
author = {Seim*, Caitlyn and Doering+, Nick and Stuerzlinger, Wolfgang and Starner, Thad},
booktitle = {CHI 2016 Workshop on Inviscid Text Entry and Beyond},
series = {Textentry '16},
howpublished = {Extended Abstract},
year = {2016},
month = {May},
numpages = {4},
url = {http://www.textentry.org/chi2016},
abstract = {Passive Haptic Learning (PHL) can be used to teach text entry systems such as Braille and Morse code where each finger controls at most one key. However, most keyboards have a spatial layout where each finger controls multiple keys, and each key is labeled. Can PHL help users improve their skill at these text entry systems? We are investigating these questions by using passive stimuli to help users learn a randomized layout of the number pad. This research is aimed at laying the groundwork for creating a system to help individuals improve their QWERTY keyboard typing.},
keywords = {haptics, learning},
}
@misc{bjerre2015transition,
title = {Transition Times for Manipulation Tasks in Hybrid Interfaces},
author = {Bjerre+, Per and Christensen+, Allan and Pedersen+, Simon André and Pedersen+, Andreas Køllund and Stuerzlinger, Wolfgang},
booktitle = {3rd Symposium on Spatial User Interaction},
publisher = {ACM},
series = {SUI '15},
howpublished = {Poster},
year = {2015},
month = {Aug},
pages = {137-137},
doi = {https://doi.org/10.1145/2788940.2794358},
pdf = {papers/transitionsposter.pdf},
abstract = {Previous work has shown that uninstrumented in-air interaction is slower and not as precise for pointing tasks compared to the mouse. Yet, there are interaction scenarios where it is preferable or advantageous to use in-air input. Therefore, we examine a three-device hybrid setup involving the mouse, keyboard, and a Leap Motion. We performed a user study to quantify the costs associated with transitioning between these interaction devices and also for performing simple 2D manipulation tasks using the mouse and Leap Motion. We discovered that transitioning to and from the Leap Motion takes on average 0.87 seconds longer than transitions between the mouse and keyboard.},
keywords = {3D manipulation, 3D positioning},
}
@misc{arif2015smart,
title = {A Smart-Restorable Backspace to Facilitate Text Entry Error Correction},
author = {Arif, Ahmed Sabbir and Stuerzlinger, Wolfgang and Mazalek, Ali and Kim, Sunjun and Lee, Geehyuk},
booktitle = {CHI 2015 Workshop on Text Entry on the Edge},
series = {Textentry '15},
howpublished = {Extended Abstract},
year = {2015},
month = {Apr},
numpages = {4},
url = {http://www.textentry.org/chi2015},
abstract = {Selection is one of the most basic interaction methods in 3D user interfaces. Previous work has shown that visual feedback improves such actions. However, haptic feedback can increase the realism or also help for occluded targets. Here we investigate if 3D virtual hand selection benefits from electrical muscle stimulation (EMS) and vibration. In our experiment we used a 3D version of a Fitts' task to compare visual, EMS, vibration, and no feedback. The results demonstrate that both EMS and vibration are reasonable alternatives to visual feedback. We also found good user acceptance for both technologies.},
keywords = {text entry, errors, backspace},
}
@misc{pfeiffer2015ems,
title = {{3D} Virtual Hand Selection with {EMS} and Vibration Feedback},
author = {Pfeiffer*, Max and Stuerzlinger, Wolfgang},
booktitle = {33rd Annual Conference Extended Abstracts on Human Factors in Computing Systems},
publisher = {ACM},
series = {CHI EA '15},
howpublished = {Extended Abstract},
year = {2015},
month = {Apr},
pages = {1361-1366},
doi = {https://doi.org/10.1145/2702613.2732763},
abstract = {Selection is one of the most basic interaction methods in 3D user interfaces. Previous work has shown that visual feedback improves such actions. However, haptic feedback can increase the realism or also help for occluded targets. Here we investigate if 3D virtual hand selection benefits from electrical muscle stimulation (EMS) and vibration. In our experiment we used a 3D version of a Fitts' task to compare visual, EMS, vibration, and no feedback. The results demonstrate that both EMS and vibration are reasonable alternatives to visual feedback. We also found good user acceptance for both technologies.},
keywords = {3D positioning, haptics},
}
@misc{stuerzlinger2015tivs,
title = {TIVS: Temporary Immersive Virtual Environment at Simon Fraser University: A Non-permanent CAVE},
author = {Stuerzlinger, Wolfgang and Pavlovych*, Andriy and Nywton+, Dayson},
booktitle = {1st Workshop on Everyday Virtual Reality},
publisher = {IEEE},
series = {WEVR '15},
year = {2015},
month = {Mar},
pages = {23-28},
doi = {https://doi.org/10.1109/WEVR.2015.7151691},
pdf = {papers/tivs.pdf},
video = {videos/TIVS.mp4},
abstract = {CAVE systems are an immersive environment that surrounds one or more viewers with multiple large screens, which portray a virtual 3D environment. CAVEs use generally between three and six sides and are thus effectively permanent installations, due to the required floor and room space. We describe TIVS, the Temporary Immersive Virtual environment at Simon Fraser University, a system whose defining feature is that it does not consume any permanent floor space. Yet, TIVS can be in operation in less than a minute. Viewers sit on swivel chairs in the center of an 8' × 6' space, where TIVS's frame is mounted onto the ceiling. The bottom of said frame is 7' above the ground, making it easy for people to walk below it. The screens mounted on the frame are rolled down whenever the system is being used and are otherwise stowed away. That frees the floor space for other uses when the system is not in use. The projection geometry ensures that people sitting in the center area of the space do not cast shadows onto the screens. A tracking system attached to the frame provides for head tracking. Overall, the non-permanent nature of the system makes it surprisingly easy to integrate Virtual Reality into everyday environments.},
keywords = {immersive display system, large display system, cave},
}
@misc{codddowney2014leaplook,
title = {{LeapLook}: A Free-hand Gestural Travel Technique using the Leap Motion Finger Tracker},
author = {Codd-Downey*, Robert and Stuerzlinger, Wolfgang},
booktitle = {2nd Symposium on Spatial User Interaction},
publisher = {ACM},
series = {SUI '14},
howpublished = {Poster},
year = {2014},
month = {Oct},
pages = {153-153},
doi = {https://doi.org/10.1145/2659766.2661218},
abstract = {Contactless motion sensing devices enable a new form of input that does not encumber the user with wearable tracking equipment. We present a novel travel technique using the Leap Motion finger tracker which adopts a 2DOF steering metaphor used in traditional mouse and keyboard navigation in many 3D computer games.},
keywords = {3D navigation},
}
@misc{teather2014depthcues,
title = {Depth Cues and Mouse-Based {3D} Target Selection},
author = {Teather*, Robert J. and Stuerzlinger, Wolfgang},
booktitle = {2nd Symposium on Spatial User Interaction},
publisher = {ACM},
series = {SUI '14},
howpublished = {Poster},
year = {2014},
month = {Oct},
pages = {156-156},
doi = {https://doi.org/10.1145/2659766.2661221},
abstract = {We investigated mouse-based 3D selection using one-eyed cursors, evaluating stereo and head-tracking. Stereo cursors significantly reduced performance for targets at different depths, but the one-eyed cursor yielded some discomfort.},
keywords = {3D pointing},
}
@misc{pavlovych2014tivx,
title = {TIVX: Temporary Immersive Virtual Environment: A Non-Permanent CAVE},
author = {Pavlovych*, Andriy and Nywton+, Dayson and Stuerzlinger, Wolfgang},
booktitle = {GRAND NCE Conference},
series = {GRAND '14},
howpublished = {Demonstration},
year = {2014},
month = {May},
url = {http://grand-nce.ca/archives/annual-conference/grand-2014/program/poster-demo-experiences.html},
keywords = {immersive display system, cave},
}
@misc{arif2014howdo,
title = {How Do Users Interact with an Error Prone In-air Gesture Recognizer?},
author = {Arif*, Ahmed Sabbir and Stuerzlinger, Wolfgang and de Mendonça Filho+, Euclides José and Gordynski, Alec},
booktitle = {CHI Workshop on Gesture-based Interaction Design: Communication and Cognition},
howpublished = {Extended Abstract},
year = {2014},
month = {May},
numpages = {4},
pdf = {papers/errorpronegestures.pdf},
abstract = {We present results of two pilot studies that investigated human error behaviours with an error prone in-air gesture recognizer. During the studies, users performed a small set of simple in-air gestures. In the first study, these gestures were abstract. The second study associated concrete tasks with each gesture. Interestingly, the error patterns observed in the two studies were substantially different.},
keywords = {gestures, errors, mid-air},
}
@misc{arif2014error,
title = {Error Behaviours in an Unreliable In-Air Gesture Recognizer},
author = {Arif*, Ahmed Sabbir and Stuerzlinger, Wolfgang and de Mendonça Filho+, Euclides José and Gordynski, Alec},
booktitle = {Extended Abstracts on Human Factors in Computing Systems},
publisher = {ACM},
series = {CHI EA '14},
howpublished = {Extended Abstract},
year = {2014},
month = {May},
pages = {1603–1608},
doi = {https://doi.org/10.1145/2559206.2581188},
pdf = {papers/unreliableairgestures.pdf},
abstract = {This article presents results of two pilot studies that investigated error behaviours with an unreliable in-air gesture recognizer. During the studies, users performed a small set of simple in-air gestures. In the first study, these gestures were abstract. The second study associated concrete tasks with each gesture. The error patterns in the two studies were substantially different.},
keywords = {mid-air, gestures, errors},
}
@misc{teather2014fishtank,
title = {Fishtank Fitts: A Desktop VR Testbed for Evaluating {3D} Pointing Techniques},
author = {Teather*, Robert J. and Stuerzlinger, Wolfgang and Pavlovych*, Andriy},
booktitle = {Extended Abstracts on Human Factors in Computing Systems},
publisher = {ACM},
series = {CHI EA '14},
howpublished = {Extended Abstract},
year = {2014},
month = {May},
pages = {519–522},
doi = {https://doi.org/10.1145/2559206.2574810},
pdf = {papers/fishtankfittsdemo.pdf},
video = {videos/3DfishTankFitts.mp4},
abstract = {We present a desktop or "fish tank" virtual reality system for evaluating 3D selection techniques. Motivated by the successful application of Fitts' law to 2D pointing evaluation, the system provides a testbed for consistent evaluation of 3D point-selection techniques. The primary design consideration of the system was to enable direct and fair comparison between 2D and 3D pointing techniques. To this end, the system presents a 3D version of the ISO 9241-9 pointing task. Targets can be displayed stereoscopically, with head-coupled viewing, and at varying depths. The system also supports various input devices, including the mouse as well as 3D trackers in direct touch and remote pointing modes.},
keywords = {3D pointing},
}
@misc{stuerzlinger2013considerations,
title = {Considerations for Targets in {3D} Pointing Experiments},
author = {Stuerzlinger, Wolfgang},
booktitle = {Interactive Surfaces for Interaction with Stereoscopic {3D}},
series = {ISIS3D '13},
howpublished = {Extended Abstract},
year = {2013},
month = {Oct},
numpages = {4},
pdf = {papers/3Dtargets.pdf},
abstract = {We identify various tradeoffs around 3D pointing experiments based on Fitts' law and the ISO9241-9 methodology. The advantages and disadvantages of each approach are analyzed and compared against each other. We present some recommendations for 3D pointing experiments and avenues of future work.},
keywords = {3D pointing},
}
@misc{laldin2013up,
title = {Up- and Downwards Motions in {3D} Pointing},
author = {Laldin*, Sidrah and Teather*, Robert J. and Stuerzlinger, Wolfgang},
booktitle = {Symposium on Spatial User Interaction},
series = {SUI '13},
howpublished = {Poster},
year = {2013},
month = {Jul},
pages = {89-89},
doi = {https://doi.org/10.1145/2491367.2491393},
pdf = {papers/updownpointing.pdf},
abstract = {We present an experiment that examines 3D pointing in fish tank VR using the ISO 9241-9 standard. The experiment used three pointing techniques: mouse, ray, and touch using a stylus. It evaluated user pointing performance with stereoscopically displayed varying height targets above an upward-facing display. Results show differences in upwards and downwards motions for the 3D touch technique.},
keywords = {3D pointing},
}
@misc{bajer2013effects,
title = {Effects of Stereo and Head Tracking in {3D} Selection Tasks},
author = {Bajer*, Bartosz and Teather*, Robert J. and Stuerzlinger, Wolfgang},
booktitle = {Symposium on Spatial User Interaction},
series = {SUI '13},
howpublished = {Poster},
year = {2013},
month = {Jul},
pages = {77-77},
doi = {https://doi.org/10.1145/2491367.2491392},
pdf = {papers/headstereopointing.pdf},
abstract = {We report a 3D selection study comparing stereo and head-tracking with both mouse and pen pointing. Results indicate stereo was primarily beneficial to the pen mode, but slightly hindered mouse speed. Head tracking had fewer noticeable effects.},
keywords = {3D pointing},
}
@misc{stuerzlinger2013keynote,
title = {Modern Spatial and {3D} User Interfaces},
author = {Stuerzlinger, Wolfgang},
booktitle = {International Conference on Information Society},
publisher = {IEEE},
series = {iSociety '13},
howpublished = {Keynote abstract},
year = {2013},
month = {Jun},
pages = {9-9},
url = {https://ieeexplore.ieee.org/abstract/document/6636326},
abstract = {Three-dimensional (3D) user interfaces are popular in movies. Many current technologies enable people to interact with 3D content, also in computer games. I review the main ideas behind 3D user interfaces and present innovative solutions based on the capabilities and limitations of both humans and technologies.},
keywords = {3D user interfaces},
}
@comment{c, c={this has to be before the GRAND poster entry, as it attracted more citations than the poster}}
@misc{scheurich2013onehandedmating,
title = {A One-Handed Multi-Touch Mating Method for {3D} Rotations},
author = {Scheurich*, Doug and Stuerzlinger, Wolfgang},
booktitle = {Extended Abstracts on Human Factors in Computing Systems},
publisher = {ACM},
series = {CHI EA '13},
howpublished = {Extended Abstract},
year = {2013},
month = {Apr},
pages = {1623-1628},
doi = {https://doi.org/10.1145/2468356.2468646},
pdf = {papers/touchrotwip.pdf},
abstract = {Rotating 3D objects is a difficult task. We present a new rotation technique based on collision-free "mating" to expedite 3D rotations. It is specifically designed for one-handed interaction on tablets or touchscreens. A user study found that our new technique decreased the time to rotate objects in 3D by more than 60% in situations where objects align. We found similar results when users translated and rotated objects in a 3D scene. Also, angle errors were 35% less with mating. In essence, our new rotation technique improves both the speed and accuracy of common 3D rotation tasks.},
keywords = {3D manipulation},
}
@misc{scheurich2013mating,
title = {A One-Handed Multi-Touch Mating Method for {3D} Rotations},
author = {Scheurich*, Doug and Stuerzlinger, Wolfgang},
booktitle = {GRAND NCE Conference},
series = {GRAND '13},
howpublished = {Poster},
year = {2013},
month = {May},
abstract = {Rotating 3D objects is a difficult task. We present a new rotation technique based on collision-free "mating" to expedite 3D rotations. It is specifically designed for one-handed interaction on tablets or touchscreens. A user study found that our new technique decreased the time to rotate objects in 3D by more than 60% in situations where objects align. We found similar results when users translated and rotated objects in a 3D scene. Also, angle errors were 35% less with mating. In essence, our new rotation technique improves both the speed and accuracy of common 3D rotation tasks.},
keywords = {3D manipulation},
}
@misc{teather2013pointingtargets,
title = {Pointing at {3D} Target Projections with One-Eyed and Stereo Cursors},
author = {Teather*, Robert J. and Stuerzlinger, Wolfgang},
booktitle = {GRAND NCE Conference},
series = {GRAND '13},
howpublished = {Poster},
year = {2013},
month = {May},
abstract = {We present a study of cursors for selecting 2D-projected 3D targets. We compared a stereo- and mono-rendered (one-eyed) cursor using two mouse-based and two remote pointing techniques in a 3D Fitts' law pointing experiment. The first experiment used targets at fixed depths. Results indicate that one-eyed cursors only improve screen-plane pointing techniques, and that constant target depth does not influence pointing throughput. A second experiment included pointing between targets at varying depths and used only "screen-plane" pointing techniques. Our results suggest that in the absence of stereo cue conflicts, screen-space projections of Fitts' law parameters (target size and distance) yield constant throughput despite target depth differences and produce better models of performance.},
keywords = {3D pointing},
}
@misc{zaman2013alternatives,
title = {Alternatives in Generative Design},
author = {Zaman*, Loutfouz and Stuerzlinger, Wolfgang},
booktitle = {GRAND NCE Conference},
series = {GRAND '13},
howpublished = {Poster},
year = {2013},
month = {May},
keywords = {alternatives, design},
}
@misc{teather2012system,
title = {A System for Evaluating {3D} Pointing Techniques},
author = {Teather*, Robert J. and Stuerzlinger, Wolfgang},
booktitle = {18th Symposium on Virtual Reality Software and Technology},
publisher = {ACM},
series = {VRST '12},
howpublished = {Demonstration},
year = {2012},
month = {Dec},
pages = {209-210},
doi = {https://doi.org/10.1145/2407336.2407383},
pdf = {papers/3dpointingsystem.pdf},
abstract = {This demo presents a desktop VR system for evaluating human performance in 3D pointing tasks. The system supports different input devices (e.g., mouse and 6DOF remote pointer), pointing techniques (e.g., screen-plane and depth cursors), and cursor visualization styles (e.g., one-eyed and stereo 3D cursors). The objective is to comprehensively compare all combinations of these conditions. We especially focus in on fair and direct comparisons between 2D and 3D pointing tasks. Finally, our system includes a new pointing technique that outperforms standard ray pointing.},
keywords = {3D pointing},
}
@comment{c, c={leave the "_stuerzlinger" in the ID to enable umlaut-free search!}}
@misc{zeidler_stuerzlinger2012chinz,
title = {The Auckland Layout Editor: An Improved GUI Layout Specification Process},
author = {Zeidler*, Clemens and Lutteroth, Christof and Weber, Gerald and Stürzlinger, Wolfgang},
booktitle = {13th International Conference of the NZ Chapter of the ACM's Special Interest Group on Human-Computer Interaction},
series = {CHINZ '12},
howpublished = {Demonstration},
year = {2012},
month = {Jul},
pages = {103-103},
doi = {https://doi.org/10.1145/2379256.2379287},
abstract = {Constraint-based layout managers are more powerful than the common grid, grid-bag, and group layout managers. However, they are also more complex and come with potential problems such as over-constrained specifications and overlap in a GUI. Current GUI builders have little support for layout constraints, and it is not clear how such constraints can be made easily accessible to GUI designers. We will demonstrate a GUI builder - the Auckland Layout Editor (ALE) - that addresses these challenges, by allowing GUI designers to specify constraint-based layouts using only simple mouse operations. ALE guarantees that all operations lead to sound specifications, making sure that the layout is solvable and non-overlapping. To achieve the latter, we propose an algorithm that automatically generates the missing constraints that are necessary to keep a layout non-overlapping. Today's applications need to run on multiple devices with different screen sizes. For this a layout must have a good appearance at different sizes. To aid the designer in creating a layout with good resizing behavior, we propose a novel automatic layout preview, which displays the layout at its minimal and at an enlarged size chosen to visualize layout problems directly.},
keywords = {GUI, layout},
}
@misc{das2012comparing,
title = {Comparing Cognitive Effort in Spatial Learning of Text Entry Keyboards and {ShapeWriters}},
author = {Das*, Arindam and Stuerzlinger, Wolfgang},
booktitle = {Working Conference on Advanced Visual Interfaces},
series = {AVI '12},
howpublished = {Extended Abstract},
year = {2012},
month = {May},
pages = {649-652},
doi = {https://doi.org/10.1145/2254556.2254676},
pdf = {papers/effort2learn.pdf},
abstract = {Stable structured layouts of buttons are a primary means of control for input in current graphical user interfaces. Such layouts are ubiquitous - from tiny iPhone screens to large kiosk screens in the malls - they are found everywhere. Yet, there has been relatively little theoretical account that compares the impact of cognitive effort on learning such stable layouts. In this paper, we demonstrate that prior empirical results on cognitive effort in learning stable layouts are theoretically predictable through the memory activation model of a cognitive architecture, ACT-R. We go beyond previous work by quantitatively comparing the level of cognitive effort in terms of a newly introduced parameter in the declarative memory model of ACT-R. We theoretically compare the cognitive effort of two different layouts of graphical buttons with respect to their label representativeness in the domains of traditional keyboard and ShapeWriter.},
keywords = {text entry, learning},
}
@misc{teather2012cursors,
title = {Cursors for {3D} Pointing},
author = {Teather*, Robert J. and Stuerzlinger, Wolfgang},
booktitle = {The 3rd Dimension of CHI ({3DCHI}): Touching and Designing {3D} User Interfaces},
series = {3DCHI '12},
howpublished = {Extended Abstract},
year = {2012},
month = {May},
numpages = {8},
pdf = {papers/cursor3Dpointingshort.pdf},
abstract = {We present a study of cursors for 3D pointing/selection interfaces. We compared a stereo- and mono-rendered (one-eyed) cursor used with two mouse-based and two remote pointing techniques. This comparison was performed in a 3D Fitts' law pointing experiment with varying target depths. Results indicate that the one-eyed cursor is beneficial only for some pointing techniques. While the mouse-based techniques performed best, our new ray-screen technique outperforms traditional ray pointing. This is likely because it is less affected by target depth.},
keywords = {3D pointing},
}
@misc{arif2012how,
title = {How Do Users Adapt to a Faulty System?},
author = {Arif*, Ahmed Sabbir and Stuerzlinger, Wolfgang},
booktitle = {CHI Workshop on Designing and Evaluating Text Entry Methods},
series = {Textentry '12},
howpublished = {Extended Abstract},
year = {2012},
month = {May},
numpages = {4},
url = {http://www.textentry.org/chi2012},
pdf = {papers/faultysystemshort.pdf},
abstract = {We investigate how users gradually adapt to a faulty system and how the system error rate influences this adaptation process. We present results of a study that verifies that a user's learning rate to compensate for system errors depends on how erroneous that system is – they learn to avoid erroneous actions faster if errors occur more frequently.},
keywords = {gestures, errors},
}
@misc{stuerzlinger2012stereo,
title = {Stereo vs. One-Eyed Cursors for {3D} Pointing and Implications for Touch Interfaces},
author = {Stuerzlinger, Wolfgang and Teather*, Robert J.},
booktitle = {Touching the 3rd Dimension},
series = {Dagstuhl Seminar 12151},
howpublished = {Abstract},
year = {2012},
month = {Apr},
doi = {https://doi.org/10.4230/DagRep.2.4.1},
abstract = {We compare remote pointing and mouse pointing techniques using both a stereo- and mono-rendered cursor in a Fitts' law pointing experiment with varying target depths in a 3D scene. Results indicate that mouse-based techniques perform best and that the one-eyed cursor is beneficial only for some pointing techniques. We discuss the implications for 3D touch interfaces.},
keywords = {3D pointing},
}
@misc{zaman2012evaluation,
title = {Evaluation of a {3D} {UI} with Different Input Technologies},
author = {Zaman*, Loutfouz and Shuralyov*, Dmitri and Teather*, Robert J. and Stuerzlinger, Wolfgang},
booktitle = {Symposium on {3D} User Interfaces},
publisher = {IEEE},
series = {3DUI '12},
howpublished = {Extended Abstract},
year = {2012},
month = {Mar},
pages = {173-174},
doi = {https://doi.org/10.1109/3DUI.2012.6184217},
pdf = {papers/evalwiimouse.pdf},
abstract = {We present two studies of navigation and object manipulation in a virtual supermarket. The first study compared a mouse and keyboard setup to a game hardware setup using a Wii Remote, Wii Balance Board and a dancemat. The second study used more game-like software interfaces for both conditions and used only the Wii Remote and Nunchuk in the game-hardware setup. The mouse setup was around 36% faster in both studies. In the first study the mouse setup was 98% more accurate; no difference in accuracy was found in the second study.},
keywords = {3D pointing},
}
@misc{teather2012investigating,
title = {Investigating One-Eyed and Stereo Cursors for {3D} Pointing Tasks},
author = {Teather*, Robert J. and Stuerzlinger, Wolfgang},
booktitle = {Symposium on {3D} User Interfaces},
publisher = {IEEE},
series = {3DUI '12},
howpublished = {Extended Abstract},
year = {2012},
month = {Mar},
pages = {167-168},
doi = {https://doi.org/10.1109/3DUI.2012.6184214},
pdf = {papers/cursor3Dpointingposter.pdf},
abstract = {We compared two remote pointing techniques to two mouse pointing techniques using both with a stereo- and mono-rendered cursor. These were compared using a Fitts' law pointing experiment with varying target depths in a 3D scene. Results indicate that mouse-based techniques performed best and that the one-eyed cursor is beneficial only for some pointing techniques.},
keywords = {3D pointing},
}
@misc{stuerzlinger2011onoffline,
title = {On- and Off-Line User Interfaces for Collaborative Cloud Services},
author = {Stuerzlinger, Wolfgang},
booktitle = {CHI Workshop Designing Interaction for the Cloud},
howpublished = {Extended Abstract},
year = {2011},
month = {May},
numpages = {6},
pdf = {papers/cloudui.pdf},
abstract = {We describe a vision for user interfaces of cloud-based systems that permit seamless collaboration and provide also on- and off-line access to data. All individual components of this vision are currently available in various systems, but the sum of the components will satisfy user needs much more comprehensively.},
keywords = {GUI, cloud computing, off-line, collaboration},
}
@misc{pavlovych2011pursuit,
title = {Pursuit Tracking in Presence of Latency, Jitter, and Dropouts},
author = {Pavlovych*, Andriy and Stuerzlinger, Wolfgang},
booktitle = {GRAND NCE Conference},
series = {GRAND '11},
howpublished = {Poster},
year = {2011},
month = {May},
keywords = {latency, jitter, tracking},
}
@misc{zaman2011darls,
title = {DARLS: Differencing and Merging Diagrams Using Dual View Animation, Re-Layout, Layers and a Storyboard},
author = {Zaman*, Loutfouz and Kalra+, Ashish and Stuerzlinger, Wolfgang},
booktitle = {Extended Abstracts on Human Factors in Computing Systems},
publisher = {ACM},
series = {CHI EA '11},
howpublished = {Extended Abstract},
year = {2011},
month = {May},
pages = {1657-1662},
doi = {https://doi.org/10.1145/1979742.1979824},
pdf = {papers/darls.pdf},
abstract = {We present a new system for visualizing and merging differences in diagrams. It uses animation, dual views, a storyboard, relative re-layout, and layering to visualize differences. The system is also capable of differencing UML class diagrams. An evaluation produced positive results for animation and dual views with difference layer.},
keywords = {difference visualization},
}
@misc{shuralyov2011puzzle,
title = {A {3D} Desktop Puzzle Assembly System},
author = {Shuralyov*, Dmitri and Stuerzlinger, Wolfgang},
booktitle = {Symposium on {3D} User Interfaces},
publisher = {IEEE},
series = {3DUI '11},
howpublished = {3DUI contest entry},
year = {2011},
month = {Mar},
pages = {139-140},
doi = {https://doi.org/10.1109/3DUI.2011.5759244},
pdf = {papers/3dpuzzle.pdf},
video = {videos/Puzzle2x.mp4},
teaser = {teasers/3dpuzzle.png},
abstract = {We describe a desktop virtual reality system targeted at 3D puzzle assembly. The results of the evaluation show that all novices could successfully complete the puzzle within an average of about six minutes, while experts took about two minutes.},
keywords = {3D manipulation},
}
@misc{pavlovych2010effects,
title = {Effects of Latency Jitter and Dropouts in Pointing Tasks},
author = {Pavlovych*, Andriy and Stuerzlinger, Wolfgang},
booktitle = {GRAND NCE Conference},
series = {GRAND '10},
howpublished = {Poster},
year = {2010},
month = {Jul},
abstract = {Interactive computing systems frequently use pointing as an input modality, while also supporting other forms of input. We focus on pointing and investigate the effects of variations, i.e. jitter, in the input device latency, as well as dropouts, on 2D pointing speed and accuracy. First, we characterize the latency, latency jitter, and dropouts in several common input technologies. Then we present an experiment, where we systematically explore combinations of dropouts, latency, and latency jitter on a desktop mouse. The results indicate that latency and dropouts have a strong effect on human performance; moderate amounts of jitter in latency do not change performance in a significant way in most cases.},
keywords = {latency, jitter, pointing},
}
@misc{zaman2010interface,
title = {A New Interface for Cloning Objects in Drawing Systems},
author = {Zaman*, Loutfouz and Stuerzlinger, Wolfgang},
booktitle = {GRAND NCE Conference},
series = {GRAND '10},
howpublished = {Poster},
year = {2010},
month = {Jun},
abstract = {Cloning objects is a common operation in graphical user interfaces. A good example is calendar systems, where users commonly create and modify recurring events, i.e. repeated clones of a single event. Inspired by the calendar paradigm, we introduce a new cloning technique for 2D drawing programs. This technique allows users to clone objects by first selecting them and then dragging them to create clones along the dragged path. A novel approach for the generation of clones of clones is also presented. Moreover, the technique enables editing of the generated sequences of clones similar to the editing of calendar events.
We compared our new clone creation technique with generic duplication via copy-and-paste, smart duplication, and a dialog driven technique on a desktop system. The results show that the new cloning method is always faster than dialogs and faster than smart duplication for most conditions. We also compared our clone editing method against rectangular selection. The results show that our method is better in general. In situations where rectangle selection is effective, our method is still competitive. Participants preferred the new techniques overall, too.},
keywords = {cloning, drawing, copy, paste},
}
@misc{pavlovych2010effectslatency,
title = {Effects of Latency Jitter and Dropouts in Pointing Tasks},
author = {Pavlovych*, Andriy and Stuerzlinger, Wolfgang},
booktitle = {Graphics Interface},
series = {GI '10},
howpublished = {Poster},
year = {2010},
month = {May},
pages = {30-32},
abstract = {Interactive computing systems frequently use pointing as an input modality, while also supporting other forms of input. We focus on pointing and investigate the effects of variations, i.e. jitter, in the input device latency, as well as dropouts, on 2D pointing speed and accuracy. First, we characterize the latency, latency jitter, and dropouts in several common input technologies. Then we present an experiment, where we systematically explore combinations of dropouts, latency, and latency jitter on a desktop mouse. The results indicate that latency and dropouts have a strong effect on human performance; moderate amounts of jitter in latency do not change performance in a significant way in most cases.},
keywords = {latency, jitter, pointing},
}
@misc{arif2010mobile,
title = {Two New Mobile Touchscreen Text Entry Techniques},
author = {Arif*, Ahmed Sabbir and Lopez+, Mauricio H. and Stuerzlinger, Wolfgang},
booktitle = {Graphics Interface},
series = {GI '10},
howpublished = {Poster},
year = {2010},
month = {May},
abstract = {This article introduces two new mobile touchscreen text entry techniques. One is timeout-based and the other is pressure-based. Also, this work examines the effects of tactile feedback on text entry techniques. Empirical comparisons between conventional and proposed techniques show that the new techniques, as well as tactile feedback, enhance overall text entry performance.},
keywords = {text entry, mobile device},
}
@misc{agarwal2010widgetlens,
title = {{WidgetLens}: Interaction Through The Looking Glass},
author = {Agarwal*, Bhavna and Stuerzlinger, Wolfgang},
booktitle = {Graphics Interface},
series = {GI '10},
howpublished = {Poster},
year = {2010},
month = {May},
abstract = {Computer and mobile device screens are increasing in size and resolution. This increase in resolution causes problems with graphical user interfaces designed for lower resolution screens, as all information gets smaller and smaller. We present two novel techniques to make graphical user interfaces on high-resolutions screens more accessible and usable. We introduce a new in-place, localized zooming technique that works on a per widget basis. We also present a novel widget magnification technique that implements special modalities for common user interface elements, which affords widget-dependent magnification.},
keywords = {GUI, widget, magnification, layout},
}
@misc{dehmeshki2010design,
title = {Design of a Perceptual-Based Object Group Selection Technique},
author = {Dehmeshki*, Hoda and Stuerzlinger, Wolfgang},
booktitle = {Graphics Interface},
series = {GI '10},
howpublished = {Poster},
year = {2010},
month = {May},
abstract = {Selecting groups of objects is a common task in graphical user interfaces. Current selection techniques such as lasso and rectangle selection become time-consuming and error-prone in dense configurations or when the area covered by targets is large or hard to reach. This paper presents a new pen-based interaction technique that allows users to efficiently select perceptual groups formed by the Gestalt principle of good continuity.},
keywords = {group selection},
}
@misc{teather2010target,
title = {Target Pointing in {3D} User Interfaces},
author = {Teather*, Robert J. and Stuerzlinger, Wolfgang},
booktitle = {Graphics Interface},
series = {GI '10},
howpublished = {Poster},
year = {2010},
month = {May},
abstract = {We present two studies using ISO 9241-9 to evaluate target pointing in two different 3D user interfaces. The first study was conducted in a CAVE, and used the standard tapping task to evaluate passive haptic feedback. Passive feedback increased throughput significantly, but not speed or accuracy alone. The second experiment used a fish tank VR system, and compared tapping targets presented at varying heights stereoscopically displayed at or above the surface of a horizontal screen. The results indicate that targets presented closer to the physical display surface are generally easier to hit than those displayed farther away from the screen.},
keywords = {3D pointing},
}
@misc{ashtiani2009xnt,
title = {XNT: Object Transformation on Multi-Touch Surfaces},
author = {Ashtiani*, Behrooz and Stuerzlinger, Wolfgang},
booktitle = {Conference on Interactive Tabletops and Surfaces 2009},
series = {ITS '09},
howpublished = {Poster},
year = {2009},
month = {Nov},
numpages = {2},
pdf = {papers/xntposter.pdf},
video = {videos/XNT3D.mp4},
abstract = {We present and evaluate a new object transformation technique for multi-touch surfaces. Specifying complete object transformations for a two-dimensional space requires a minimum of four degrees of freedom (DOF): two for position, one for rotation, and another for scaling. Many existing techniques for object transformation are designed to function with traditional input devices such as mice, single-touch surfaces, or stylus pens. The challenge is then to compensate for the lack of DOF's. XNT is a new three-finger object transformation technique, designed specifically for multi-touch surface devices. It provides a natural interface for object manipulation and was experimentally found to be faster than previous techniques.},
keywords = {manipulation, touch},
}
@misc{teather2009coupling,
title = {Evaluating Visual/Motor Coupling in Fish Tank VR},
author = {Teather*, Robert J. and Allison, Robert and Stuerzlinger, Wolfgang},
booktitle = {CVR Conference},
series = {CVR '09},
howpublished = {Poster},
year = {2009},
month = {Jun},
keywords = {3D pointing},
}
@misc{teather2009effectslatency,
title = {Effects of Latency and Spatial Jitter on {2D} and {3D} Pointing},
author = {Teather*, Robert J. and Pavlovych*, Andriy and Stuerzlinger, Wolfgang},
booktitle = {Virtual Reality Conference},
publisher = {IEEE},
series = {VR '09},
howpublished = {Poster},
year = {2009},
month = {Mar},
pages = {229-230},
doi = {https://doi.org/10.1109/VR.2009.4811029},
abstract = {We investigate the effects of input device latency and spatial jitter on 2D pointing tasks and a 3D movement. First, we characterize jitter and latency in a 3D tracking device and an optical mouse used for baseline comparison. We present an experiment based on ISO 9241-9, which measures performance of pointing devices. We added latency and jitter to the mouse and compared it to a 3D tracker. Results indicate that latency has a stronger effect on performance than small spatial jitter. A second experiment found that erratic jitter "spikes" can affect 3D movement performance.},
keywords = {3D pointing, latency, jitter},
}
@misc{stuerzlinger2008nextgen,
title = {Next Generation {3D} Interaction Techniques},
author = {Stuerzlinger, Wolfgang and Wingrave*, Chad},
booktitle = {Virtual Realities},
series = {Dagstuhl Seminar 08231},
howpublished = {Abstract},
year = {2008},
month = {Jun},
url = {http://drops.dagstuhl.de/opus/volltexte/2008/1634},
abstract = {We present a set of guidelines for 3D positioning techniques. These guidelines are intended for developers of object interaction schemes in 3D games, modeling packages, computer-aided design systems, and virtual environments. The guidelines promote intuitive object movement techniques in these types of environments.},
keywords = {3D manipulation, 3D pointing},
}
@misc{das2008recall,
title = {Recall Accuracy Drive Visual Strategy Adaptation in Multi-tap Text Entry},
author = {Das*, Arindam and Stuerzlinger, Wolfgang},
booktitle = {Graphics Interface},
series = {GI '08},
howpublished = {Poster},
year = {2008},
month = {May},
abstract = {We present a cognitive model that demonstrates how the recall accuracy of letter positions on a cell phone keypad effects the transition from novice to expert behavior. In particular, we target multi-tap text entry methods and focus on the process of visually searching versus selecting (i.e. deciding) a letter on the keypad. The model predicts the probability of letter location recall by novice users through a cognitive architecture named ACT-R, and models learning as the user gradually gains cognitive expertise with practice, session after session. We then employ this probability within a model of strategy adaptation that encapsulates the effect of different visual exploration strategies: novice users search for a letter while the behavior of advanced users is modeled by the Hick-Hyman Law. The final output of our cognitive model is the entry speed for the key press for a letter in a letter-group containing multiple distinct letters.},
keywords = {text entry, learning},
}
@misc{dadgari2008analysis,
title = {Analysis of Merging Text Versions Using Differentiation Methods},
author = {Dadgari*, Darius and Stuerzlinger, Wolfgang},
booktitle = {Graphics Interface},
series = {GI '08},
howpublished = {Poster},
year = {2008},
month = {May},
abstract = {Comparing and selecting text from multiple versions of a document is a necessary task for a task-leader or group to undertake when users collaborate in writing a document, or when a single user generates different versions of a document to experiment with. Comparing multiple documents in an intuitive, efficient way allows a user to select the most appropriate portions of work from multiple sources quickly, to create a final document. Examination and even publications of text versioning methods are not documented in the literature, even though implementations of text versioning are abundant in a multitude of commercial and non-commercial software.
We propose new methods for text versioning, based on methods which have been previously shown to be effective for differentiating between objects. We plan to perform an extensive evaluation with these proposed methods to currently implemented ones in order to examine which methods are preferred by users and which show benefit in terms of error rate and completion time.},
keywords = {difference visualization},
}
@misc{dehmeshki2008using,
title = {Using Perceptual Grouping for Object Group Selection},
author = {Dehmeshki*, Hoda and Stuerzlinger, Wolfgang},
booktitle = {Graphics Interface},
series = {GI '08},
howpublished = {Poster},
year = {2008},
month = {May},
abstract = {Selection is a critical task in document processing systems, and is required for many manipulation operations such as deleting, moving, reusing, or re-formatting. Documents have usually a hierarchical structure. For example, books are naturally represented as a sequence of chapters, sections, subsections and so on until described completely in terms of basic component such as paragraphs, tabular material, and images. This structure is usually visualized using different formats (e.g. font sizes) or different views (e.g. outline views in Microsoft Words). Despite this inherent structure, to the best of our knowledge no selection technique systematically utilizes this structure in pen-based system. The multi-click approach is a standard selection method offered by many systems. Single, double, and triple clicking then selects the corresponding unit (e.g. word, line, and paragraph, respectively). This approach cannot select larger units than a paragraph and is not well suited for pen-based systems, as multi-clicking is unreliable for pens. Current selection techniques such as Rectangle, Lasso require users to explicitly define a selection scope by a pen movement. This can be time-consuming and error-prone when the target is large (e.g. multiple paragraphs) or spans more than a page. In the later case, the user has to select and scroll simultaneously. Moreover, these techniques are one directional, i.e. from the start point to the end point. The following common scenario describes potential problems: during a paragraph selection, the user decides to select the previous paragraph as well. She has two choices: either cancelling, relocating the mouse (pen), and re-starting a new selection, or selecting both paragraphs individually while using a phrasing technique (such as a Shift-key).
We propose a novel pen-based technique issues for selecting document components. Performing a pigtail gesture in a margin selects the nearby unit. Continuous pigtails extend selection to previous, next or both units according to the last pigtail orientation. Our technique automatically scrolls (or zooms out) when selecting off-screen targets.},
keywords = {group selection},
}
@misc{pavlovych2008effect,
title = {Effect of Group Size and Interaction Devices in Co-Located Computer Supported Collaborative Work},
author = {Pavlovych*, Andriy and Stuerzlinger, Wolfgang},
booktitle = {Graphics Interface},
series = {GI '08},
howpublished = {Poster},
year = {2008},
month = {May},
keywords = {large display interaction, collaboration, groupware, CSCW},
}
@misc{teather2008exaggerating,
title = {Exaggerating Head-Coupled Camera Motions in Fish Tank VR},
author = {Teather*, Robert J. and Stuerzlinger, Wolfgang},
booktitle = {Graphics Interface},
series = {GI '08},
howpublished = {Poster},
year = {2008},
month = {May},
abstract = {Virtually exaggerating head motions when using head-coupled viewing may be beneficial. This is especially important in environments where the user is sitting, such as in desktop or "fish-tank" VR. We present an evaluation of exaggerated head-coupled perspective for 3D assembly tasks. Three levels of exaggeration were compared to determine if exaggeration was beneficial compared to a direct mapping. The results suggest that there is some user preference towards modest levels of exaggeration. However, no significant differences by the experimental conditions were detected, other than a learning effect.},
keywords = {3D navigation},
}
@misc{dehmeshki2008intelligent,
title = {Intelligent Object Group Selection},
author = {Dehmeshki*, Hoda and Stuerzlinger, Wolfgang},
booktitle = {Extended Abstracts on Human Factors in Computing Systems},
publisher = {ACM},
series = {CHI EA '08},
howpublished = {Extended Abstract},
year = {2008},
month = {Apr},
pages = {3111-3116},
doi = {https://doi.org/10.1145/1358628.1358816},
pdf = {papers/gestaltclick.pdf},
abstract = {Current object group selection techniques such as lasso or rectangle selection can be time consuming and error prone. This is apparent when selecting distant objects on a large display or objects arranged along curvilinear paths in a dense area. We present a novel group selection technique based on the Gestalt principles of proximity and good continuity. The results of a user study show that our new technique outperforms lasso and rectangle selection for object groups in(curvi)linear arrangements or clusters, i.e. groups with an implicit structure.},
keywords = {group selection},
}
@misc{teather2008assessingeffects,
title = {Assessing the Effects of Orientation and Device on {3D} Positioning},
author = {Teather*, Robert J. and Stuerzlinger, Wolfgang},
booktitle = {Virtual Reality Conference},
publisher = {IEEE},
series = {VR '08},
howpublished = {Poster},
year = {2008},
month = {Mar},
pages = {293-294},
doi = {https://doi.org/10.1109/VR.2008.4480807},
pdf = {papers/move3dposter2.pdf},
abstract = {We present two studies to assess which physical factors of various input devices influence 3D object movement tasks. In particular, we evaluate the factors that seem to make the mouse a good input device for constrained 3D movement tasks. The first study examines the effect of a supporting surface across orientation of input device movement and display orientation. Surprisingly, no significant results were found for the effect of physical support for constrained movement techniques. Also, no significant difference was found between matching the orientation of the display to that of the input device movement. A second study found that the mouse outperformed all tracker conditions for speed, but the presence or absence of support had no significant effect when tracker movement is constrained to 2D.},
keywords = {3D pointing},
}
@misc{dehmeshki2007gestalt,
title = {Gestalt-Based Object Group Selection},
author = {Dehmeshki*, Hoda and Stuerzlinger, Wolfgang},
booktitle = {CVR Conference},
series = {CVR '08},
howpublished = {Poster},
year = {2007},
month = {Jun},
pdf = {papers/gestaltmodel2.pdf},
abstract = {Object grouping in graphical systems is supported by Lasso or Rectangle techniques which could require extra steps. This work presents a new approach to group objects by Gestalt principles of proximity, curve-linearity, similarity and common region. We demonstrate the results with several examples.},
keywords = {group selection},
}
@misc{teather2007challenge,
title = {The Challenge of {3D} Interaction: Guidelines for Intuitive {3D} Manipulation Techniques},
author = {Teather*, Robert J. and Stuerzlinger, Wolfgang},
booktitle = {Interacting with Immersive Worlds},
howpublished = {Abstract},
year = {2007},
month = {Jun},
numpages = {1},
abstract = {The rapid evolution of computer technology has made it possible to generate increasingly realistic virtual environments. However, despite the promise and hype of virtual reality that began in the 1980s, actual usage of the technology (outside of research settings) is limited primarily to derivatives of truly immersive VR, such as 3D video games. We suggest that one of the greatest barriers to widespread adoption of VR technology is the lack of intuitive interaction techniques available in virtual environments. True 3D manipulation is a 6 degree of freedom (6DOF) task, i.e. three independent axes of movement and three independent axes of rotation. Although we regularly perform such manipulations in reality with our hands, in a virtual environment, we are faced with a difficult choice of input devices: either use a familiar, but less immersive device, such as a mouse or use any of a number of unfamiliar and problematic 3D input devices. However, a mouse is a 2DOF device, providing movement in two directions only. Without support from software techniques that map 2D mouse movements into 6DOF operations, such a device is inadequate for manipulating objects in 3D.
One alternative is to use a higher DOF input device (e.g. 3D wands or gloves) which can provide high-precision 3D positioning and orientation. This is an attractive solution for immersive environments where the user is standing. Another possibility is to use a mouse with indirect manipulation techniques, such as 3D widgets, or control keys to toggle the axis of movement/rotation. However, both of these approaches present unique sets of problems. Full 6DOF input devices tend to be difficult to use and indirect manipulation techniques force the user to mentally decompose each manipulation into a series of steps. Both solutions require the user to think about the interface, rather than the task at hand.
A third approach is to use constraints, such as gravity, collision avoidance, etc. Building on this idea, we propose instead the use of "intelligent" 2DOF interaction techniques that automatically and intuitively map 2D mouse motions to 3D movement. One such technique, used for moving objects in the Sesame 3D conceptual modeling tool has been shown in experiments to be significantly faster and more accurate than both 6DOF input and 3D widget interaction techniques. This technique is an example of 3D direct manipulation, allowing users to "click and drag" objects in the scene. Dragging the object causes it to slide along the foremost visible surface behind it in the scene. This sliding motion behaves in a very predictable, natural way, and suggests that a mouse with suitably intelligent software support may be an ideal "3D" input device for certain VR and 3D applications, notably 3D modeling.
Based on this, and related research, we have composed a list of several guidelines for researchers developing immersive applications requiring 3D interaction. These guidelines are intended to aid designers in choosing methods of interaction, but are broad enough to encompass any type of 3D application requiring the accurate interactive positioning of objects in the environment. Current research suggests that techniques based on these guidelines may not only benefit mouse-based input, but input from higher-DOF devices as well.},
keywords = {3D manipulation},
}
@misc{teather2007evaluation,
title = {An Evaluation of {3D} Positioning Techniques for Scene Assembly},
author = {Teather*, Robert J. and Stuerzlinger, Wolfgang},
booktitle = {Symposium on {3D} User Interfaces},
publisher = {IEEE},
series = {3DUI '07},
howpublished = {Poster},
year = {2007},
month = {Mar},
numpages = {1},
pdf = {papers/move3dposter.pdf},
keywords = {3D manipulation, 3D positioning},
}
@misc{stuerzlinger2006covidsystem,
title = {{CoViD}: A System for Collaborative Virtual {3D} Design},
author = {Stuerzlinger, Wolfgang},
booktitle = {CSCW Workshop: Design and CSCW},
howpublished = {Extended Abstract},
year = {2006},
month = {Nov},
numpages = {2},
pdf = {papers/covid_short.pdf},
abstract = {Many important decisions in the design process are made fairly early on, after designers have presented initial concepts. In many domains, these concepts are now realized as 3D digital models and, in meetings, the stakeholders evaluate these potential solutions. Frequently, the participants in such a meeting want to interactively modify the proposed designs to explore the design space better. Today's systems and tools do not support this, as computer systems typically support only a single user and computer-aided design tools require significant training. This paper presents a new system to facilitate a collaborative 3D design process. The new system, CoViD, consists of two main parts. The first part is an easy-to-use conceptual 3D design tool that can be used productively even by naive users. The second part is a novel infrastructure for collaborative work, which offers an interactive table and several large interactive displays in a semi-immersive setup. The synthesis of both parts forms a new platform for collaborative virtual 3D design.},
keywords = {collaboration, design, 3D modeling},
}
@misc{dehmeshki2006perceptual,
title = {A Perceptual-based Group Selection Technique for Graph Drawing Systems},
author = {Dehmeshki*, Hoda and Stuerzlinger, Wolfgang},
booktitle = {Grace Hopper Conference},
howpublished = {Poster},
year = {2006},
month = {Oct},
keywords = {group selection},
}
@misc{stuerzlinger2006reality,
title = {Reality-Based Object Movement Techniques for {3D}},
author = {Stuerzlinger, Wolfgang and Dadgari*, Darius and Oh*, Ji-Young},
booktitle = {CHI Workshop: What is the Next Generation of Human-Computer Interaction?},
howpublished = {Extended Abstract},
year = {2006},
month = {Apr},
articleno = {D.3},
numpages = {4},
pdf = {papers/realitymove3d.pdf},
abstract = {Scene layout and part assembly are basic tasks in 3D object manipulation. While movement methods based on 3D or 6D input devices exist, the most efficient 3D movement techniques are based on utilizing only two degrees of freedom. This poses the problem of mapping the motion of the 2D input device to efficient and predictable object motion in 3D. We present a new method to map 2D input to 3D motion in this paper. The object position follows the mouse cursor position closely, while the object always stays in contact with other surfaces in the scene. In contrast to existing techniques, the movement surface and the relative object position is determined using the whole area of overlap of the moving object with the static scene. The resulting object movement is visually smooth and predictable, while avoiding undesirable collisions. The technique also utilizes the fact that people easily recognize the depth-order of shapes based on occlusions. The proposed technique runs in real-time. Finally, the evaluation of the new technique with a user study shows that it compares very favorably to conventional techniques.},
keywords = {3D manipulation, 3D positioning},
}
@misc{kulikov2006targeted,
title = {Targeted Steering Motions},
author = {Kulikov*, Sergey and Stuerzlinger, Wolfgang},
booktitle = {Extended Abstracts on Human Factors in Computing Systems},
publisher = {ACM},
series = {CHI EA '06},
howpublished = {Extended Abstract},
year = {2006},
month = {Apr},
pages = {983-988},
doi = {https://doi.org/10.1145/1125451.1125640},
pdf = {papers/targetsteer.pdf},
abstract = {In this paper we investigate targeted steering motions. Fitts' law is a very successful model to explain human targeting behavior, while the Steering law has been used to model steering motions. Dennerlein et al. combined these two models to explain targeted steering motions, but this combination introduces additional parameters. In this paper, we present a new, simpler, model that can be used to predict targeted steering motions.},
keywords = {steering},
}
@misc{dehmeshki2006using,
title = {Using Perceptual Grouping for Object Group Selection},
author = {Dehmeshki*, Hoda and Stuerzlinger, Wolfgang},
booktitle = {Extended Abstracts on Human Factors in Computing Systems},
publisher = {ACM},
series = {CHI EA '05},
howpublished = {Extended Abstract},
year = {2006},
month = {Apr},
pages = {700-705},
doi = {https://doi.org/10.1145/1125451.1125593},
pdf = {papers/gestaltmodel.pdf},
abstract = {Modern graphical user interfaces support the direct manipulation of objects and efficient selection of objects is an integral part of this user interface paradigm. For the selection of object groups most systems implement only rectangle selection and shift-clicking. This paper presents an approach to group selection that is based on the way human perception naturally groups objects, also known as the "Gestalt" phenomenon. Based on known results from perception research, we present a new approach to group objects by the Gestalt principles of proximity, curve-linearity, and closure. We demonstrate the results with several examples.},
keywords = {group selection},
}
@misc{kulikov2005measuring,
title = {Measuring the Effective Parameters of Steering Motions},
author = {Kulikov*, Sergey and {MacKenzie}, I. Scott and Stuerzlinger, Wolfgang},
booktitle = {Extended Abstracts on Human Factors in Computing Systems},
publisher = {ACM},
series = {CHI EA '05},
howpublished = {Extended Abstract},
year = {2005},
month = {Apr},
pages = {1569-1572},
doi = {https://doi.org/10.1145/1056808.1056968},
pdf = {papers/steeringwidth.pdf},
teaser = {teasers/steeringwidth.png},
abstract = {The steering law model describes pointing device motion through constrained paths. Previous uses of the model are deficient because they are built using only error-free responses, ignoring altogether the path of the cursor. We correct this by proposing and validating a technique to include spatial variability, including errors. The technique is a variant of the well-known "effective target width" used in Fitts' law models. An experiment designed to test our technique demonstrates the improvement: Correlations are consistently higher when spatial variability is included in building the model. Suggestions to aid further development of the steering law model are included.},
keywords = {steering},
}
@misc{stuerzlinger2005multi,
title = {MULTI: Multi-User Laser Table Interface},
author = {Stuerzlinger, Wolfgang},
booktitle = {CHI Workshop on Distributed Display Environments},
howpublished = {Extended Abstract},
year = {2005},
month = {Apr},
numpages = {2},
pdf = {papers/multi_design.pdf},
abstract = {We present a new system, which consists of an interactive table and several interactive wall displays and is designed to be used by a single person as well as collaboratively. A new kind of interaction device, based on laser pointes, affords both local (i.e. pen-based) as well as remote interaction. The research focuses on interaction techniques for this system as well as research on collaborative activities, in particular collaborative design.},
keywords = {large display system, large display interaction, collaboration, laser},
}
@misc{pavlovych2005windowmanager,
title = {A Window Manager for High Dynamic Range Display Systems},
author = {Pavlovych*, Andriy and Vorozcovs*, Andrew and Stuerzlinger, Wolfgang},
booktitle = {VR Workshop on Emerging Display Technologies},
howpublished = {Extended Abstract},
year = {2005},
month = {Mar},
pages = {31-34},
pdf = {papers/hdrwinmgr.pdf},
abstract = {The dynamic luminance range of many real-world environments exceeds the capabilities of current display technology by several orders of magnitude. Recently, new display systems have demonstrated, which are capable of displaying images with a dynamic luminance range much more similar to that encountered in the real world.
The paper summarizes how the human eye perceives high dynamic luminance ranges, sources of high dynamic range data, how the new display systems work, as well as their limitations. The paper discusses the need for a high dynamic range window manager and presents an initial implementation. Finally, the results of a preliminary evaluation are presented.},
keywords = {high dynamic range, GUI},
}
@misc{oh2004sesame,
title = {{SESAME}: {3D} Conceptual Design System},
author = {Oh*, Ji-Young and Stuerzlinger, Wolfgang},
booktitle = {SIGGRAPH Posters},
publisher = {ACM},
series = {SIGGRAPH '04},
howpublished = {Poster},
year = {2004},
month = {Aug},
numpages = {1},
doi = {https://doi.org/10.1145/1186415.1186461},
pdf = {papers/sesame_poster.pdf},
abstract = {We present a system for a conceptual design session in the desktop Virtual Environment (DVE) and Computer Aided Design (CAD). We consider easy modification to be important for conceptual sessions, as users alter the design frequently in those sessions. The system presents new techniques to make the modification of a scene easy.},
keywords = {3D manipulation, 3D positioning, design},
}
@misc{pouliquen2004hog,
title = {{HOG}: A New Model Representation for {3D} Acquisition and Planning},
author = {Pouliquen*, Gilles and Stuerzlinger, Wolfgang},
booktitle = {Canadian Conference on Intelligent Systems},
howpublished = {Poster},
year = {2004},
month = {Jun},
numpages = {1},
pdf = {papers/HOG_poster.pdf},
abstract = {Digital acquisition of 3D objects is a process in which a computer model of a physical object is constructed. This process is extremely popular nowadays as the resulting computer models have many applications. The acquisition process can be decomposed into four stages which have to be repeated until a satisfying model is obtained. Those four stages are scanning, registration, integration and planning [1].
The planning stage is needed because an object cannot be modeled from a single scan. It is necessary to measure the object from various points of view to obtain a complete model.
Currently, there is no system that can automatically scan an unknown object. Hence, a highly trained operator is needed to control the scanning device. The operator must select poses for the scanner such that the number of scans required to completely scan the object is kept reasonably small.
We present a novel representation for the model: the Hierarchical Occupancy Grid (HOG). This representation can be used for the integration and planning stage of the 3D acquisition pipeline.},
keywords = {3D scanning, next-best view},
}
@misc{stuerzlinger2004presentation,
title = {High Dynamic Range Display System},
author = {Stuerzlinger, Wolfgang},
booktitle = {DRDC/CVR Workshop},
howpublished = {Abstract},
year = {2004},
month = {Mar},
keywords = {high dynamic range, display},
}
@misc{pavlovych2003modeling,
title = {Modeling non-Expert Text Entry Speed on Phone Keypads},
author = {Pavlovych*, Andriy and Stuerzlinger, Wolfgang},
booktitle = {16th Annual ACM Symposium on User Interface Software and Technology},
series = {UIST '03},
howpublished = {Poster},
year = {2003},
month = {Nov},
pdf = {papers/nonexpertmodel.pdf},
abstract = {For mobile phones, previous research has created models that can be used to predict expert performance. However, one important factor that influences the success of new interaction techniques is the users' initial experience with them. In this work, we present a new model to predict text entry speed on 12-button mobile phone keypads for novices. The model is based on Fitts' law, letter digraph probabilities, and a model of the mental processing time before key presses.},
keywords = {text entry, novice},
}
@misc{seetzen2003emerging,
title = {High Dynamic Range Display System},
author = {Seetzen*, Helge and Whitehead, Lorne and Stuerzlinger, Wolfgang and Vorozcovs*, Andrew and Wilson, Hugh and Ashdown, Ian and Ward, Greg},
booktitle = {Emerging Technologies at ACM SIGGRAPH 2003},
series = {SIGGRAPH '03},
howpublished = {Demonstration},
year = {2003},
month = {Jul},
numpages = {1},
pdf = {papers/hdr_demonstration.pdf},
abstract = {We have developed a high dynamic range (HDR) display capable of presenting a luminance range of 10,000 cd/m2 to 0.1 cd/m2. In addition to the initial embodiment of the technology, we have developed a flat-panel version using light emitting diodes (LED) which offers the same dramatic dynamic range benefits in a much smaller package.},
keywords = {high dynamic range, display},
}
@misc{yourganov2002simulation,
title = {Simulation of Camera Distortions},
author = {Yourganov*, Grigori and Stuerzlinger, Wolfgang},
booktitle = {Space Vision and Advanced Robotics},
series = {SVAR '02},
howpublished = {Poster},
year = {2002},
month = {Jun},
keywords = {camera distortion},
}
@techreport{yourganov2001tonemapping,
title = {Tone-Mapping for High Dynamic Range Images},
author = {Yourganov*, Grigori and Stuerzlinger, Wolfgang},
institution = {Dept. of Computer Science, York University, Canada},
type = {Technical Report},
year = {2001},
month = {Dec},
numpages = {12},
pdf = {papers/TR_tonemapping.pdf},
keywords = {high dynamic range, tone mapping},
}
@misc{yourganov2001hdrvideo,
title = {High Dynamic Range Video},
author = {Yourganov*, Grigori and Stuerzlinger, Wolfgang},
booktitle = {York CVR Conference: Levels of Perception},
series = {CVR '01},
howpublished = {Poster},
year = {2001},
month = {Jun},
keywords = {high dynamic range, video},
}
@techreport{yourganov2001acquiring,
title = {Acquiring High Dynamic Range Video at Video Rates},
author = {Yourganov*, Grigori and Stuerzlinger, Wolfgang},
institution = {Dept. of Computer Science, York University, Canada},
type = {Technical Report},
year = {2001},
month = {May},
numpages = {18},
pdf = {papers/TR_hdrvideo.pdf},
abstract = {In the real world, the scene may contain some well-illuminated areas as well as some areas that are in the darkness. The dynamic range of the scene, or the radiance ratio between the brightest and the darkest spots, can be quite big – it can span several orders of magnitude in some cases. This is a lot wider range than the range that our digital camera can adequately capture, and that our monitor can adequately display. The areas that are too bright for the dynamic range of our camera are going to be saturated on our image, and the areas that are too dark will be under-exposed. In both cases, all the information about these areas will be lost in the image.
A way to solve this problem is to combine different shutter speeds of our camera. Smaller shutter speeds can give us good information about the bright areas (because we won't have saturation), and longer shutter speeds effectively capture the dark areas. So by alternating the shutter speeds and by combining the two images into one in real-time, we can achieve higher dynamic range for digital video cameras.},
keywords = {high dynamic range, video},
}
@misc{yourganov2001poster,
title = {High Dynamic Range Video},
author = {Yourganov*, Grigori and Stuerzlinger, Wolfgang},
booktitle = {Vision and Intelligent Systems Workshop},
howpublished = {Poster},
year = {2001},
month = {May},
keywords = {high dynamic range, video},
}
@misc{poupyrev20003duibib,
title = {20th Century {3DUI} Bib: Annotated Bibliograpy of {3D} User Interfaces of the 20th Century},
author = {Poupyrev, Ivan and Kruijff, Ernst and Bowman, Doug and Billinghurst, Mark and Cugini, John and Dachselt, Raimund and Hinckley, Ken and {LaViola}, Joe and Lindeman, Rob and Pierce, Jeff and Steed, Anthony and Stuerzlinger, Wolfgang},
year = {2000},
month = {Jan},
url = {http://people.cs.vt.edu/~bowman/3dui.org/bibs/3duibib.pdf},
commented-url = {http://www.mic.atr.co.jp/~poup/3dui/3duibib.htm},
commented-url2 = {https://web.archive.org/web/20070223123901/http://www.mic.atr.co.jp/~poup/3dui/3duibib.htm},
}
@misc{elinas2000clouds,
title = {Real Time Rendering of {3D} Clouds},
author = {Elinas*, Pantelis and Stuerzlinger, Wolfgang},
booktitle = {Graphics Interface},
series = {GI '00},
howpublished = {Poster},
year = {2000},
month = {May},
numpages = {3},
pdf = {papers/cloudsposter.pdf},
abstract = {There is a myriad of real-time graphics applications that can greatly increase in realism with the introduction of realistic clouds in the scenery. These include applications in virtual reality, outdoor scene visualization, flight simulation, games etc. In the past, several researchers have proposed algorithms for realistic cloud rendering for non-real-time applications. Of these, the approaches of Gardner 85 and Nishita 96 stand out as the ones that give the most visually pleasing results. In our work, we are developing an implementation of Gardner's 3D cloud rendering algorithm augmented with recent advances such as photon maps with the help of hardware accelerated OpenGL.
Our implementation follows closely, Gardner's approach. We use textured ellipsoids as the building blocks for the clouds. We use Perlin noise textures compared to Gardner's spectral noise textures because we have more flexibility in controlling their appearance. The texture used is an indication of the volume density of the ellipsoid. Rendering the ellipsoids produces ellipses. Because clouds are more transparent at their edges compared to their middle, a result of the fact that the center of a cloud is denser, we need to fuzz out the edges of the ellipses.
Each cloud is made of a number of ellipsoids. The first step is to render each of the ellipsoids individually and evaluate the transparency over the resulting ellipse. The next step is to combine all the ellipses together to render the complete cloud.
Equation (1) is used to compute the transparency as a function of two thresholds one applied to the edge (T1) and one applied to the center of
the ellipse (T2). The values produced are consistent with OpenGL alpha channel values. We use a normalizing factor D just as Gardner did. We generate the function g(x,z) over the ellipsoid by utilizing projective textures. The latter function is maximum at the center of the ellipse and goes to zero at its edges; a spotlight texture is used to generate this effect. Evaluation is done partly in the alpha channel and partly in the RGB channels of the frame buffer in two steps. First T2*(1-g(x,z)) is computed and stored in the RGB channels. The It-T1 part is computed in the alpha channel. We then perform α = (R-α) by utilizing the color matrix extension. We set the color matrix to copy the red to the alpha channel while setting up subtractive blending and then we perform the operation by copying the frame buffer onto itself. The 1/D scaling is also achieved in the same step by including the 1/D term in the color matrix. The result is stored in the alpha channel while the RGB channels are cleared to accept new data in the next step.
Next we render the ellipsoids using a second texture that determines their color. We use another Perlin noise texture modulated with the color of the ellipsoids calculated using an infinite light source representing the Sun. The latter produces a simple approximation to global illumination of the cloud even though effects such as self-shading of the cloud is not taken into account. We are currently investigating better approaches to this such as using photon maps. The results of this step are stored in the RGB channels.
At this point the back buffer holds each of the ellipses including their transparency. We read these data into a texture of the smallest size that includes all the ellipses. Then, we calculate where on the screen each of the ellipses should appear and we render textured rectangles for each of the ellipsoids. We render each of the rectangles in the order of back to front with respect to the position of the ellipsoids in 3D; the ellipsoids are originally sorted roughly from back to front with respect to the location of their center.
This implementation is compatible with standard OpenGL hardware in its majority with the exception of the color matrix extension that is only available on SGI machines. Our implementation achieves real-time frame rates on low-end workstations such the SGI NT 320 and SGI O2 machines. More complex clouds made of 130+ ellipsoids can be rendered in real-time on more powerful machines such as the SGI Onyx.},
keywords = {rendering, real-time},
}
@misc{salzman2000constraint,
title = {Constraint Based {3D} Scene Construction},
author = {Salzman*, Tim and Smith*, Graham and Stuerzlinger, Wolfgang},
booktitle = {Graphics Interface},
series = {GI '00},
howpublished = {Poster},
year = {2000},
month = {May},
numpages = {2},
pdf = {papers/miveposter.pdf},
abstract = {Realistic 3D scenes often contain thousands of objects, and are in general difficult to model using today's CAD programs. We address this problem by exploiting predefined semantic relationships between objects to dynamically group and constrain them [GS99]. Virtual constraints, which de-couple the object's geometry from its constraints, are presented. Also discussed are techniques for dynamically grouping and re-grouping objects based on their semantic and virtual constraints. Preliminary testing shows that our system provides a fast, intuitive user interface for 3D scene construction. Finally, we will present ideas for future work.
Positioning objects in a virtual environment is not an intuitive task. One approach is direct manipulation using a six degree of freedom (DOF) input device. However, it is hard to position objects precisely using these devices, users often become fatigued, and many object interactions can be more effectively accomplished using a simple 2D interface such as a mouse [HPGK+94]. For these reasons, much research has been focused on software techniques for manipulating 3D objects using standard 2D input devices.
Bier [Bi90] presented snap-dragging for interactive solid modeling systems. This system used a general purpose gravity function and alignment manifolds to position objects in the scene. Snap-dragging provided easy selection of object features but the system required a complex user interface, had an unchangeable view and was computationally intensive.
In Object Associations [BS95], Bukowski and Sequin use a combination of physical properties (pseudo gravity) and goal oriented behaviour (alignment) to position and manipulate objects in a scene. This system was used to model the Berkeley Soda Hall WALKTRHU environment, which contained thousands of objects. However, adding new objects to the library is difficult, as object association must be coded. Constrained objects do not always move together because there is no dynamic grouping, instead the scene is searched for associated objects each time an object is moved. Further, all associations in this system are limited by object geometry.
Gosele exploited natural object behaviour to define and maintain object constraints [Go99]. Polygons were used to define offer and constraint areas, and a hierarchical labelling system was used to define which polygons could be constrained together. Typical constraint labels were on-Floor, on-Wall, and on-Workspace. Collision detection was added to the system to add realism by preventing inter-object penetrations. However, once constrained, objects in this system could not be unconstrained. Also, multiple constraints between two-objects were not possible.
Our system improves upon previous work in the following ways. Firstly, we allow constraints to be broken by pulling away from the constraining surface. For example, an object constrained to the floor and the wall can be unconstrained from the wall by pulling the object away from the wall. Also, an object can be re-constrained by translating it to another acceptable offer area. To show the user which offer areas will accept an object, all acceptable offer areas are highlighted when an object is selected for translation. Un-constraining and re-constraining an object invokes the dynamic grouping mechanism, which maintains the constraint relationships between objects.
We present the notion of virtual constraints. A virtual-constraint can be any polygon in 3D object-space, not necessarily associated with the object's geometry. An example is a polygon somewhere beneath a table, to which the front of a chair may be constrained. We present negative constraints, which are a specialization of virtual constraints are. Negative constraints are useful for defining volumes of space in which certain objects should not be placed. For example a desk would not be placed against a doorway because it would make the door inaccessible.
Our system has optimized the constraint satisfaction algorithm by pruning the search for valid offer areas and using a minimal distance constraint, typically the bounding radius of an object.
Finally, we present dual-constraints, bi-directional constraints between objects. When two or more objects are constrained by dual constraints, they form a dual-group. Using a drag-add technique, a row of constrained, neatly aligned books can be created on a bookshelf with one interaction step. We introduce the push-pull metaphor for interacting with a dual-group. When a dual-group is selected for translation, a connected-component search finds all group members who are attached to the selected object by dual-constraints in the approximate direction of translation. Those objects that are not attached in the direction of translation are un-grouped. With this technique, a row of cabinets that are connected by dual groups can be split into two groups by selecting a cabinet in the center and pulling in the direction that the new group is to translate.
Preliminary testing of the system is very promising. After a very short demo of the system, first time users were able to recreated a reasonably complicated scene in a matter minutes. Future plans are to test the system rigorously and compare results to a system with conventional interaction techniques.},
keywords = {3D manipulation},
}
@misc{stcyr2000knowledge,
title = {A Knowledge-Based Agent for CAD systems},
author = {St-Cyr+, Olivier and Lesperance, Yves and Stuerzlinger, Wolfgang},
booktitle = {Graphics Interface},
series = {GI '00},
howpublished = {Poster},
year = {2000},
month = {May},
numpages = {2},
pdf = {papers/agentposter.pdf},
abstract = {This poster describes an approach in improving the usability of computer-aided design (CAD) applications by adding an intelligent agent that assists the user in his/her interaction with the system. To implement the agent, I used ConGolog [GLL97, LLR99] – a very high-level programming language for developing knowledge-based agents that are embedded in complex environments. ConGolog supports the specification of a task-level model of a dynamic environment, the description of complex behaviours, and the synthesis of new plans at run-time. A prototype intelligent agent is being developed to work with an existing 3D CAD system [GS99]. This agent is intended to help the user in designing an office layout that satisfies his goals.
The CAD system [GS99] that our intelligent agent works with is built to allow the user to design a 3D virtual environment (office, kitchen, living room, etc.). The system's graphical user interface is quite simple. Interactions consist primarily of using the mouse to pick and place various types of objects (desk, chair, lamp, inkwell, etc.) in the room layout. In this, it resembles the Object Associations system [BS95]. The system handles the details of interactions based on a model of objects and the physical constraints that hold in the scene, for instance, an object being supported by a particular surface. But the system lacks a model of the user, of the task that he/she is trying to perform, and of the objectives that he/she is trying to achieve. It cannot really assist the user in quickly creating the desired room layout.
An early example for a system that attempts to aid the user in creating a room layout is CRACK [FM88]. This 2D system critiques the current design with text messages that explain the problem. The domain knowledge embedded in the critiquing system is not used to actively aid the user for placing objects.
It is believed that the use of intelligent agent technology can provide many benefits in the area of layout systems. An agent would maintain a high-level representation of the application domain, including object behaviour and user knowledge and goals. This could be used to enforce complex application specific constraints on the way objects are manipulated and on the layouts
that are produced. Secondly, such a model could be used for disambiguation and consistency checking. Humans often communicate information about a task very inaccurately because they understand the context of the task and its goals from previous experience. An agent could use its domain knowledge to resolve ambiguities, as well as ask more meaningful questions when user input is required. Moreover, the user goal model could be exploited to detect inadvertent errors. Thirdly, the agent could also aid the user in constructing the virtual design using its knowledge of the domain and user goals. Because it is aware of the current state of the design, it can provide suggestions and advice to the user, guide him through the task, and respond to user's questions. All this would lead towards much more natural and intuitive interaction between the user and the CAD system.},
keywords = {3D manipulation, design},
}
@misc{stcyr2000intelligent,
title = {An Intelligent Assistant for Computer-Aided Design},
author = {St-Cyr+, Olivier and Lesperance, Yves and Stuerzlinger, Wolfgang},
booktitle = {Smart Graphics: Papers from the AAAI Spring Symposium},
series = {SG '00},
isbn = {978-157735110-8},
howpublished = {Extended Abstract},
year = {2000},
month = {Mar},
pages = {24-28},
url = {https://aaai.org/Library/Symposia/Spring/ss00-04.php},
pdf = {papers/intelagent.pdf},
abstract = {This paper describes an approach in improving the usability of computer-aided design (CAD) applications by adding an intelligent agent that assists the user in his/her interaction with the system. To implement the agent, we use ConGolog [GLL97, LLR99] – a very high-level programming language for developing knowledge-based agents that are embedded in complex environments. ConGolog supports the specification of a task-level model of a dynamic environment, the description of complex behaviors, and the synthesis of new plans at run-time. A prototype intelligent agent is being developed to work with an existing 3D CAD system [GS99]. This agent is intended to help the user in designing an office layout that satisfies his goals.
The CAD system [GS99] that our intelligent agent works with is built to allow the user to design a 3D virtual environment (office, kitchen, living room, etc.). The system's graphical user interface is quite simple. Interactions consist primarily of using the mouse to pick and place various types of objects (desk, chair, lamp, inkwell, etc.) in the room layout. In this it resembles the Object Associations system [BS95]. The system handles the details of interactions based on a model of objects and the physical constraints that hold in the scene, for instance, an object being supported by a particular surface. But the system lacks a model of the user, of the task that he is trying to perform, and of the objectives that he is trying to achieve. It cannot really assist the user in quickly creating the desired room layout.
An early example for a system that attempts to aid the user in creating a room layout is CRACK [FM88]. This 2D system critiques the current design with text messages that explain the problem. The domain knowledge embedded in the critiquing system is not used to actively aid the user for placing objects.
We believe that the use of intelligent agent technology can provide many benefits in the area of layout systems. An agent would maintain a high-level representation of the application domain, including object
behavior and user knowledge and goals. This could be used to enforce complex application specific constraints on the way objects are manipulated and on the layouts that are produced. Secondly, such a model could be used for disambiguation and consistency checking. Humans often communicate information about a task very inaccurately, because they understand the context of the task and its goals from previous experience. An agent could use its domain knowledge to resolve ambiguities, as well as ask more meaningful questions when user input is required. Moreover, the user goal model could be exploited to detect inadvertent errors. Thirdly, the agent could also aid the user in constructing the virtual design using its knowledge of the domain and user goals. Because it is aware of the current state of the design, it can provide suggestions and advice to the user, guide him through the task, and respond to user questions. All this would lead to much more natural and intuitive interaction between the user and the CAD system.},
keywords = {3D modeling, 3D manipulation, constraints},
}
@comment{c, c={leave the "_stuerzlinger" in the ID to enable umlaut-free search!}}
@techreport{bastos_stuerzlinger1998forward,
title = {Forward Mapped Planar Mirror Reflections},
author = {Bastos*, Rui and Stürzlinger, Wolfgang},
institution = {Univ. of North Carolina at Chapel Hill},
type = {Technical Report},
year = {1998},
month = {Aug},
number = {TR98-026},
numpages = {12},
pdf = {papers/TR98-026.pdf},
abstract = {This paper presents a new technique, which we call depth-preserving reflection mapping, to render mirror-like reflections on planar surfaces in constant time. It is a hybrid solution which combines geometry-based rendering and image-based rendering into a two-pass mirror reflection rendering approach. The technique extends the traditional reflection mapping to preserve depth per texel and uses forward warping to approximate the mirror-like reflections on planar surfaces. For clarity, to distinguish these texels from the ones of traditional reflection mapping, we call them zexels.},
keywords = {rendering, real-time},
}
@comment{c, c={leave the "_stuerzlinger" in the ID to enable umlaut-free search!}}
@techreport{raskar_stuerzlinger1998efficientimage,
title = {Efficient Image Generation for Multiprojector and Multisurface Displays},
author = {Raskar*, Ramesh and Cutts*, Matt and Welch, Greg and Stürzlinger, Wolfgang},
institution = {Univ. of North Carolina at Chapel Hill},
type = {Technical Report},
year = {1998},
month = {Apr},
number = {TR98-016},
numpages = {12},
pdf = {papers/TR98-016.pdf},
abstract = {We describe an efficient approach to rendering a perspectively correct image on a potentially irregular display surface that may be illuminated with one or more distinct devices. The first pass of the technique generates an image of the desired graphics model using conventional rendering. The second pass projects that image as a texture onto a model of the display surface, then re-renders the textured display surface model from the viewpoint of each display device. The algorithm scales with the complexity of the display surface, and is constant with respect to the complexity of the graphics model.},
keywords = {rendering, projector, real-time},
footnote = {Extended version of EGSR '98 paper with theoretical analysis},
}
@comment{c, c={leave the "_stuerzlinger" in the ID to enable umlaut-free search!}}
@misc{schaufler_stuerzlinger1998hierarchical,
title = {{3D} Hierarchical Image Cache},
author = {Schaufler*, Gernot and Stürzlinger, Wolfgang},
booktitle = {Workshop on Image-Based Rendering and Modeling},
howpublished = {Poster},
year = {1998},
month = {Mar},
commented-url = {http://www.gup.uni-linz.ac.at:8001/staff/schaufler/papers/octimp},
keywords = {rendering, real-time},
}
@techreport{aliaga_stuerzlinger1998framework,
title = {A Framework for the Real-Time Walkthrough of Massive Models},
author = {Aliaga*, Daniel and Cohen*, Jon and Wilson*, Andrew and Zhang*, Hansong and Erikson*, Carl and Hoff*, Kenny and Hudson*, Tom and Stürzlinger, Wolfgang and Baker*, Eric and Bastos*, Rui and Whitton, Mary and Brooks, Fred and Manocha, Dinesh},
institution = {Univ. of North Carolina at Chapel Hill},
type = {Technical Report},
year = {1998},
month = {Mar},
number = {TR98-013},
numpages = {12},
url = {https://techreports.cs.unc.edu/papers/98-013.pdf},
pdf = {papers/TR98-013.pdf},
abstract = {We present a framework for rendering very large 3D models at nearly interactive rates. The framework scales with model size. Our framework can integrate multiple rendering acceleration techniques, including visibility culling, geometric levels of detail, and image-based approaches. We describe the database representation scheme for massive models used by the framework. We provide an effective pipeline to manage the allocation of system resources among different techniques. We demonstrate the system on a model of a coal-fired power plant composed of more than 15 million triangles.},
keywords = {rendering, real-time},
}
@techreport{stuerzlinger1998imaging,
title = {Imaging all Visible Surfaces Or How many Reference Images are needed for Image-Based Modeling?},
author = {Stürzlinger, Wolfgang},
institution = {Univ. of North Carolina at Chapel Hill},
type = {Technical Report},
year = {1998},
month = {Mar},
number = {TR98-010},
numpages = {11},
pdf = {papers/TR98-010.pdf},
abstract = {Today many systems exist to generate geometric models of existing scenes and objects. However, no accurate data about surface appearance such as colors and textures is stored in this process. Such data can be captured as a series of images that, collectively, capture all surfaces of the object.
This work introduces a method to compute a minimal set of camera positions for this purpose. Taking images from the computed positions can then be used to derive a complete set of surface appearance data. A slightly different application of the presented method is the computation of a minimal set of viewpoints for reference images to be used in image-based rendering methods.
First a method to determine an optimal set of viewpoint regions for a given scene is introduced. It uses a hierarchical visibility method to preprocess the scene. Then a technique to find an optimal set of viewpoint regions is presented and the solution is used to derive an optimal set of viewpoints. Results and visualizations of the computed solutions are presented.},
keywords = {3D scanning, visibility},
}
@techreport{stuerzlinger1995discontinuity,
title = {Discontinuity Meshing for a Radiosity Algorithm},
author = {Stürzlinger, Wolfgang},
institution = {GUP, Johannes Kepler Universität Linz, Austria},
type = {Technical Report},
year = {1995},
month = {Oct},
number = {CEI PACT D4V-8},
url = {https://www.jku.at/forschung/forschungs-dokumentation/publikation/2155},
keywords = {rendering, global illumination},
}
@techreport{stuerzlinger1995form,
title = {Form Factor Calculation for a Parallel Radiosity Algorithm},
author = {Stürzlinger, Wolfgang},
institution = {GUP, Johannes Kepler Universität Linz, Austria},
type = {Technical Report},
year = {1995},
month = {Jul},
number = {CEI-PACT D4V-6},
url = {https://www.jku.at/forschung/forschungs-dokumentation/publikation/2142},
keywords = {rendering, global illumination, parallel, visibility},
}
@comment{c, c={leave the "_stuerzlinger" in the ID to enable umlaut-free search!}}
@misc{schaufler_stuerzlinger1995parallelposter,
title = {Parallel Radiosity},
author = {Schaufler*, Gernot and Stürzlinger, Wolfgang and Volkert, Jens},
booktitle = {Workshop on Algorithms for Future Technologies},
howpublished = {Poster},
year = {1995},
month = {Mar},
commented-location = {Prague, CZ},
keywords = {rendering, global illumination, parallel},
}
@comment{c, c={leave the "_stuerzlinger" in the ID to enable umlaut-free search!}}
@techreport{schaufler_stuerzlinger1995load,
title = {Load Balancing for a Parallel Radiosity Algorithm},
author = {Schaufler*, Gernot and Stürzlinger, Wolfgang and Wild*, Christoph},
institution = {GUP, Johannes Kepler Universität Linz, Austria},
type = {Technical Report},
year = {1995},
month = {Jan},
number = {CEI PACT D4V-3},
url = {https://www.jku.at/forschung/forschungs-dokumentation/publikation/2134},
keywords = {rendering, global illumination, parallel, visibility},
}
@techreport{stuerzlinger1994description,
title = {Description and Implementation of a Parallel Radiosity Algorithm},
author = {Stürzlinger, Wolfgang and Wild*, Christoph and Schaufler*, Gernot},
institution = {GUP, Johannes Kepler Universität Linz, Austria},
type = {Technical Report},
year = {1994},
month = {Jul},
number = {CEI PACT D4V-1},
url = {https://www.jku.at/forschung/forschungs-dokumentation/publikation/2129},
keywords = {rendering, global illumination, parallel},
}
@misc{stuerzlinger1994parallelvisibility,
title = {Parallel Visibility Calculations for Parallel Radiosity},
author = {Stürzlinger, Wolfgang and Wild*, Christoph},
booktitle = {Workshop Paragraph},
howpublished = {Poster},
year = {1994},
month = {Mar},
pages = {32-40},
commented-location = {Hagenberg, AT},
abstract = {The radiosity method models the interaction of light between diffuse reflecting surfaces, thereby accurately predicting global illumination effects. Due to the high computational effort to calculate the transfer of light between surfaces and the memory requirements for the scene description, a distributed, parallelized version of the algorithm is needed for scenes consisting of thousands of surfaces. We present a distributed, parallel progressive radiosity algorithm. Then we parallelize the visibility calculations and present a scheme for the communication structure. Finally we analyze the results.},
keywords = {rendering, global illumination, parallel, visibility},
}
@techreport{stuerzlinger1993fxfire,
title = {FXFIRE - Global Illumination with Radiosity},
author = {Stürzlinger, Wolfgang},
institution = {GUP, Johannes Kepler Universität Linz, Austria},
type = {Technical Report},
year = {1993},
month = {Dec},
keywords = {rendering, global illumination},
}
@techreport{stuerzlinger1993flirt,
title = {FLIRT - Faster than Light Ray Tracer},
author = {Stürzlinger, Wolfgang and Tobler*, Robert and Schindler*, Michael},
institution = {Vienna University of Technology, Austria},
type = {Technical Report},
year = {1993},
month = {Aug},
keywords = {rendering, ray tracing},
}
@mastersthesis{stuerzlinger1999habilitation,
title = {Bildgenerierung},
author = {Stürzlinger, Wolfgang},
publisher = {Johannes Kepler Universität Linz, Austria},
year = {1999},
month = {Apr},
abstract = {A fundamental task in computer graphics is the generation of images. Given a geometric model of an object or scene the user wants a visual representation for a given viewpoint. This visualization process is also known as rendering images of a model.
An active research area in rendering is the generation of images with high visual realism. Important visual cues like highlights on surfaces and shadows cast by light sources aid the viewer in understanding an image. Images with high realism are produced with global illumination methods, which approximate the light distribution in an environment to varying degrees.
The major challenge in real-time rendering is to generate images as quickly as possible. Frame rates higher than 20 frames per second are needed to ensure that users perceive smooth motion. Although image generation hardware is widely available, it is hard to visualize very large structures at interactive rates even on high-end platforms. Furthermore, model sizes are growing quicker than graphics hardware capabilities. Several classes of techniques for optimized rendering have been devised to achieve high frame rates.
This text places most publications of the author in the context of these two research areas in computer graphics.},
keywords = {rendering, real-time, ray tracing},
note = {Austrian Habilitation},
}
@phdthesis{stuerzlinger1992dissertation,
title = {Radiosity mit Voronoi-Diagrammen und Diskontinuitäts-Meshes},
author = {Stürzlinger, Wolfgang},
school = {Vienna University of Technology, Austria},
year = {1992},
month = {Dec},
url = {https://catalogplus.tuwien.at/permalink/f/qknpf/UTW_alma2156324830003336},
abstract = {In dieser Arbeit wird ein Verfahren vorgestellt, das es ermöglicht, die genaue Beleuchtung einer Szene zu berechnen, die von flächigen Lichtquellen beleuchtet wird und die durch Polygone beschrieben ist, deren Oberflächen diffus sind. Zuerst wird eine Oberflächenrepräsentation mit Voronoi-Diagrammen vorgestellt, die es erlaubt beim Progressive Refinement Radiosity-Verfahren die Oberflächen adaptiv zu unterteilen, ohne dass die aus der Literatur bekannten Probleme auftreten. Dann wird ein Verfahren zur Berechnung von Schatten- und Halbschatten-Bereichen besprochen. Dieses Verfahren konstruiert eine Oberflächen-Repräsentation, die auf die verschiedenen Diskontinuitäten der Helligkeitsfunktion auf einer Oberfläche Rücksicht nimmt. Durch die neu vorgestellte Kombination der beiden Verfahren kann nun sowohl die Helligkeitsfunktion auf den Oberflächen sehr exakt approximiert werden, als auch die Radiosity von diesen Flächen genau weiterverteilt werden. Dadurch wird das Problem der diffusen globalen Beleuchtung gelöst. Zusätzlich wird eine Methode vorgestellt, die es erlaubt, nur die relevanten Diskontinuitäten zu berechnen, wodurch eine Beschleunigung des Verfahrens erzielt wird.},
keywords = {rendering, global illumination},
note = {Dissertation, in German},
}
@mastersthesis{stuerzlinger1989ccompiler,
title = {C-Compiler für den VIP-Prozessor},
author = {Stürzlinger, Wolfgang},
school = {Vienna University of Technology, Austria},
year = {1989},
month = {Nov},
url = {https://catalogplus.tuwien.at/permalink/f/qknpf/UTW_alma2145146200003336},
abstract = {An der Technischen Universität Wien ist in den Jahren 1985 bis 1988 das VIP-System ("Vienna Integrated Prolog") entstanden. Speziell für die schnelle Interpretation der Prolog-Programme wurde nun dazu der VIP-Prozessor entworfen. Beim Design des Prozessors wurden, um den Durchsatz zu steigern, einige RISC-Technologien verwendet. Vienna Integrated Prolog ist in der Programmiersprache C implementiert. Zur Portierung auf den VIP-Prozessor wurde nun ein Entwicklungssystem benötigt. Im Rahmen dieser Arbeit wurde ein existierender C-Compiler auf den Prozessor angepasst. Als Compiler wurde ein Produkt der Free Software Foundation ausgewählt, das unter dem Namen GNU-C bekannt ist. Dieser optimierende Compiler ist durch das Erstellen einer sogenannten Maschinenbeschreibung auf einen neuen Prozessor portierbar. Der Compiler wird kontinuierlich erweitert und ist kostenlos erhältlich.},
keywords = {compiler, optimization},
note = {Diplomarbeit, in German},
}