Visual Analytics: A Method to Explore Natural Histories of Oral Epithelial Dysplasia Article
Stan Nowak, Miriam Rosin, Wolfgang Stuerzlinger, Lyn Bartram
Abstract:
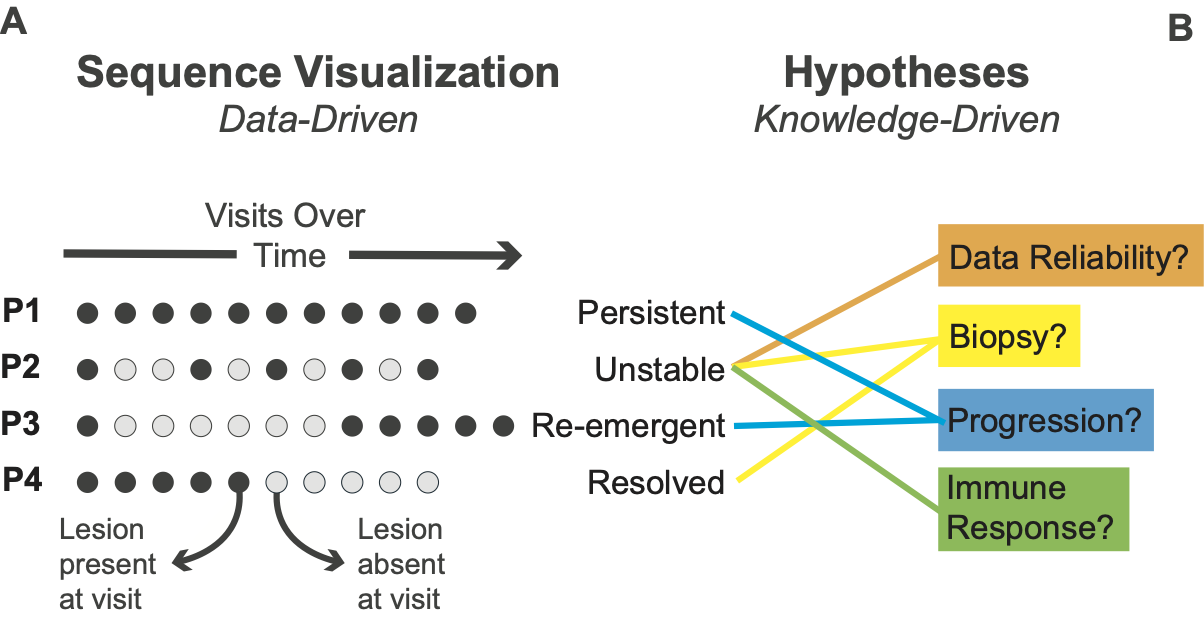
Risk assessment and follow-up of oral potentially malignant lesions in patients with mild or moderate oral epithelial dysplasia is an ongoing challenge for improved oral cancer prevention. Part of the challenge is a lack of understanding of how observable features of such dysplasia, gathered as data by clinicians during follow-up, relate to underlying biological processes driving progression. Current research is at an exploratory phase where the precise questions to ask are not known. While traditional statistical and the newer machine learning and artificial intelligence methods are effective in well-defined problem spaces with large datasets, these are not the circumstances we face currently. We argue that the field is in need of exploratory methods that can better integrate clinical and scientific knowledge into analysis to iteratively generate viable hypotheses. In this perspective, we propose that visual analytics presents a set of methods well-suited to these needs. We illustrate how visual analytics excels at generating viable research hypotheses by describing our experiences using visual analytics to explore temporal shifts in the clinical presentation of epithelial dysplasia. Visual analytics complements existing methods and fulfills a critical and at-present neglected need in the formative stages of inquiry we are facing.
